
Are We Headed For A 1970s-Style Second Wave?
A look back at the 1970s vs today, and themes to watch for

The Chart that Haunts the Fed
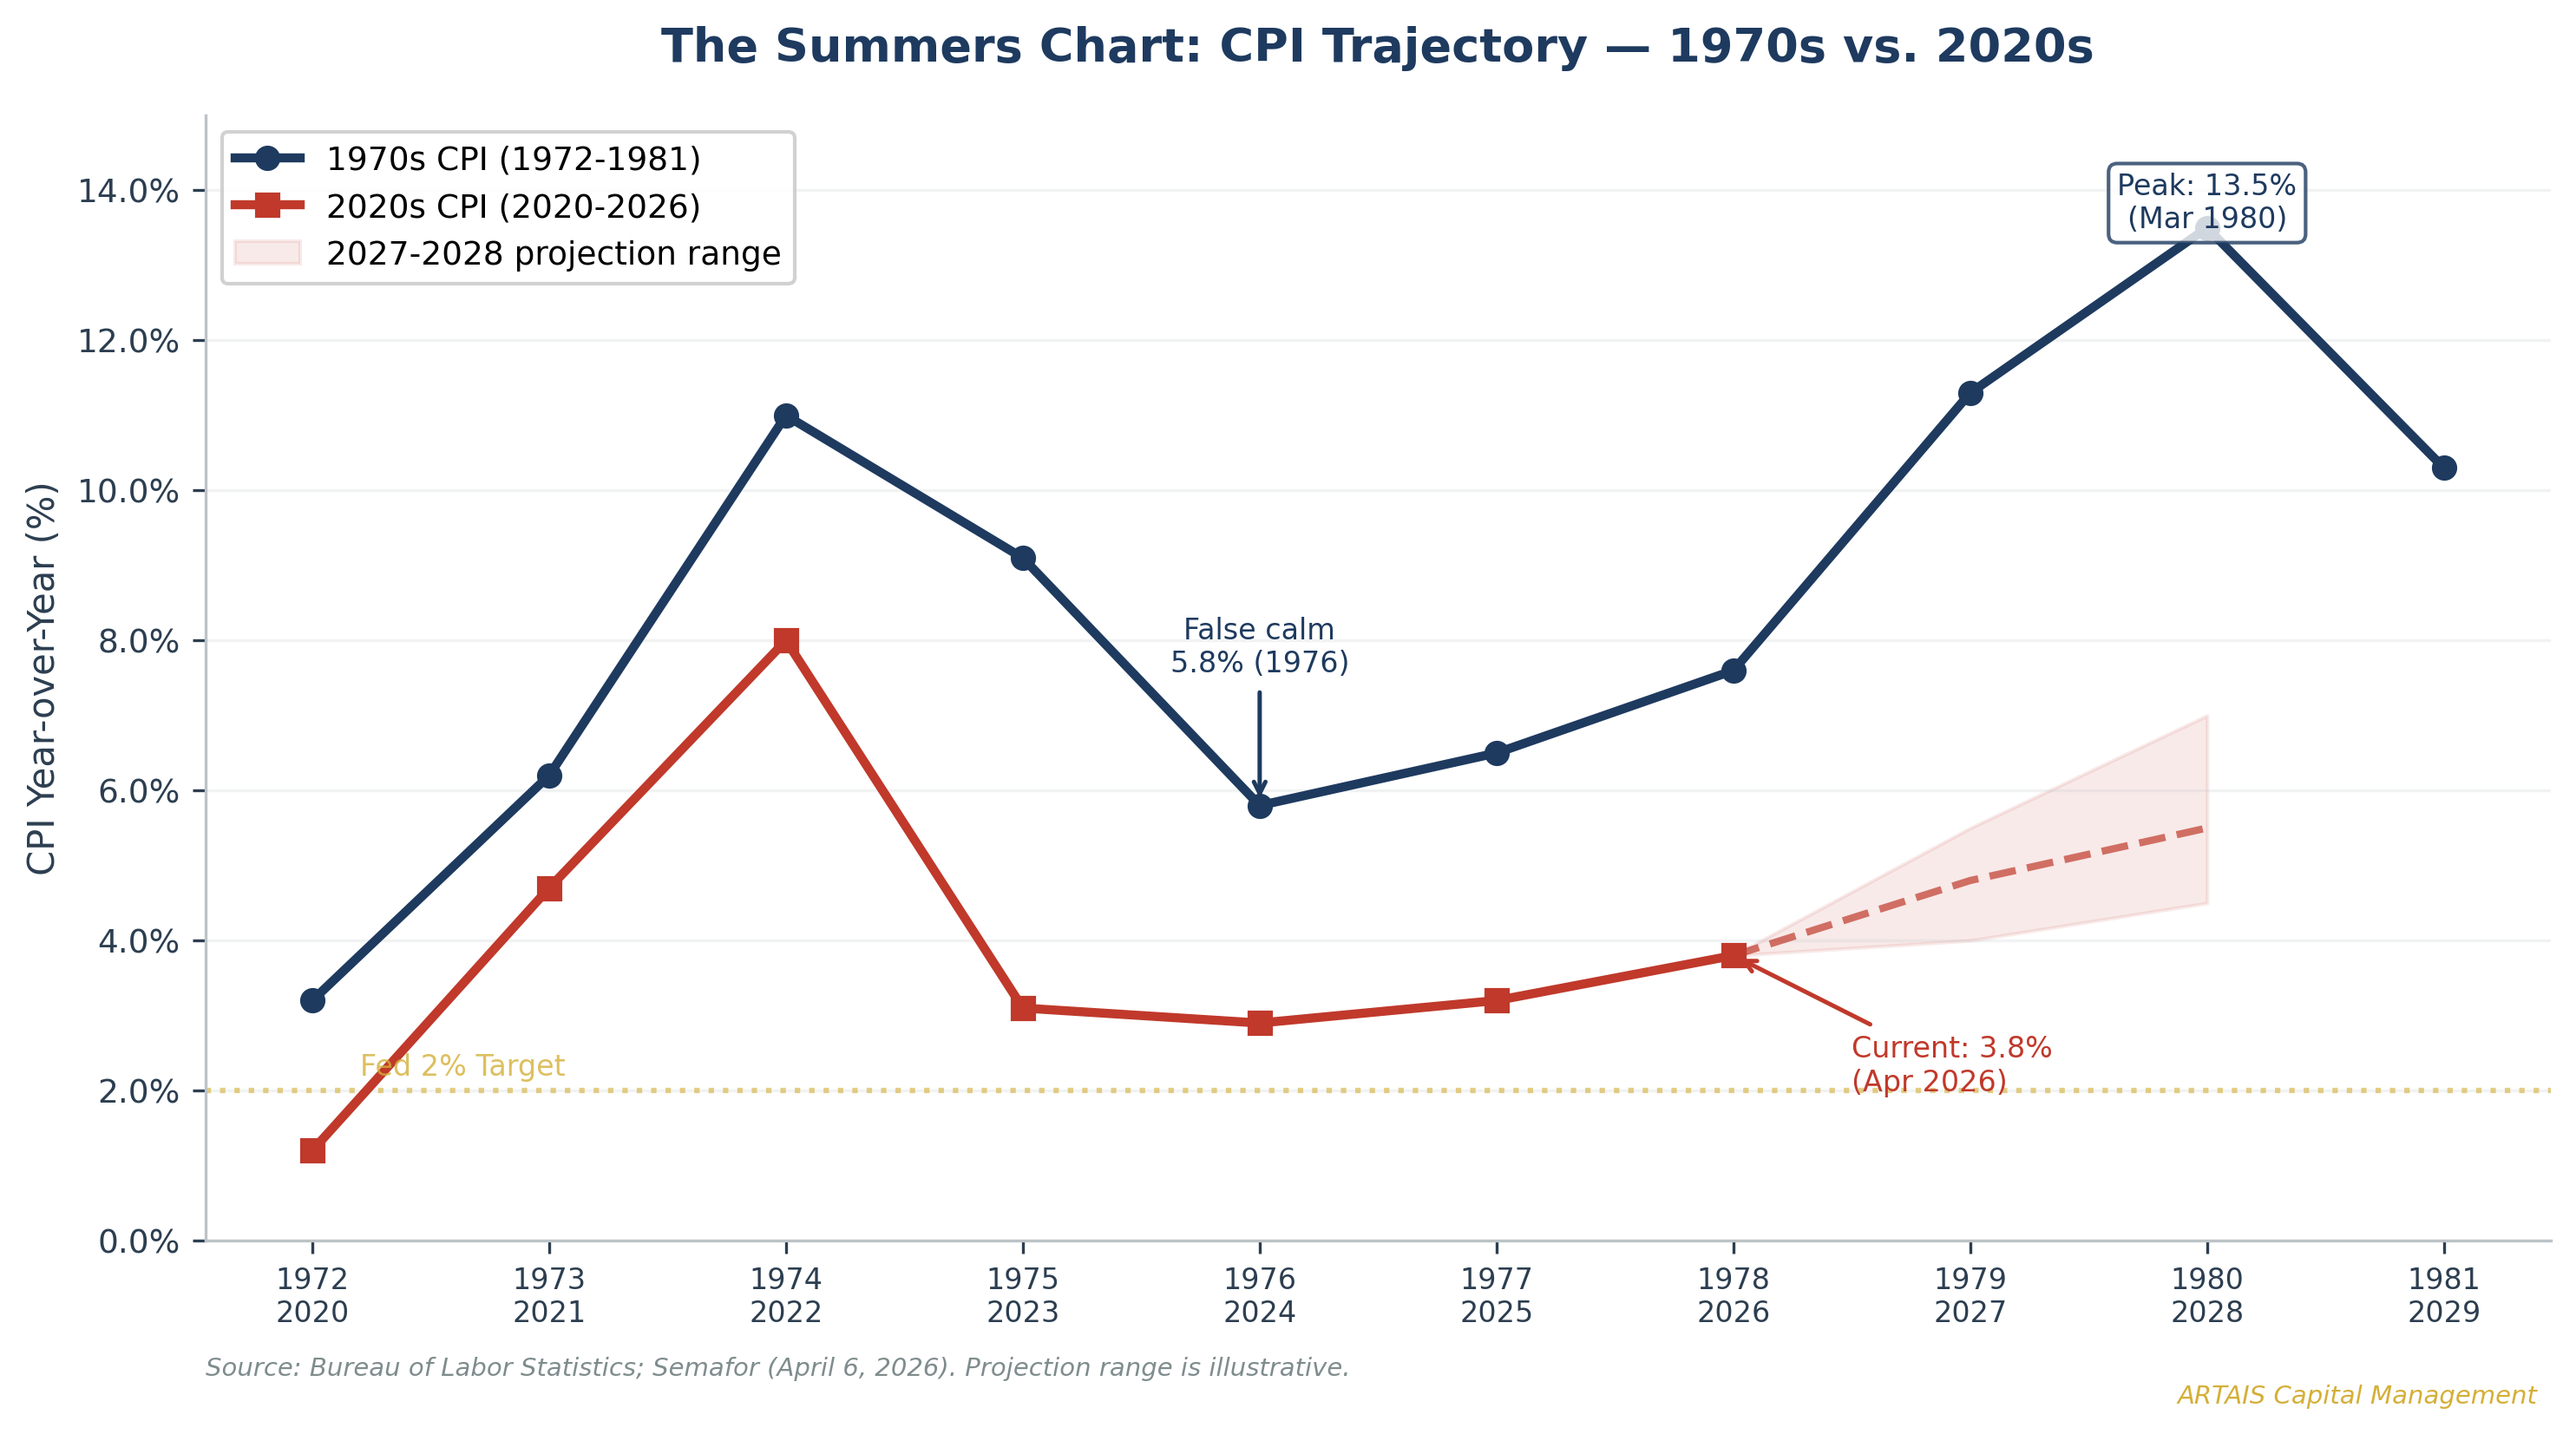
In August 2023, Larry Summers posted a chart that made Wall Street uncomfortable. It overlaid the current inflation trajectory onto the CPI path from the mid-1970s, and the two lines tracked each other with unnerving precision.
The decline from the post-COVID peak mirrored the temporary decline after the first oil shock, right before inflation roared back in the late 1970s.
Critics dismissed it as a “chart crime” -- a convenient visual trick that cherry-picked start dates.
Three years later, Summers has updated that chart. The dotted projection line now extends through 2027, and market-implied inflation forecasts are tracking the path of the 1979 spike.
Source: Larry Summers
This is no longer an academic exercise. CPI hit 3.8% year-over-year in April 2026 -- the highest reading since May 2023 (Bureau of Labor Statistics, May 12, 2026).
Energy prices drove over 40% of the monthly increase. The Strait of Hormuz remains partially obstructed. NOAA forecasts a Super El Niño as the most likely outcome for late 2026.
And the Cleveland Fed has published research showing that consumer inflation expectations are functionally more unanchored today than they were at the peak of the 1970s crisis.
The question is no longer whether the parallels exist. It is: Will the parallels hold?
I’ve spent the past several weeks digging into this. What follows is a comprehensive look at 1970s inflation, economists warning about a repeat, the specific catalysts that could trigger a second wave, and how investors were positioned then.
Part I: The 1970s -- How Inflation Came in Waves
The First Wave (1972-1975):
The first inflation wave did not begin with oil. It began with policy.
The Vietnam War had been pumping fiscal stimulus into an overheating economy since the mid-1960s. By 1968, the war was costing roughly $3 billion per month, and the federal budget had expanded to $179 billion.
During this time, the federal deficit jumped from 0.2% of GDP in 1965 to 2.7% by 1968. Consumer prices, which had been rising at 1.3-1.6% annually through 1965, accelerated to 5.8% by 1969.
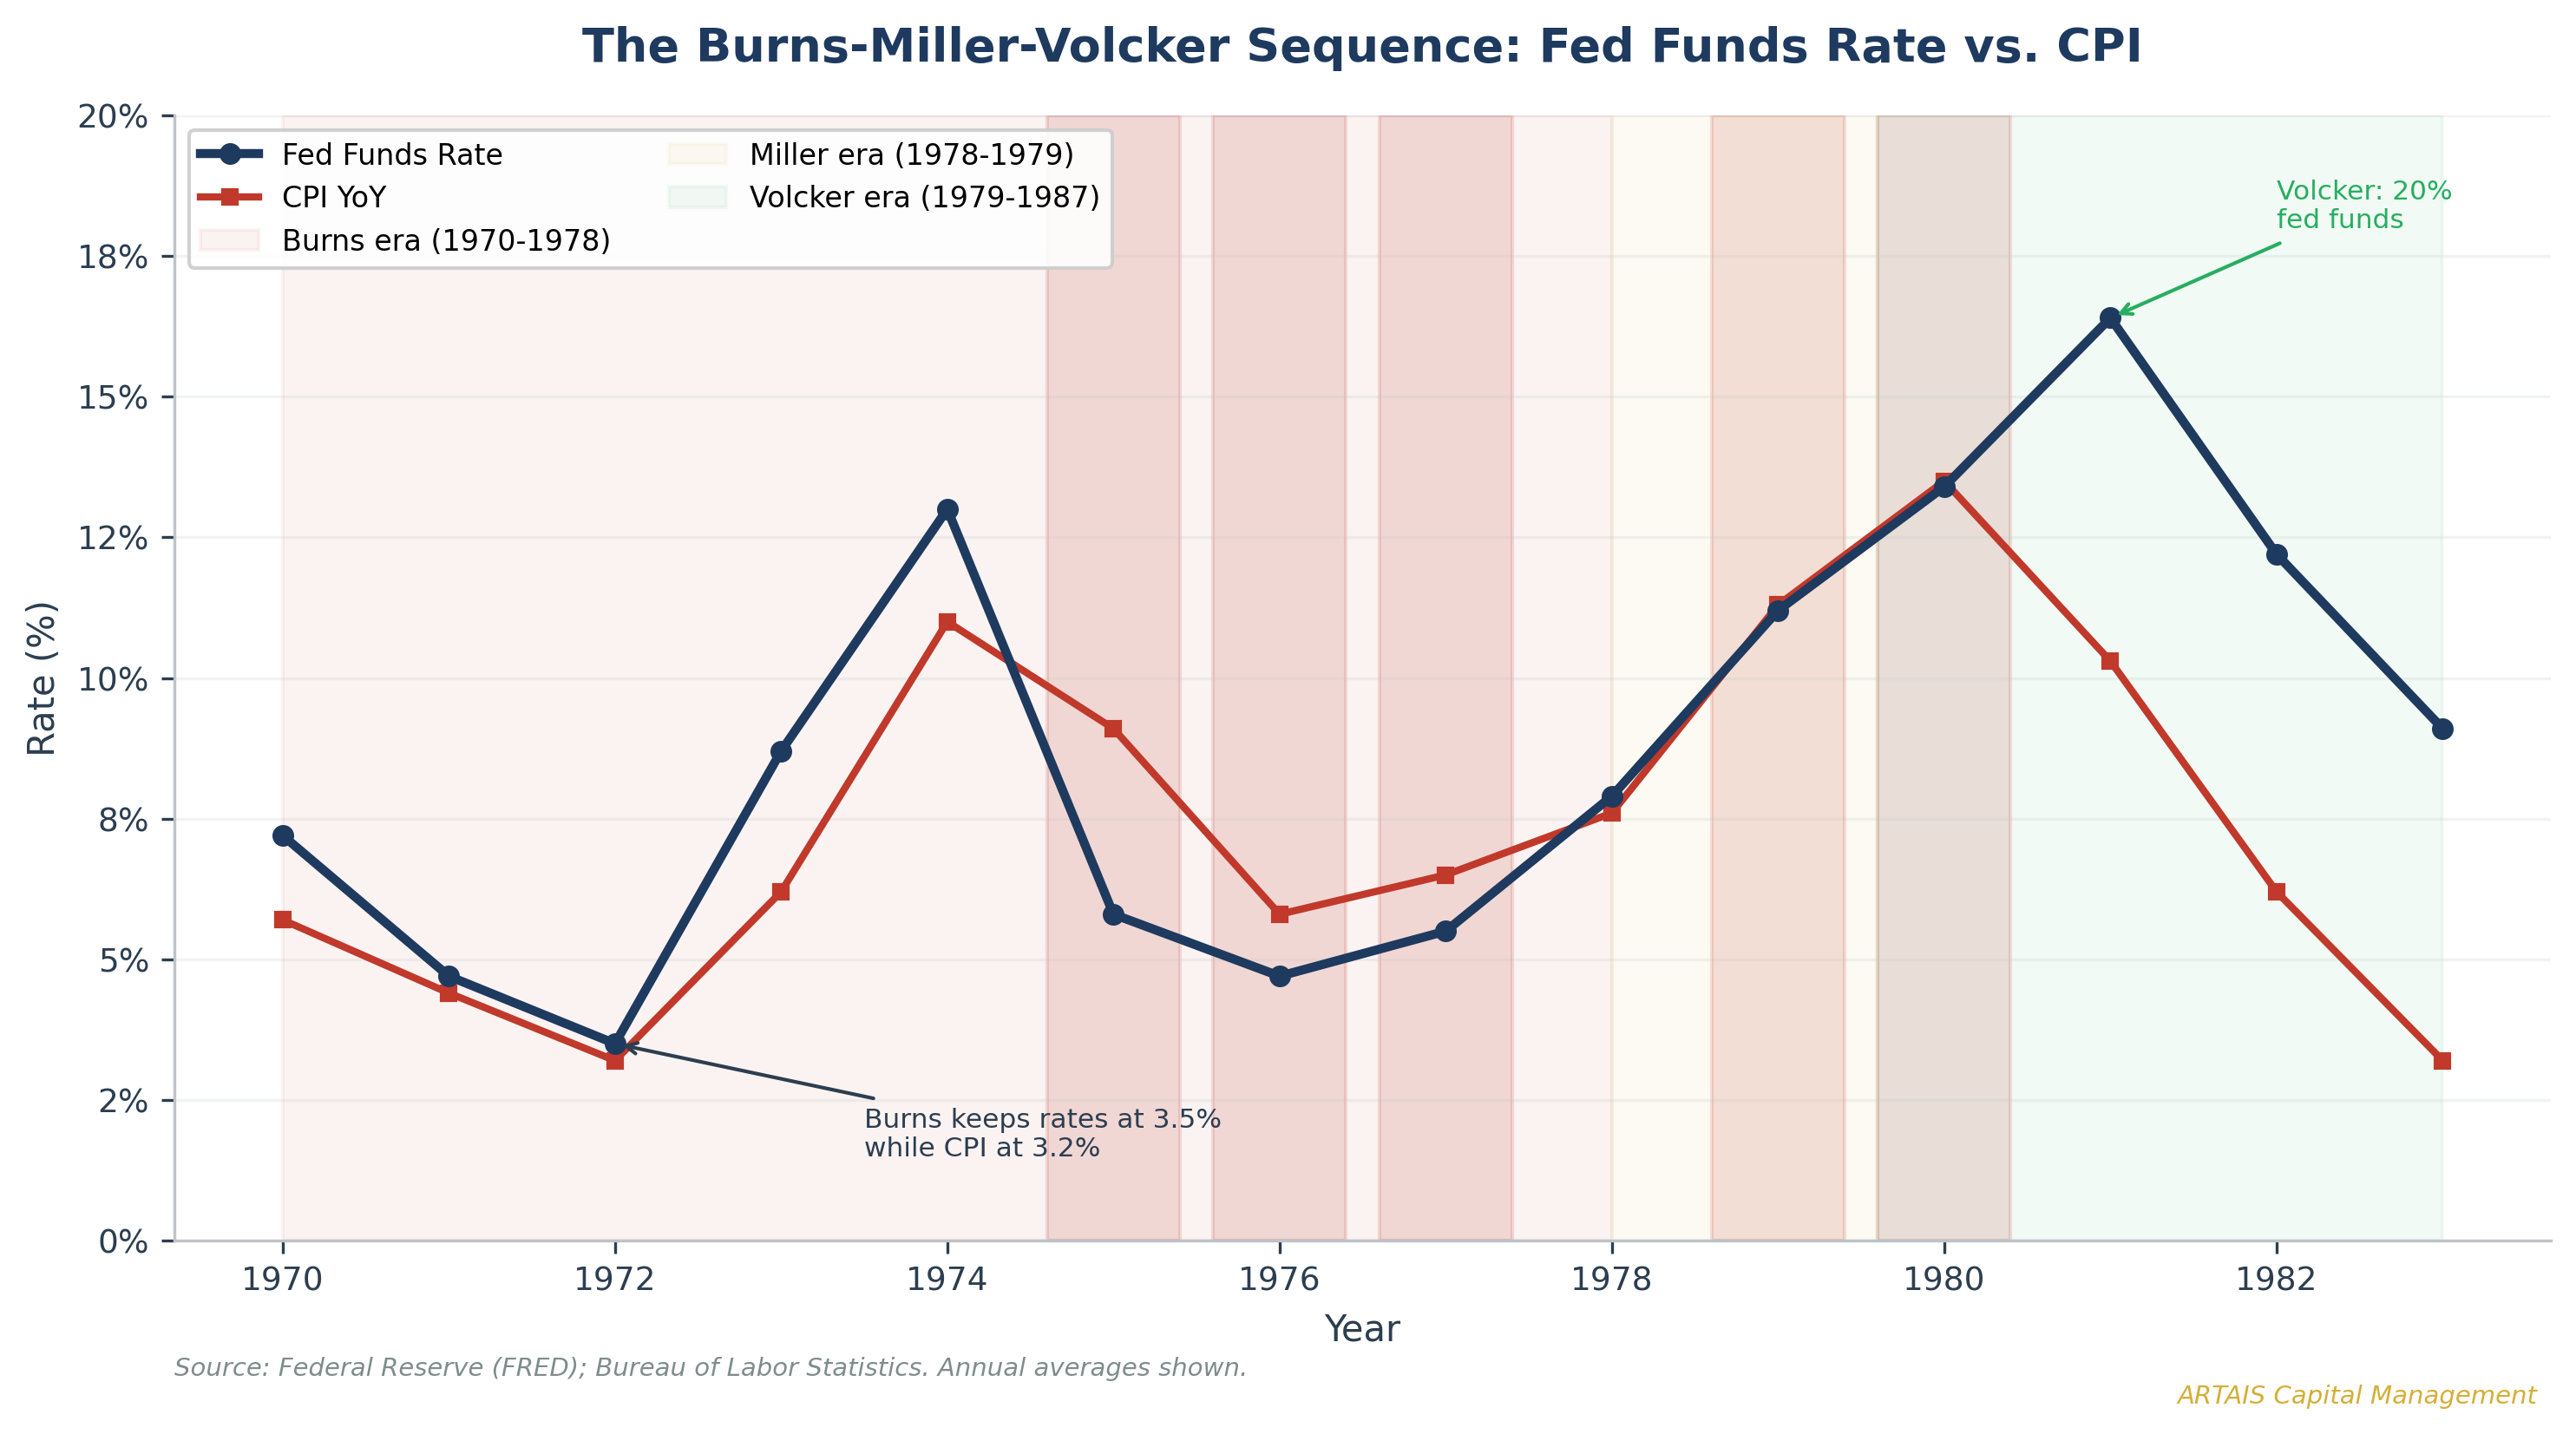
President Nixon, who was facing reelection in 1972, pressured then Fed Chair Arthur Burns to keep monetary policy accommodative.
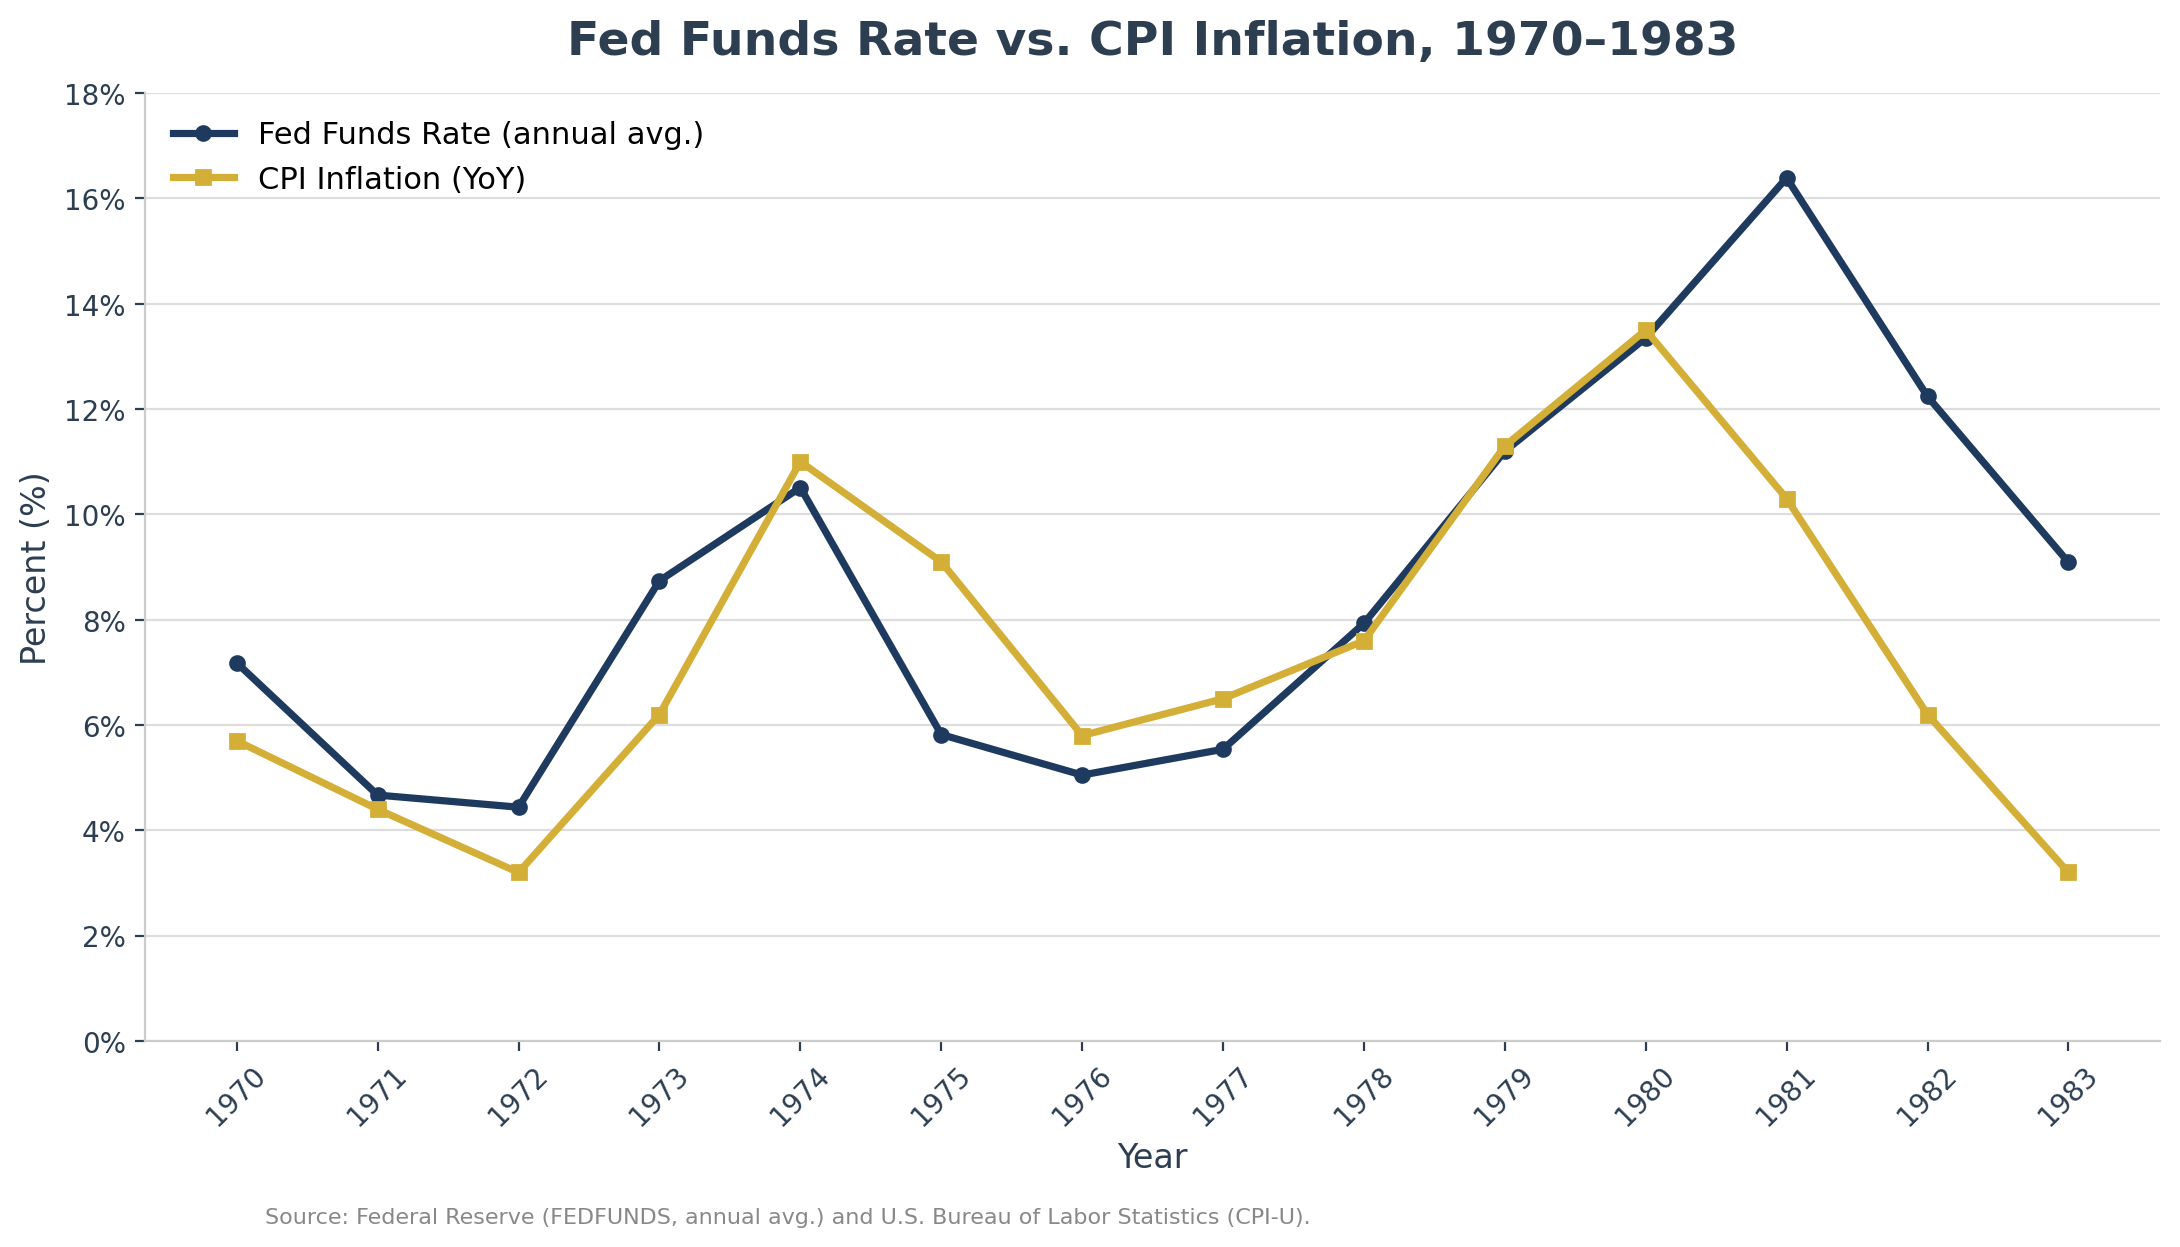
Burns complied. The federal funds rate was 3.5% in early 1972 even as inflation was already running above 3%.
Nixon compounded the problem with wage and price controls under the Economic Stabilization Program of August 1971.
While this temporarily suppressed reported inflation, it created massive imbalances in supply chains and commodity markets. When the controls were removed in 1973, a wall of pent-up pricing pressure hit the economy all at once.
Then came the external shock.
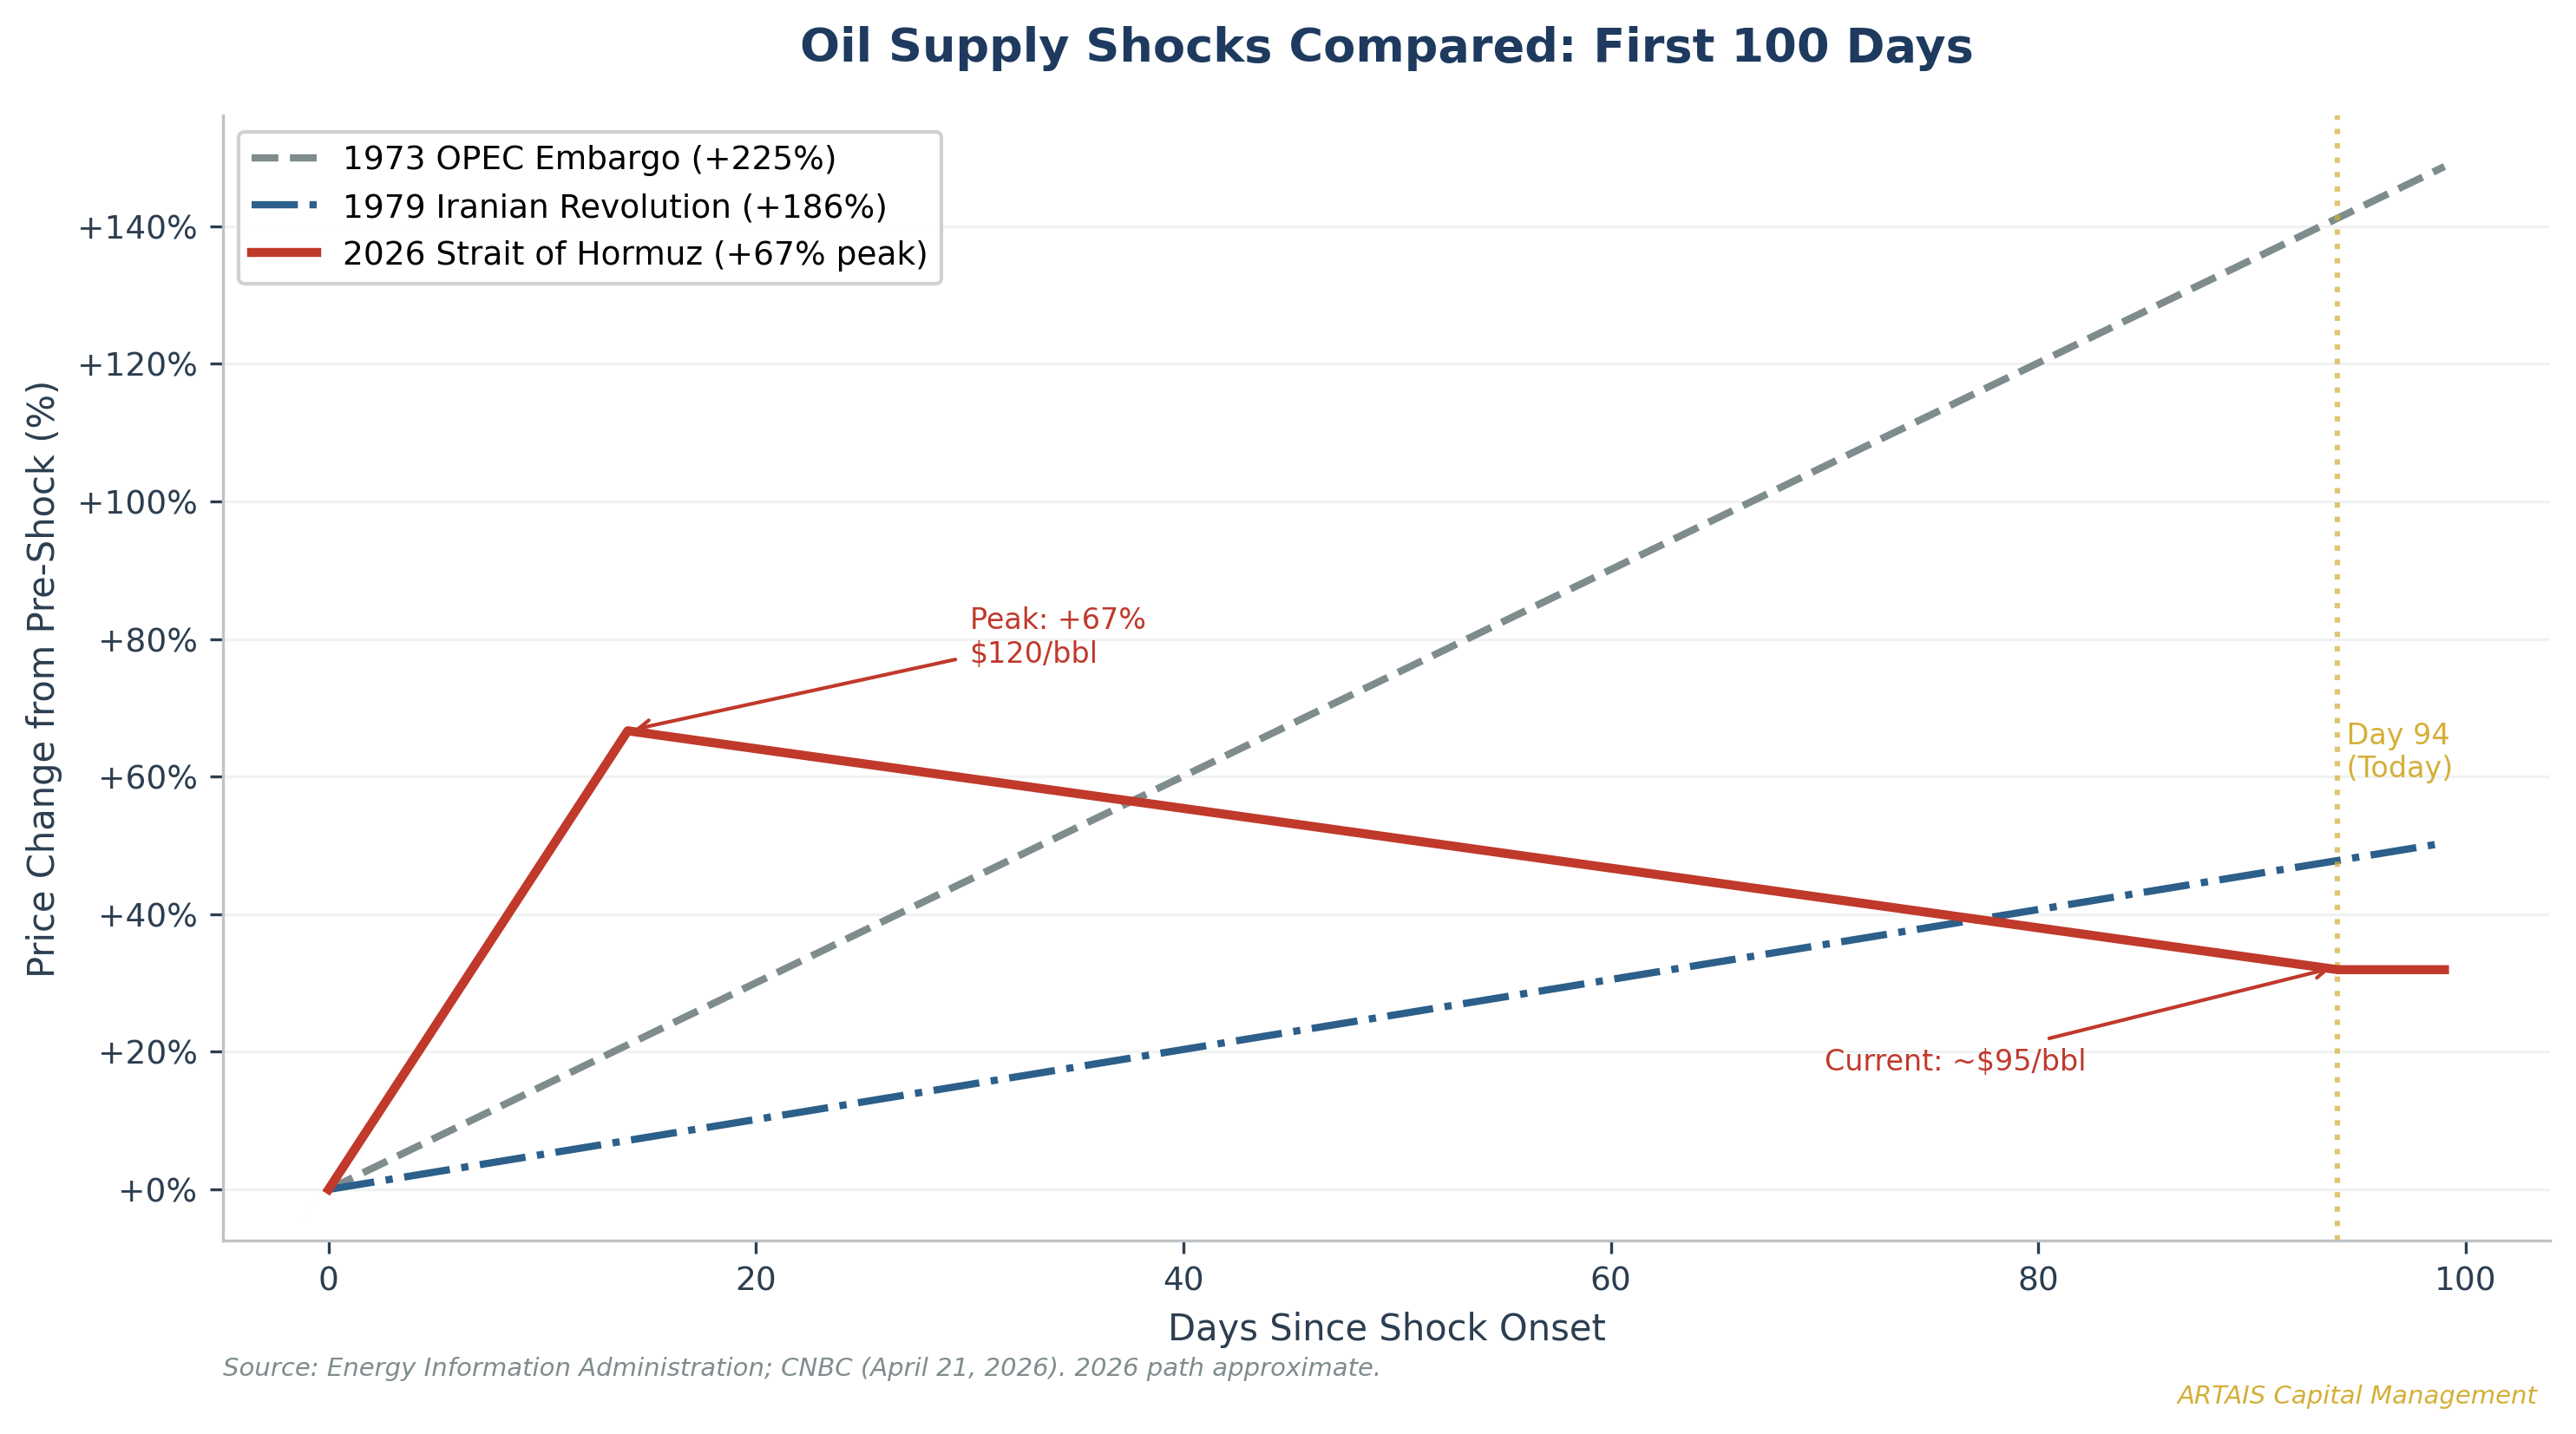
In October 1973, OPEC imposed an oil embargo against the United States in retaliation for its support of Israel during the Yom Kippur War. Crude oil prices quadrupled from $3.56 per barrel to $11.58 between October 1973 and March 1974.
The combination was devastating. CPI surged from a 3.2% annual average in 1972 to 11.0% in 1974, a 7.8 percentage point increase in just two years.
This helped tip the economy into recession. Unemployment rose from 4.6% to 9.0%. The word “stagflation” entered the popular vocabulary.
Declaring Victory Too Early (1975-1977)
By 1976, it looked like the worst was over. CPI had declined from its 11% peak to 5.8%. The recession had ended. Oil prices had stabilized. The stock market was recovering.
Fed Chair Burns began easing monetary policy to support the recovery and lowered the federal funds rate from 13% in mid-1974 to below 5% by early 1977.
He treated the inflation episode as a one-time supply shock that had passed -- not as a structural shift in price expectations that required sustained restrictive policy.
This was the critical mistake.
The problem was that inflation had never returned to its pre-shock baseline. CPI bottomed at 5.8% in 1976 — nearly double the 3.2% average of 1972.
Inflation expectations had shifted upward. Workers demanded cost-of-living adjustments. Union contracts included 8-10% annual wage increases.
Businesses had learned they could pass through higher costs without losing customers. The wage-price spiral was already in motion, even as the headline numbers suggested progress.
This is the period Summers argues we are currently in.
CPI peaked at 8.0% in mid-2022 and has since declined - but to 3.8%, not to 2%. The Fed cut rates from 5.50% to 3.50% before inflation returned to target.
The parallel is uncomfortable.
The Second Wave (1978-1980)
The second wave hit harder than the first. CPI, which had never fully cooled below 6%, began re-accelerating in 1978.
Then the Iranian Revolution of January 1979 removed 5.5 million barrels per day from global supply, increasing crude oil prices 186%, from $13.10 to $37.42 per barrel.
Unlike the first wave, the economy had no margin for error. Inflation expectations were already elevated. The wage-price spiral was entrenched.
And the new Fed Chair, G. William Miller (Burns’ successor), proved equally unwilling to inflict the pain that would result from aggressively raising rates.
CPI hit 11.3% in June 1979, then 13.5% by March 1980.
The entire U.S. economy was repricing around the assumption that inflation would persist indefinitely. Mortgage rates hit 18%. The 10-year Treasury yield reached 15.84% in September 1981.
It took Paul Volcker, appointed as the Fed Chair in August 1979, raising the federal funds rate to 20% and deliberately engineering two recessions to finally break the inflation cycle.
Unemployment hit 10.8% in November 1982 -- the highest since the Great Depression. That was the price of the Burns-Miller policy errors.
What Burns Did Wrong
I keep coming back to Burns because his mistakes are so instructive. Five specific failures:
Political capitulation. He explicitly accommodated Nixon’s reelection demands, keeping rates at 3.5% while inflation ran above 3%.
Stop-go policy. He tightened when inflation surged, then eased as soon as growth softened. Each cycle left the inflation floor higher than before.
Negative real rates during the false calm. The fed funds rate fell below the CPI rate for much of 1975-1977. In effect, the Fed was subsidizing inflation while claiming to fight it.
Credibility destruction. After eight years of stop-go, markets and wage-setters learned to expect that the Fed would always blink.
Misdiagnosis. He treated inflation as a supply-side phenomenon that monetary policy couldn’t address. His job was to prevent a one-time shock from becoming a sustained wage-price spiral. He failed.
Volcker’s approach was the mirror image.
On October 6, 1979, during a Saturday unscheduled FOMC meeting, he announced the most significant change in Fed operating procedures since the Treasury-Fed Accord of 1951.
Instead of managing the fed funds rate, the Fed would target the volume of bank reserves, explicitly allowing rates to rise as high as necessary.
The “Saturday Night Special” produced two recessions and unemployment of 10.8%, but it worked.
Part II: The Second Wave Thesis
Larry Summers
Summers, the Harvard professor, former Treasury Secretary, and the economist who correctly predicted the post-COVID inflation surge in February 2021 when most dismissed it - has been the most persistent voice.
His April 2026 update to the comparison chart came with a blunt assessment: the neutral interest rate is approximately 4.5%, well above the Fed’s estimate of 3%. If Summers is right, the Fed has been running too accommodative of a policy to fight inflation.
On the fiscal situation, Summers has described things as “fragile” and “on the brink of a crisis,” noting that DOGE failed to produce meaningful spending reductions while global investors are “edging away from Treasury bonds.”
Nouriel Roubini
Roubini doesn’t use the same 1970s-chart framing. His argument is broader: we are entering a prolonged era of “secular stagflation” in which inflation settles 2-3 percentage points above pre-pandemic norms.
His specific near-term forecast from July 2025 (that core CPI would climb to 3.5% by the second half of 2025) was correct.
In March 2026, Roubini warned of “Trumpflation risks” driven by tariffs, immigration restrictions tightening labor supply, large fiscal deficits, and geopolitical energy disruptions.
Roubini has provided the most explicit probability framing: he suggested investors should diversify away from long-duration Treasuries even if they believe there is “only a 20% to 30% chance” of his stagflation scenario playing out.
Mohamed El-Erian
El-Erian frames the risk through the 1977-1979 Carter/Burns lens: “There’s a real question mark as to whether this is a Reagan moment... or is this a Jimmy Carter moment in which the U.S. ends up in stagflation and ultimately recession?”
He notes U.S. financial markets are exhibiting patterns “more typical of developing countries,” including dollar weakness alongside rising yields.
His working probability: roughly a 30% chance of a Carter/stagflation outcome.
Jim Bianco
Bianco’s argument at the May 2026 Strategic Investment Conference was structural: “Six years into the post-COVID environment, the inflation rate is still 3% or higher, and they can’t get inflation below 3%.”
His core observation is that the Fed has effectively validated a new inflation floor. Every time they attempt to tighten, markets break, and they reverse, a pattern that mirrors the Burns-era stop-and-go.
Lacy Hunt
Hunt represents a notable case of a committed deflationist who revised his outlook.
At the May 2026 SIC, Hunt stated: “The current oil shock could lift the CPI by as much as 240 to 300 basis points.”
His pivot centers on two specific policy errors: the Fed’s December 2025 decision to purchase $40 billion in Treasury bills monthly and the Strait of Hormuz disruption. Hunt drew the Arthur Burns parallel explicitly.
The Cleveland Fed’s Dispersion Research
This might be the most underappreciated finding…
The Cleveland Federal Reserve published data in February 2026 showing that when you measure not just the level of consumer inflation expectations but the dispersion (which shows how widely scattered those expectations are), the degree of unanchoring in early 2025 exceeded the 1970s peak.
Consumer one-year-ahead expectations hit 9%, and the distribution was more dispersed than in any period since the University of Michigan survey began.
Part III: Oil -- The Primary Catalyst
The Strait of Hormuz crisis
On February 28, 2026, the U.S. and Israel launched coordinated airstrikes on Iran under Operation Epic Fury. Iran’s closure of the Strait of Hormuz on March 4 effectively removed approximately 20% of global energy supply from the market. Tanker traffic dropped 70% immediately and then fell to near-zero.
The IEA has called this “the biggest oil disruption in history.”
As of early June, Day 94 of the effective closure, only about 10 ships per day are transiting the Strait compared to the pre-war baseline of 95. Iran walked away from ceasefire negotiations on June 1, reversing progress that had briefly pushed oil prices lower.
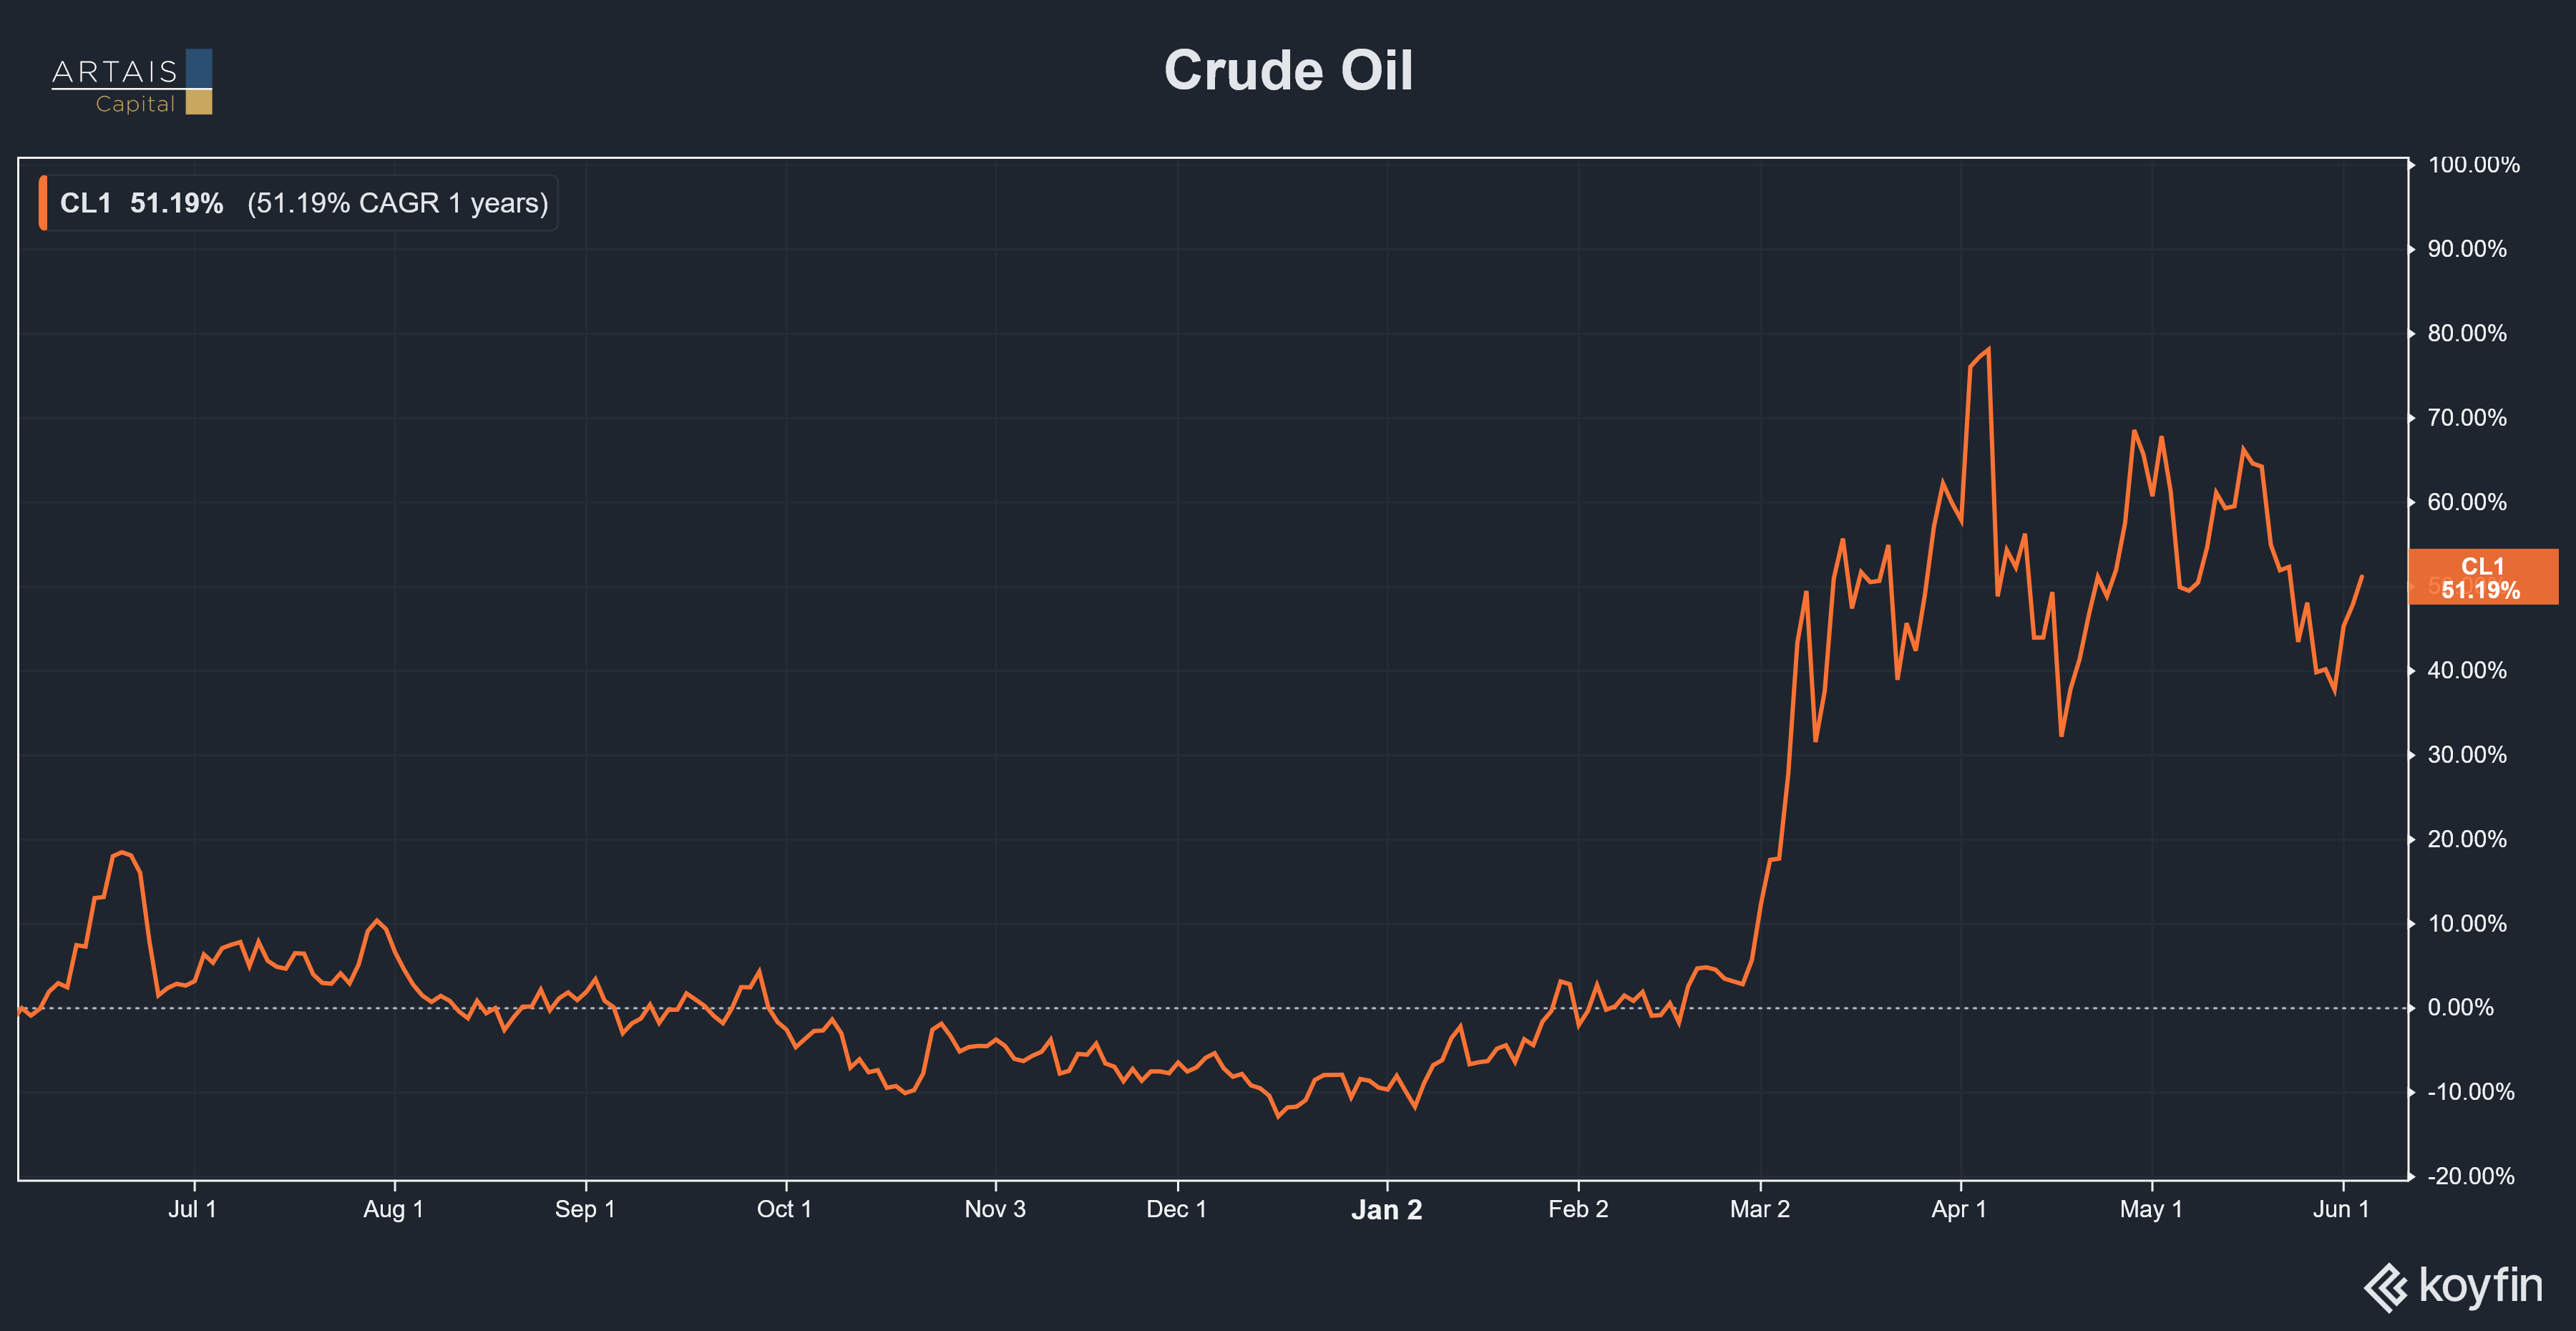
Brent crude surged from approximately $72 per barrel on February 27 to nearly $120 at its peak in March -- a 67% increase.
Current readings: WTI at $94.60 and Brent at $97.13 as of June 2, 2026. WTI is up approximately 41% since the war began, from its $67.02 close on February 27.
The Stranded Spare Capacity Paradox
OPEC+ has roughly 5 million barrels per day of spare production capacity.
Under normal circumstances, that would be more than enough to offset a supply disruption. The problem is that most of this capacity is stranded behind the Hormuz closure.
Saudi Arabia, the UAE, Kuwait, and Iraq all export through the Strait. Their spare capacity exists on paper but cannot reach the market.
Gavekal Research estimates Gulf exporters can reroute at most 3.5 million bpd through alternative pipelines, leaving a potential shortfall of roughly 15 million bpd in a full closure scenario.
The Inflationary Pass-Through
The Dallas Fed modeled the Hormuz closure scenario and found that WTI at $100/barrel would push annualized U.S. headline inflation 1.3 percentage points above the no-conflict baseline.
The Fed’s general rule of thumb: a 10% increase in oil prices adds approximately 0.4 percentage points to CPI.
This means the approximate 41% increase in WTI oil prices since the war began implies roughly 1.6 percentage points of headline CPI pressure from direct energy alone.
The April CPI report represents the first wave of pass-through. The second wave -- as energy costs ripple through food production, shipping, and services -- arrives in the summer and fall readings.
Economists estimate that oil price increases typically take 3-6 months to fully transmit into CPI.
The Oil Normalization Timeline
History offers some guidance, and the answer is not encouraging:
After the 1973 embargo, oil prices never returned to pre-embargo levels. Full normalization took approximately 13 years.
After the 1979 Iranian Revolution, it took until 1986 -- seven years -- for oil to fall meaningfully.
After the 2022 Russia-Ukraine spike, WTI fell from $120 to $70 within roughly 18 months.
The ADNOC CEO estimates full oil flow restoration will not happen before Q1-Q2 2027.
The concern to me is that, if oil remains above $90/barrel through the third quarter of 2026, the inflationary pass-through becomes increasingly problematic.
Part IV: The Super El Niño Wild Card
What NOAA is Forecasting
NOAA’s Climate Prediction Center forecasts an 82% probability that El Niño will develop by the end of July 2026, with a 67% chance of a strong or very strong event, aka the “Super El Niño”, peaking in November 2026 through January 2027.
For context: the 1997-1998 Super El Niño resulted in an estimated $5.7 trillion in lost global GDP over a five-year period.
The Food Price Pipeline
The food inflation pipeline is already under stress. As of May 19, 2026, 70% of U.S. winter wheat production areas were experiencing drought, along with 26% of corn and 29% of soybeans.
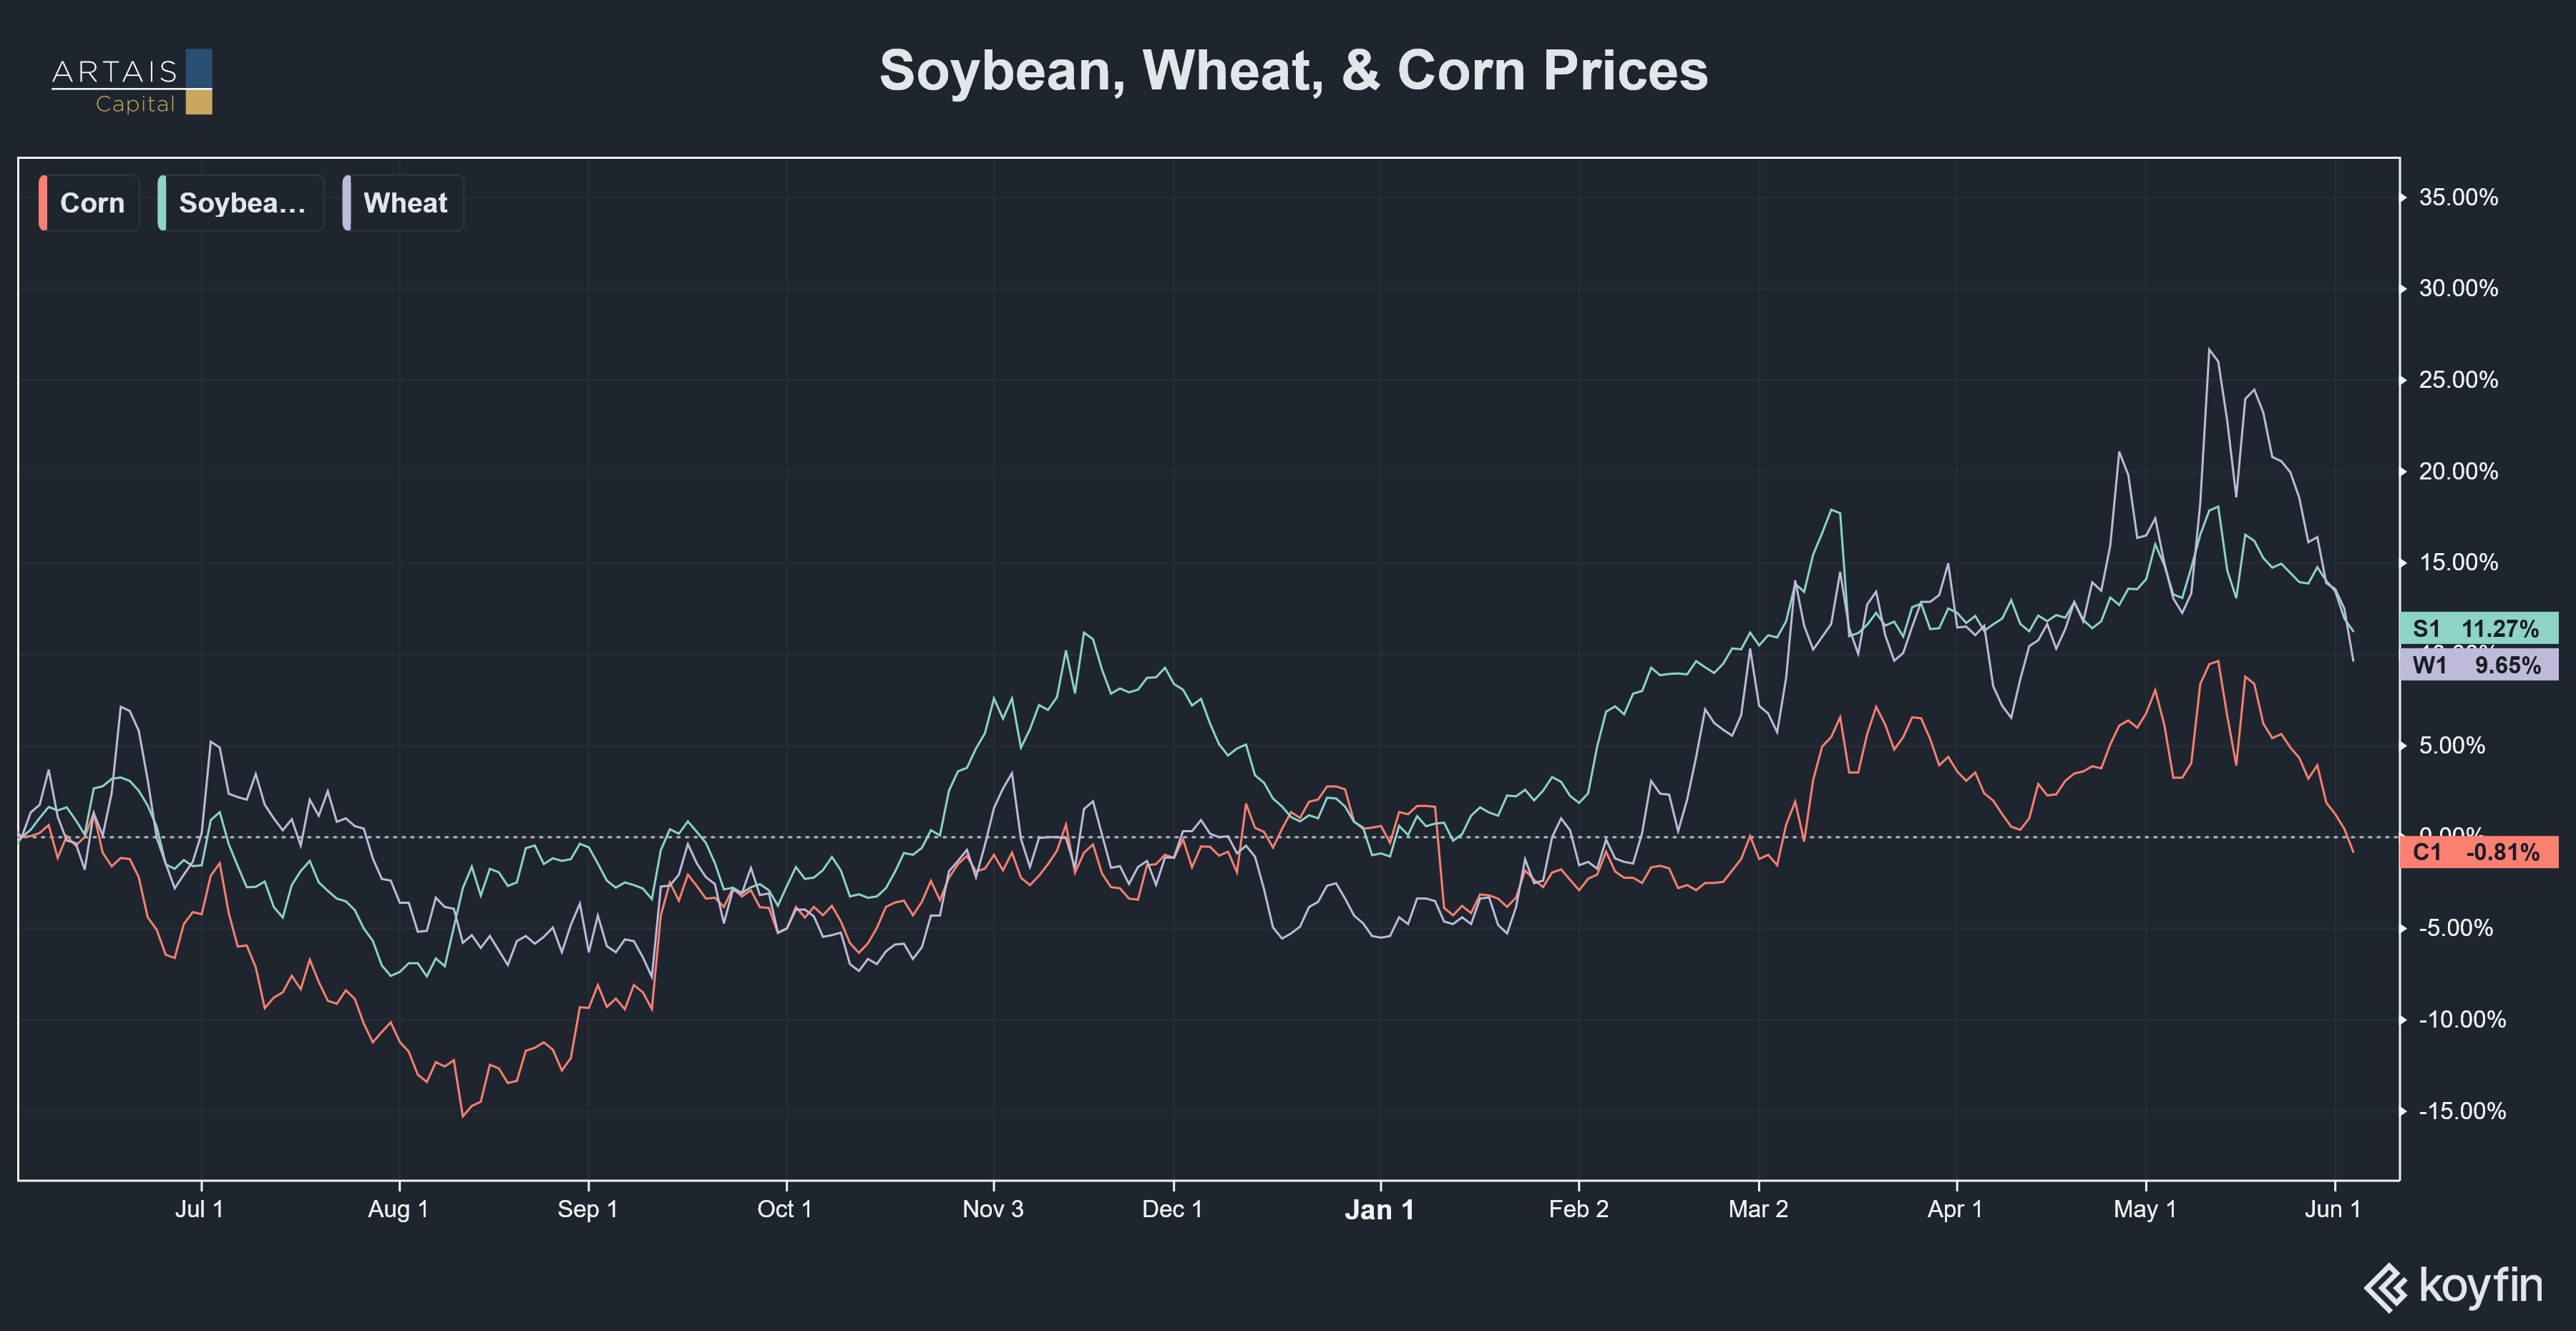
Current commodity prices confirm the early pressure:
Wheat at $601.75 per bushel, up 12.3% year-over-year
Soybeans at $1,162.50, up 11.7% year-over-year
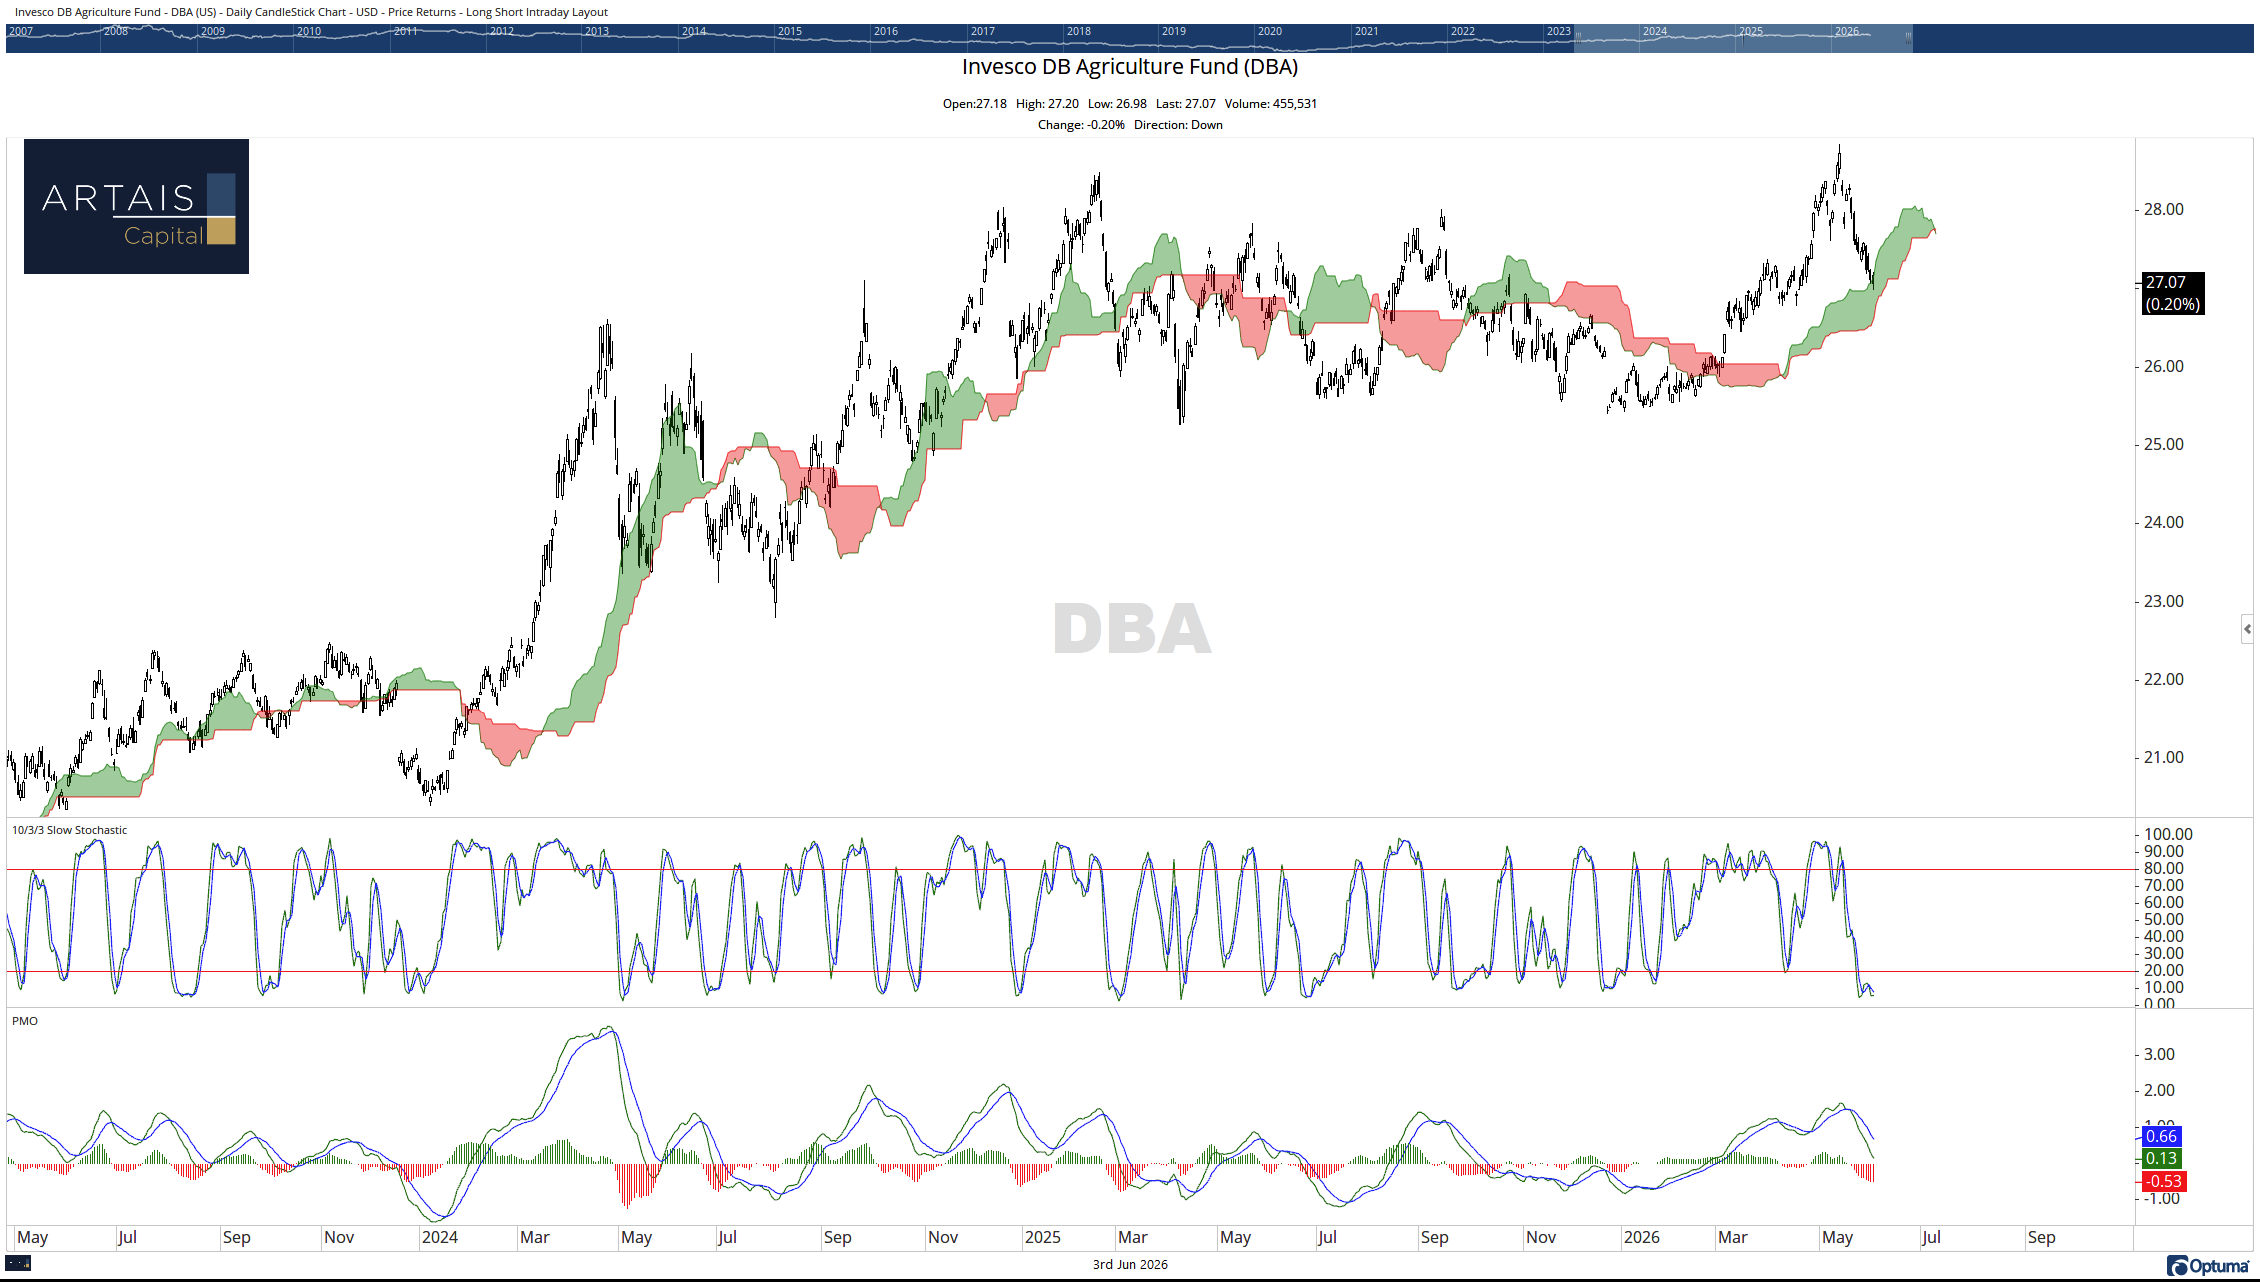
DBA agricultural commodity ETF up 6.3% year-to-date
Food represents approximately 13.5% of the CPI basket. The April CPI showed the food-at-home index rising 0.7% month-over-month -- an annualized rate of 8.4%.
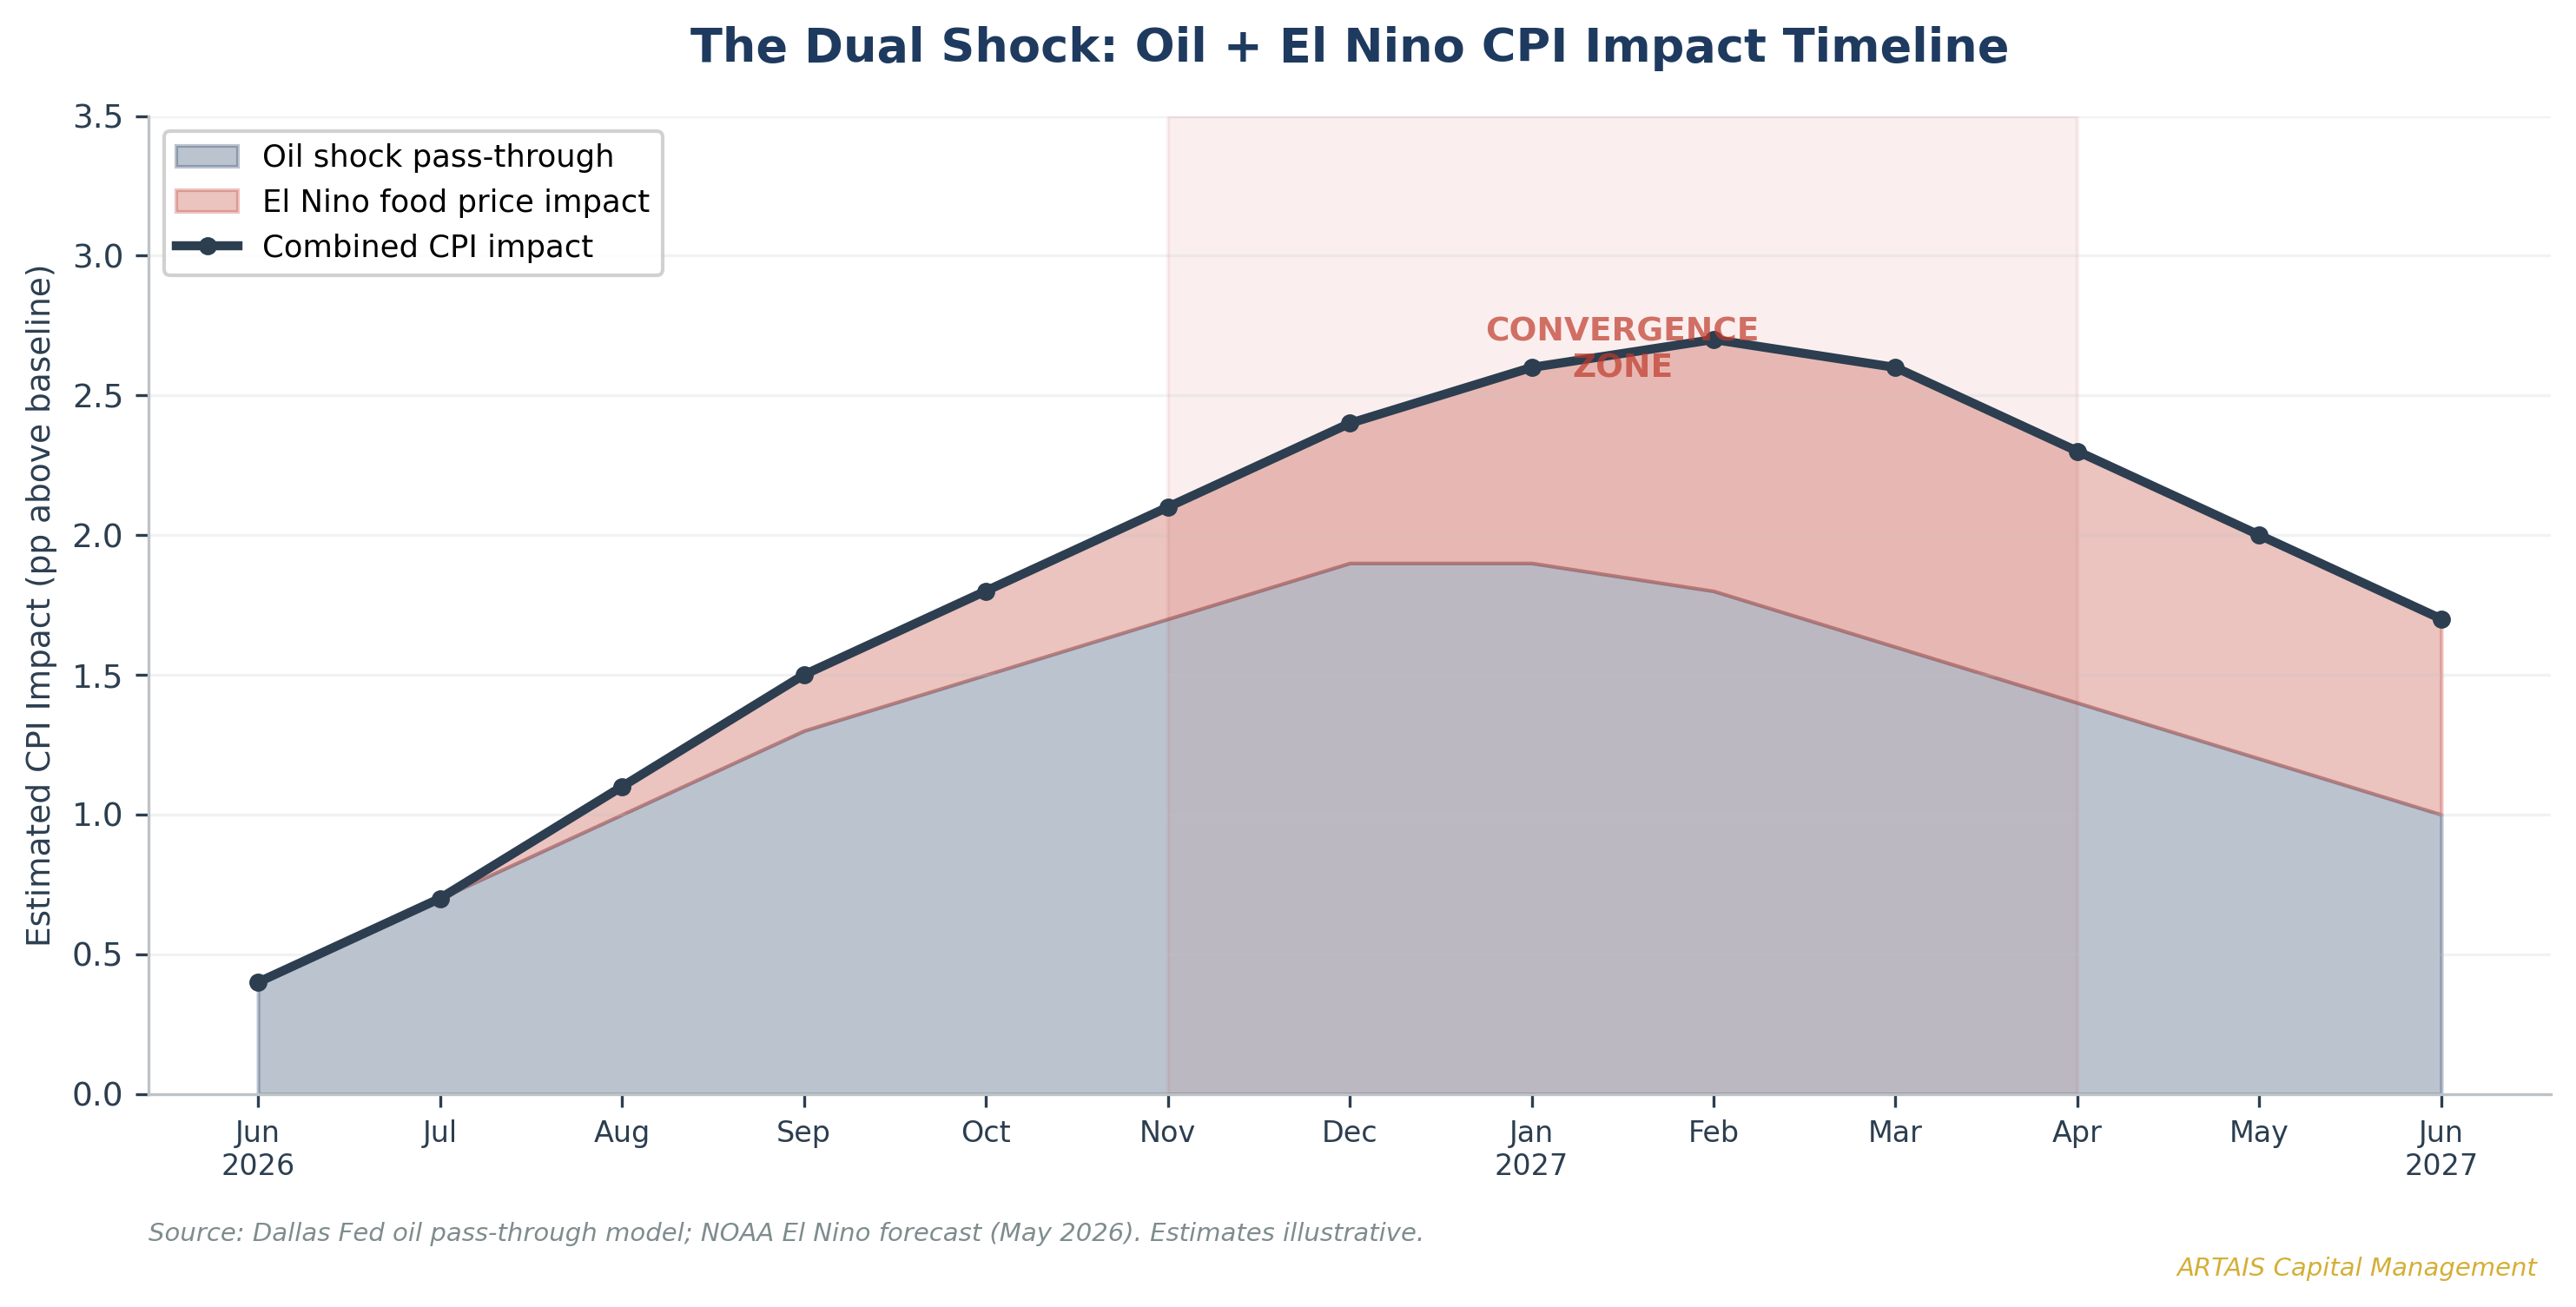
The Compounding Problem
Elevated oil prices drive up fertilizer costs (natural gas is the primary input for nitrogen fertilizer), transportation costs, and farm equipment costs simultaneously.
Iran is a major fertilizer exporter, and the war has disrupted those supply chains.
Layer a Super El Niño on top of these existing pressures, and the food inflation channel could add 0.5-1.0 percentage points to headline CPI through 2027.
The food price impulse would hit CPI readings in Q1-Q2 2027 -- precisely when the oil shock pass-through should be at maximum intensity.
Two shocks, converging at the same time.
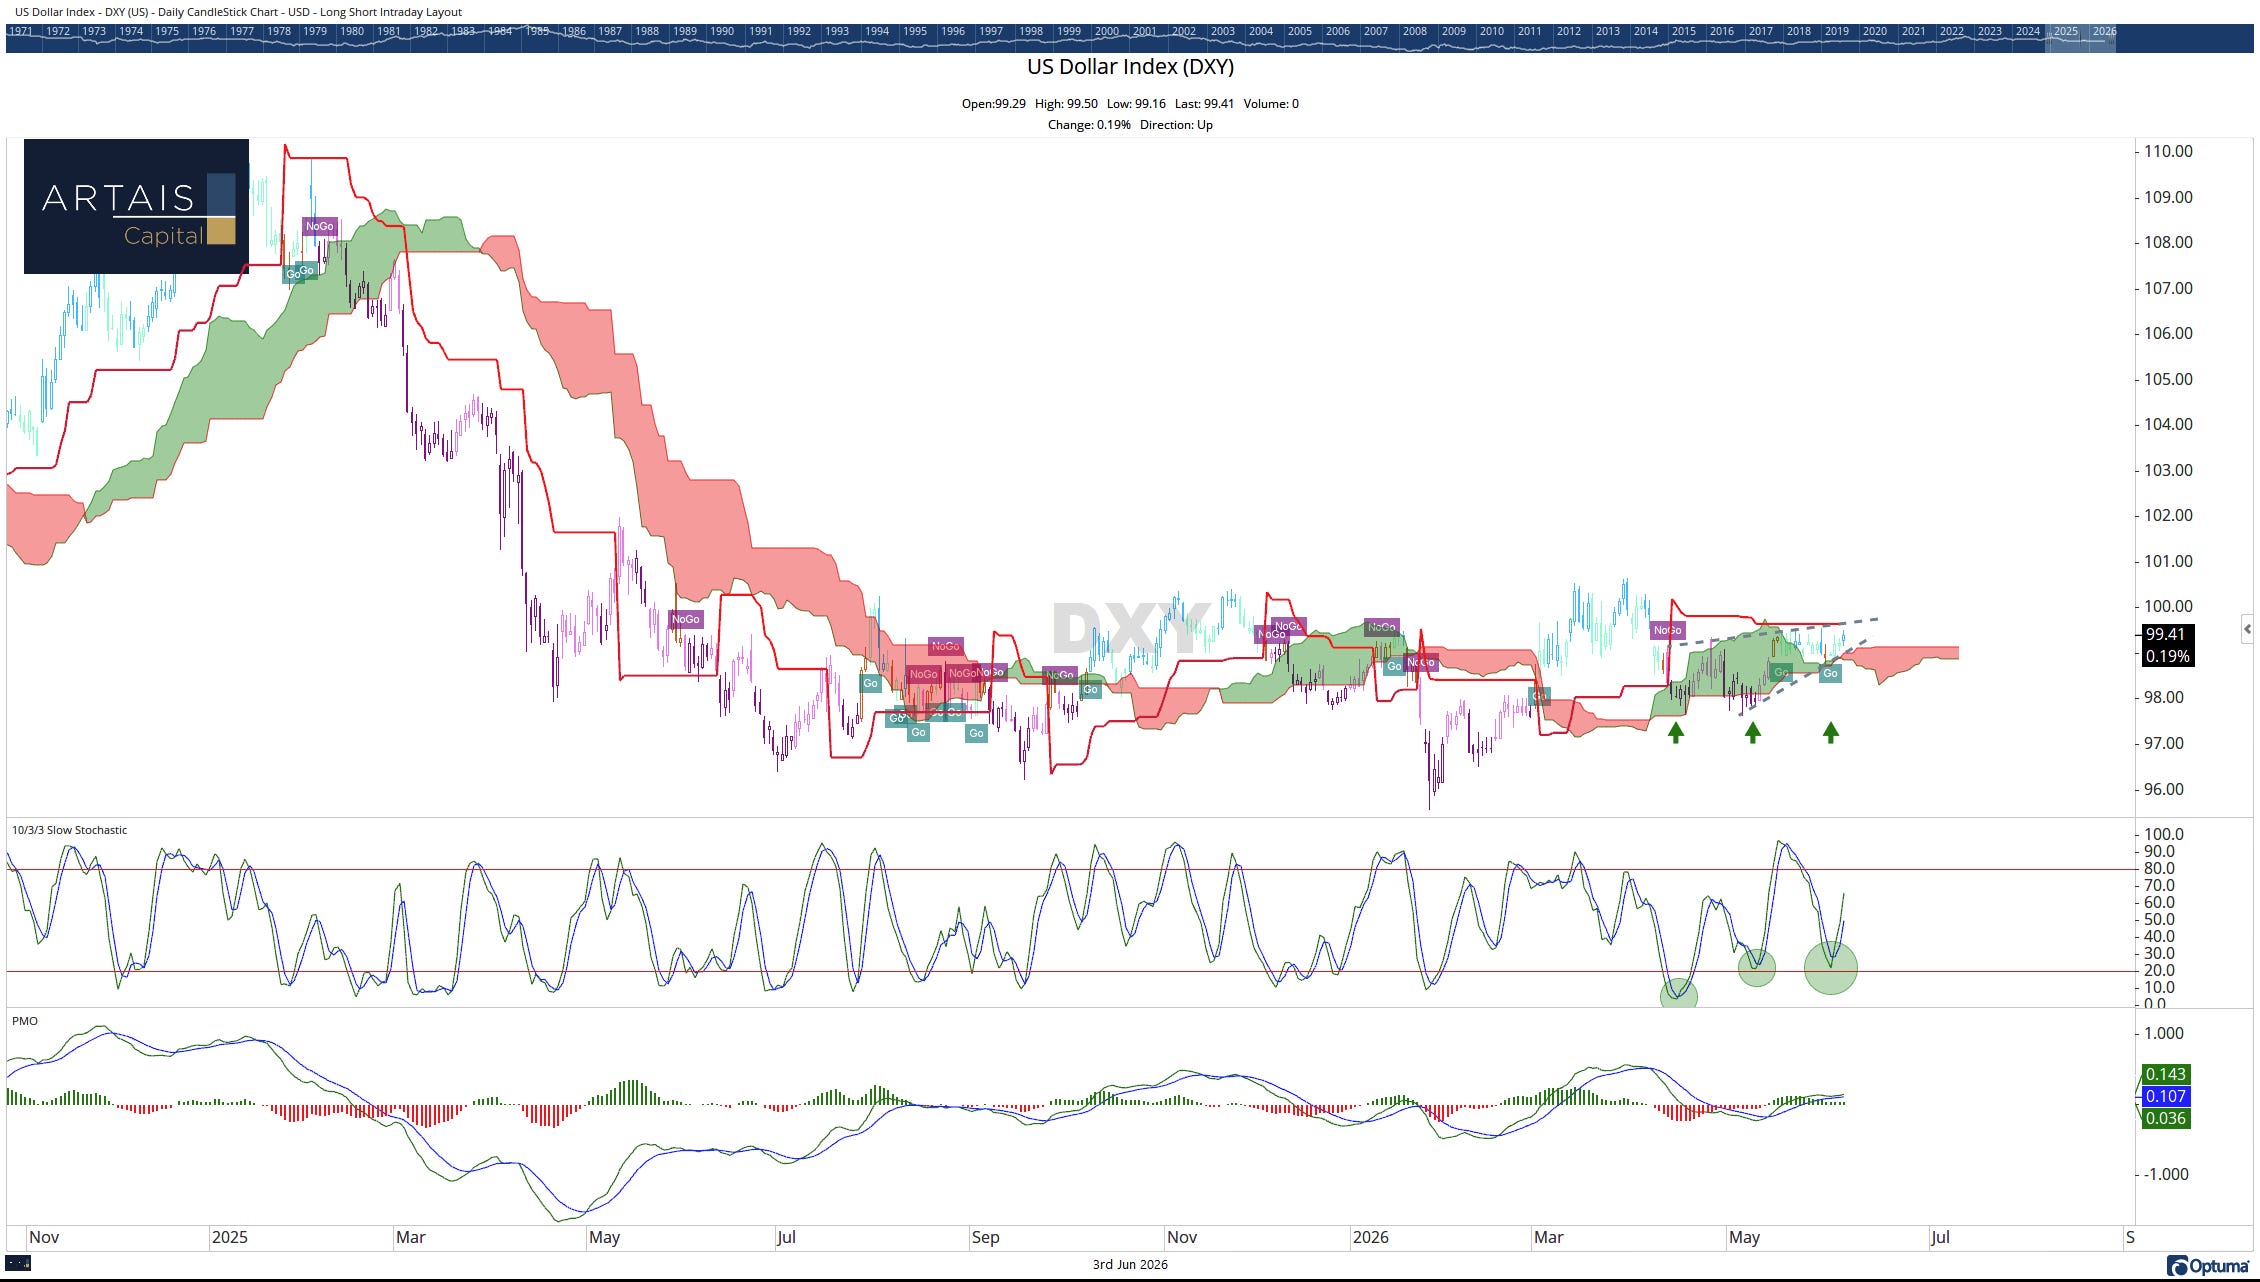
Part V: The Dollar Factor
In the 1970s, dollar weakness was a critical amplifier of inflation. Nixon’s abandonment of Bretton Woods in August 1971 removed the anchor that had kept currency markets stable.
The dollar depreciated dramatically through the decade.
Today, the dollar is range-bound. The DXY sits at approximately 99.47 as of June 2, 2026 -- virtually unchanged from a year ago. Cambridge Currencies forecasts DXY trading between 93 and 100 for the remainder of 2026.
The Scenarios That Matter
Weak dollar (DXY below 93): A declining dollar would amplify imported inflation precisely when food and energy prices are already elevated.
A 10% DXY decline historically adds approximately 0.5-0.8 percentage points to headline CPI. This is the 1970s replay.
Strong dollar (DXY above 103): A stronger dollar would provide a natural offset to oil and food price pressures by reducing import costs. This is the path that prevents the second wave.
Range-bound (DXY 93-103): The most likely near-term outcome. Oil and food supply shocks will transmit into CPI largely unimpeded by currency effects.
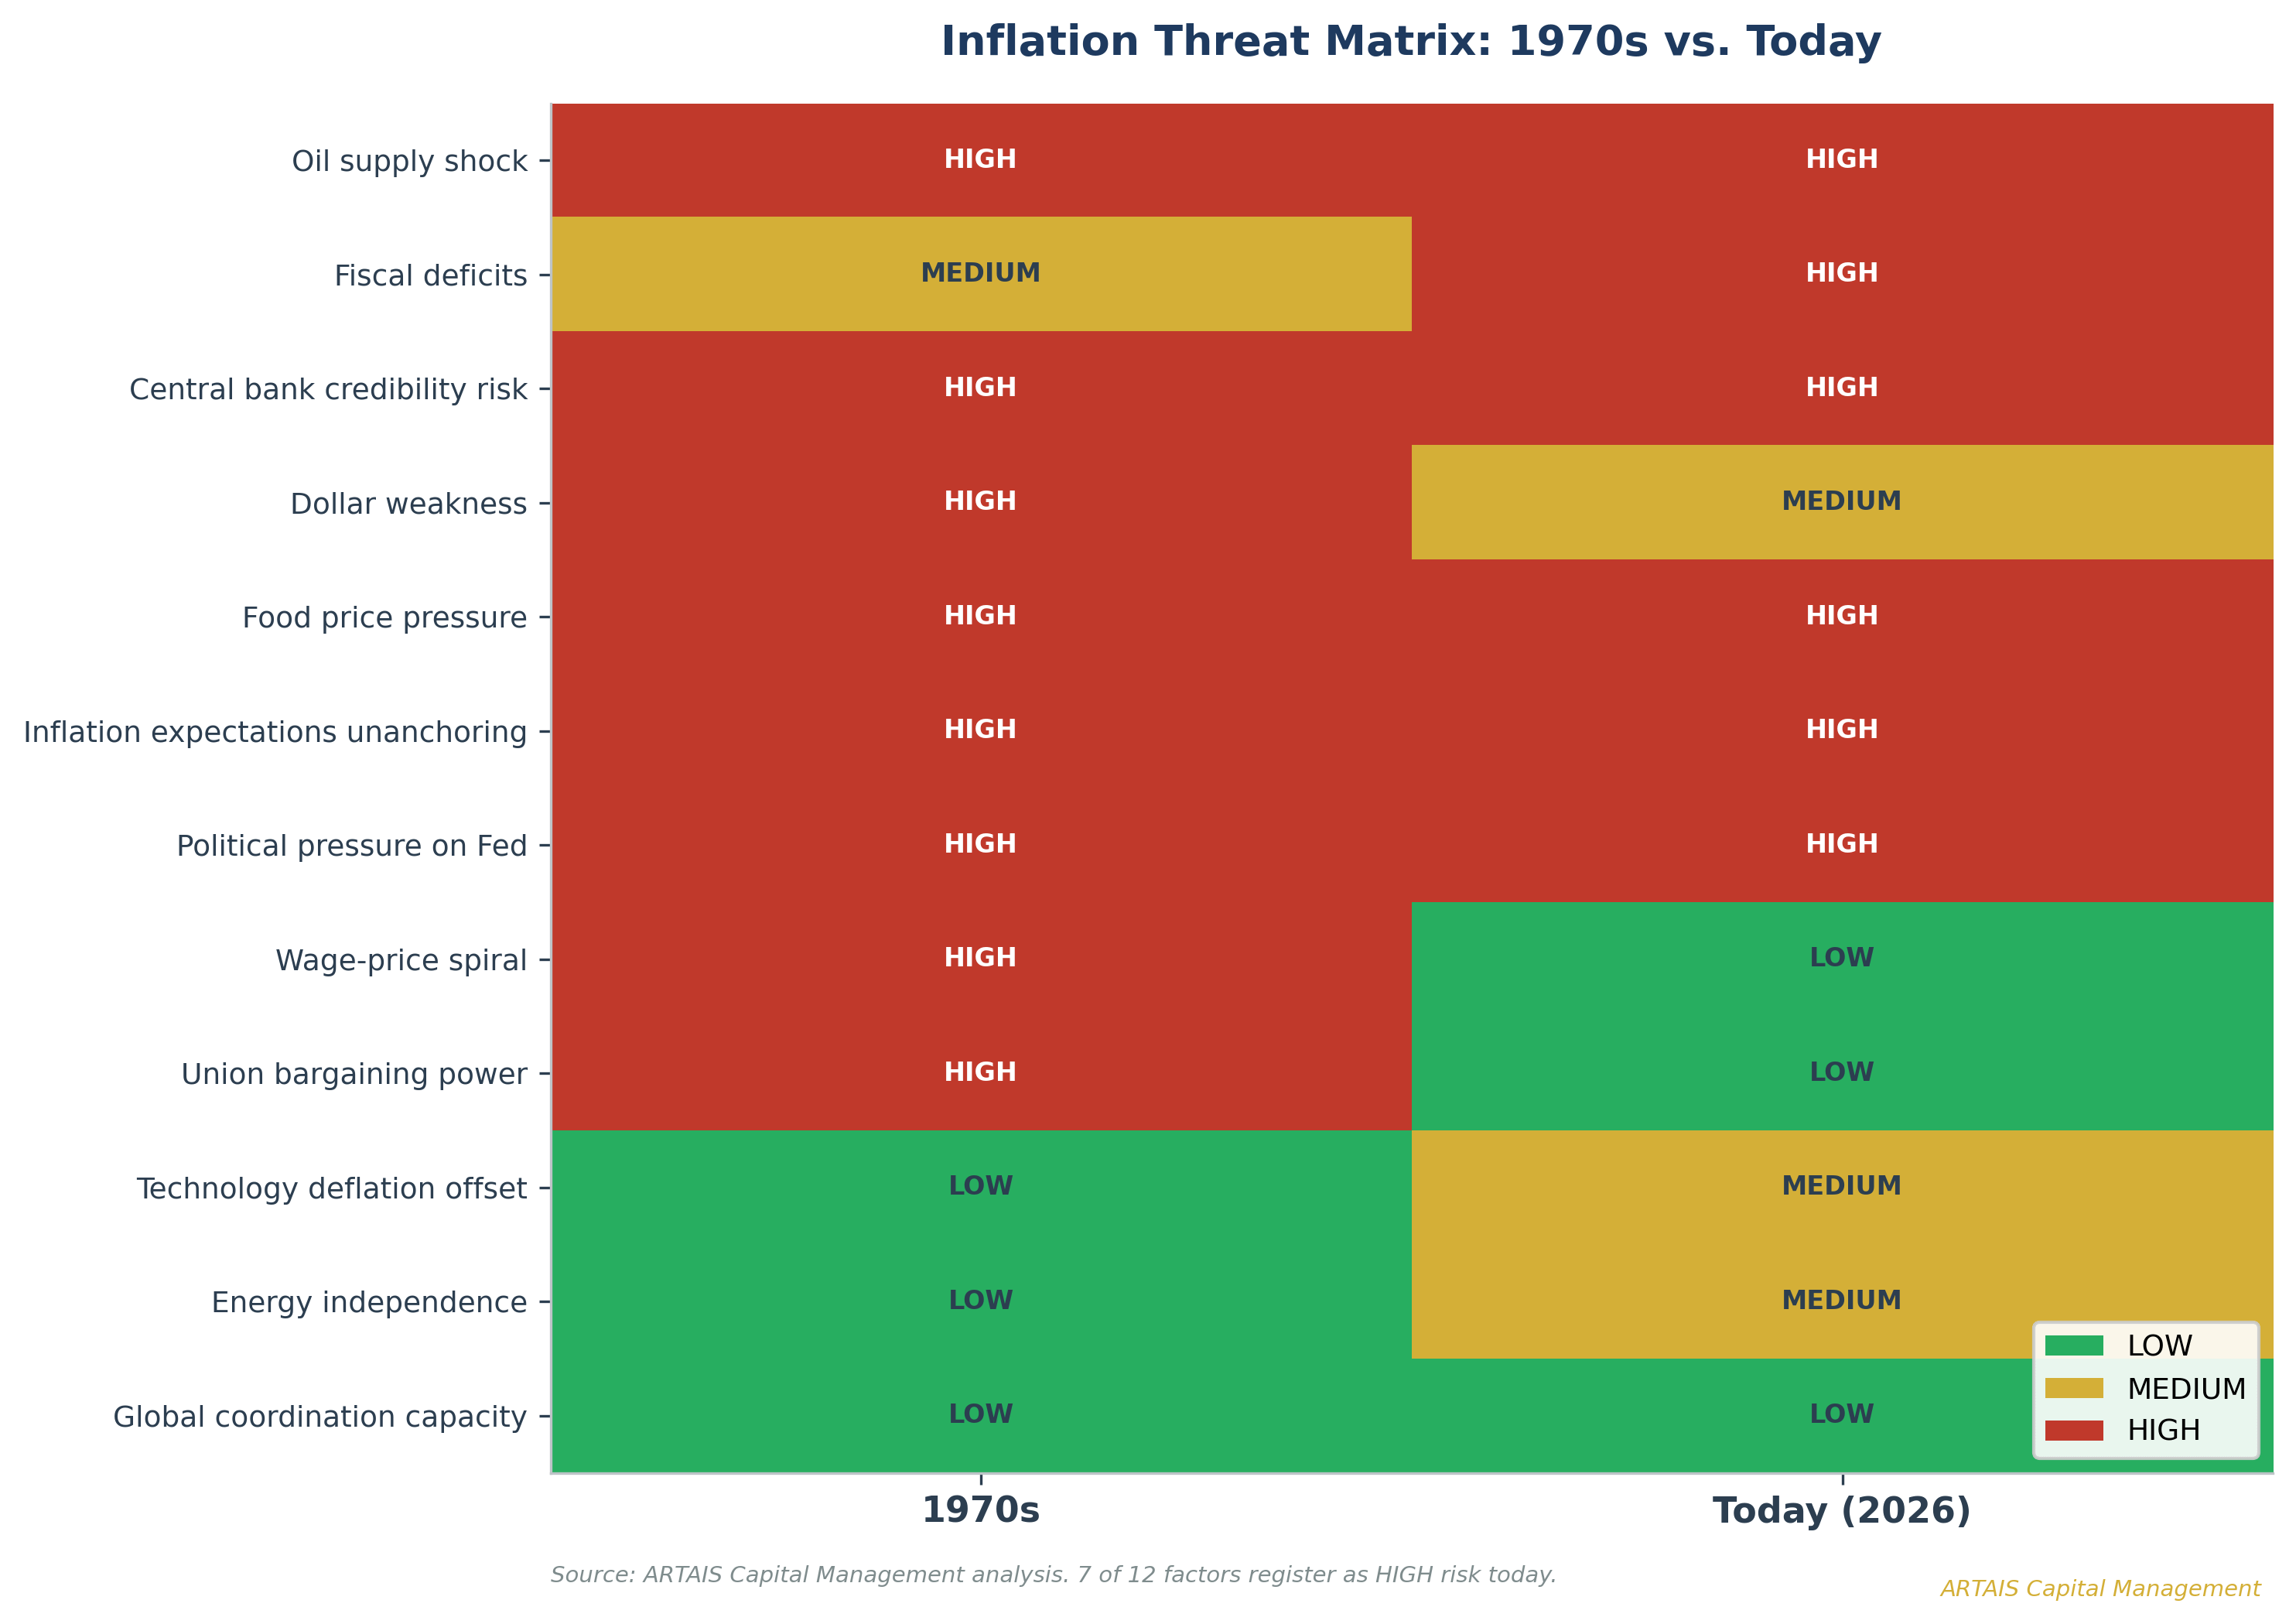
Part VI: Inflation Threat Matrix -- 1970s vs. Today
Here is a factor-by-factor comparison of where things stand:
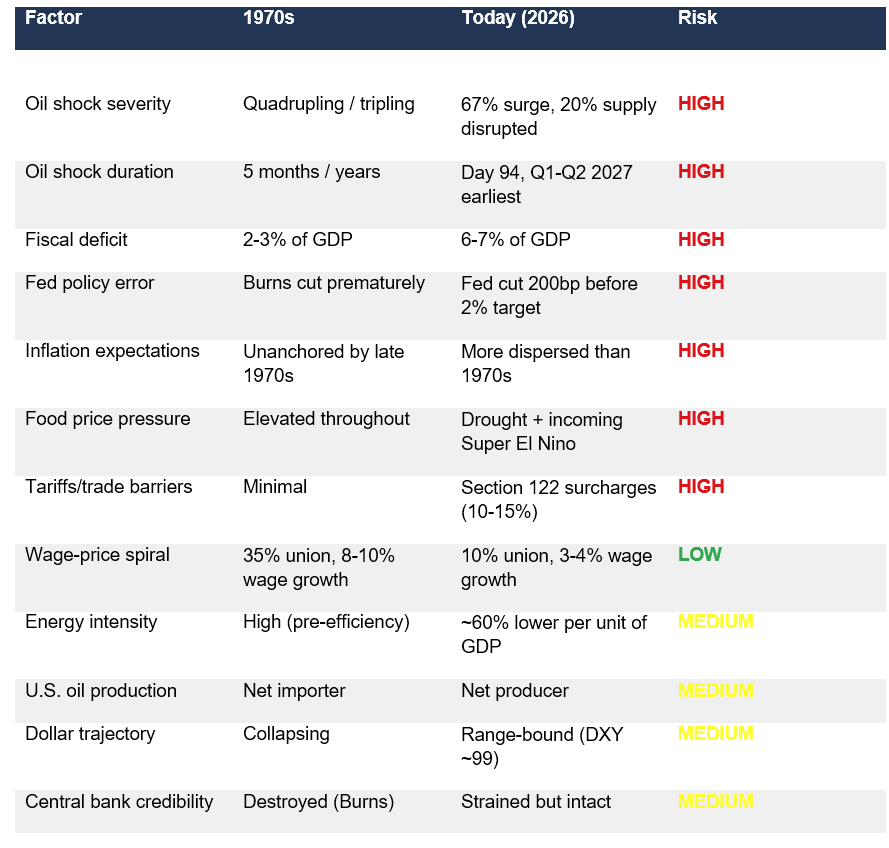
Seven of twelve factors register as HIGH risk. But the structural wage-price spiral mechanism is significantly weaker today.
This is the single most important difference and the primary reason a full 1970s-magnitude second wave is unlikely.
In my opinion, we are unlikely to see CPI reach 13.5% as it did in 1980. But a re-acceleration to 5-7% - a miniature second wave - is a genuine risk IF the oil shock persists, El Niño materializes as forecast, and the Fed remains on hold.
Part VII: How Likely is There to Be a Second Wave of Inflation?
Based on the data assembled here, I assess the probability distribution for U.S. CPI through the end of 2027:
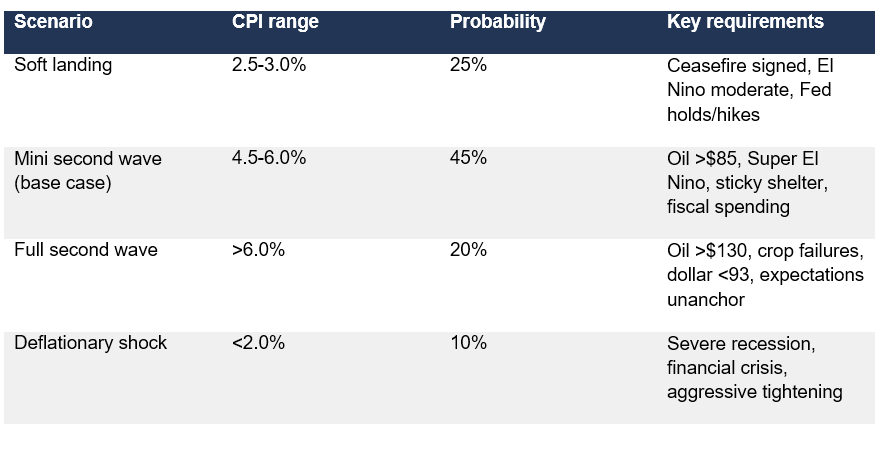
The weighted-average expected CPI for Q4 2027: approximately 4.5%. Not a repeat of 13.5%, but a definitive failure of the “soft landing” narrative.
I want to be clear about what this is and isn’t.
These are scenario-weighted probabilities based on my reading of the data. They are not calibrated forecasts from a formal model.
But the direction they point is uncomfortable: a roughly 65% probability of CPI exceeding 4.5% on a sustained basis, and a 20% probability of something considerably worse.
Part VIII: What Worked During the Second Wave -- And Will it Work Again?
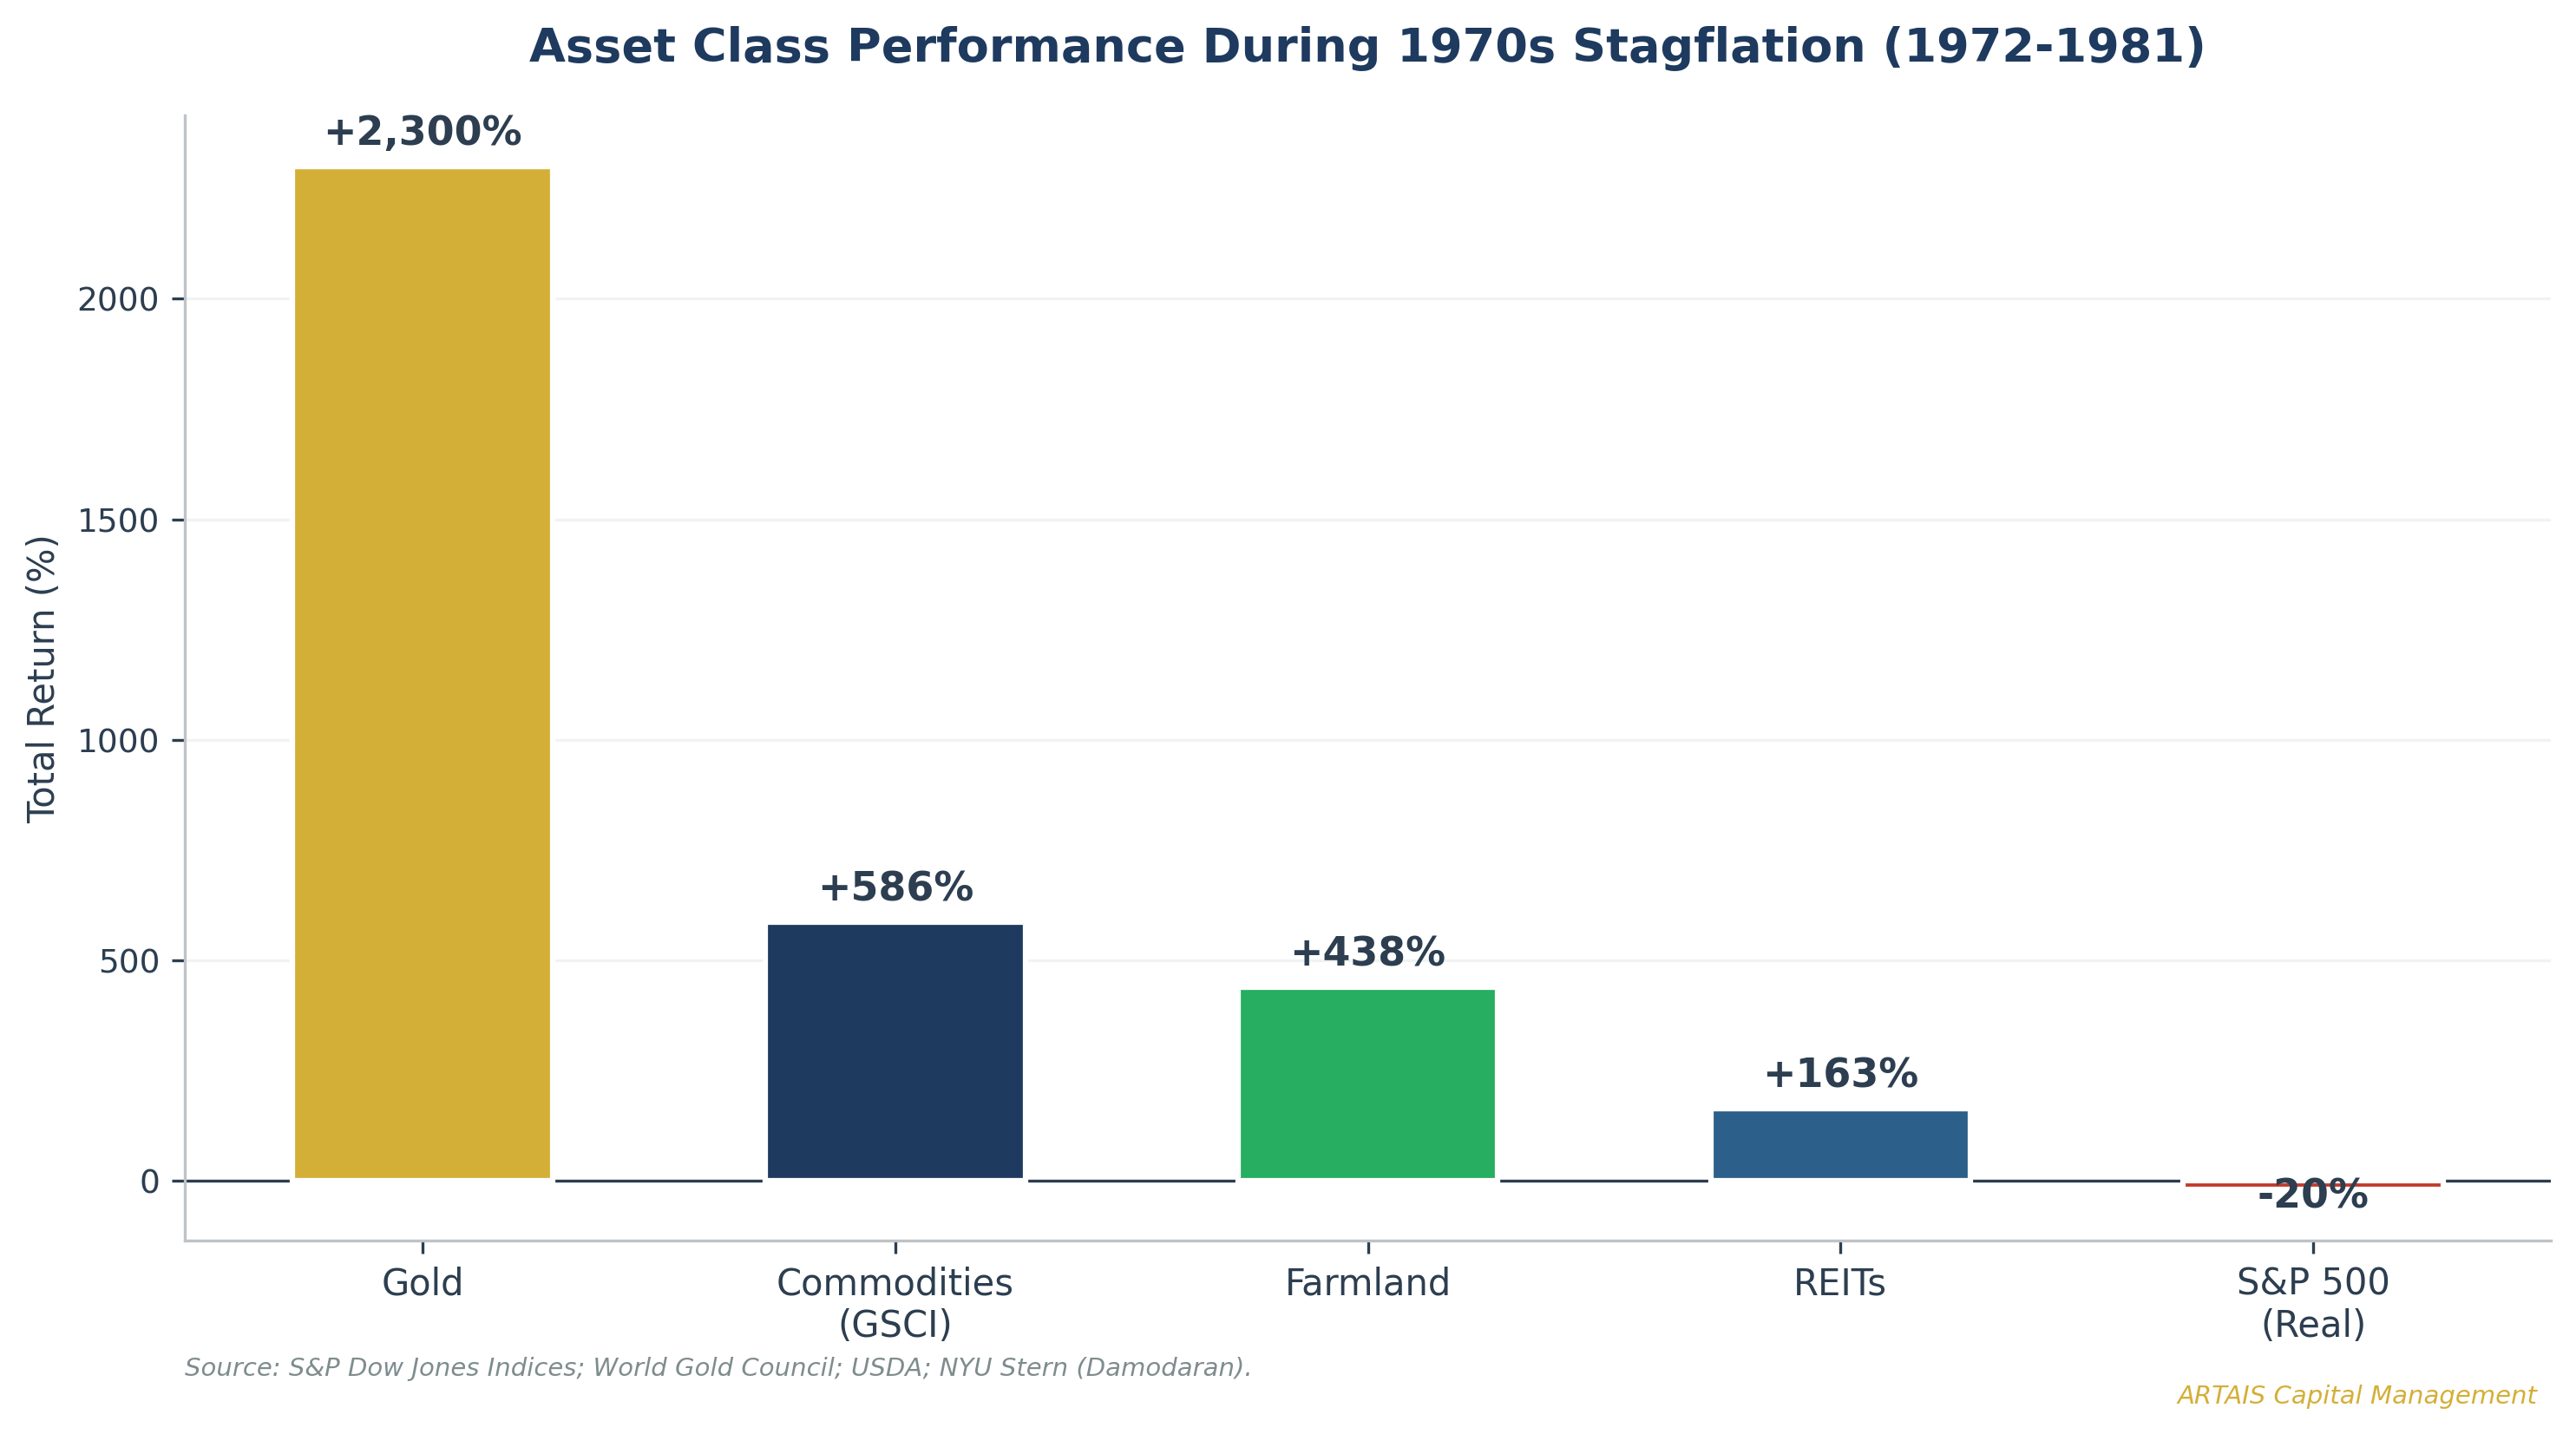
The 1970s:
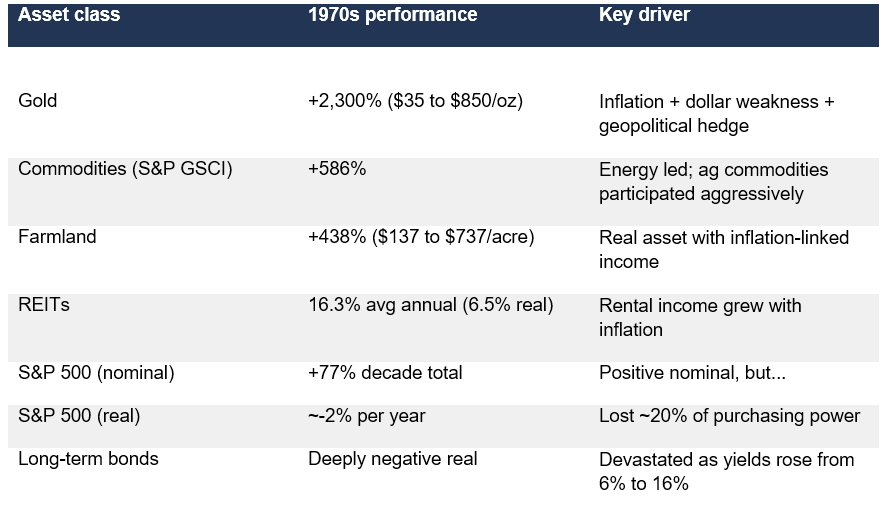
Will The Same Themes Work Today?
The short answer: partially, with important modifications.
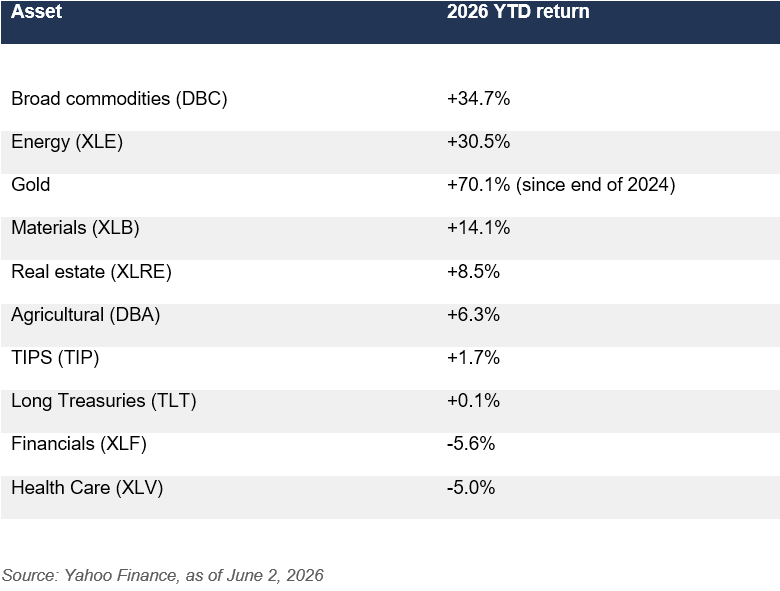
Gold has already moved. At $4,472 per ounce, gold has risen 70.1% since the end of 2024.
In a mini second wave (CPI 4.5-6%), gold may continue to appreciate, but the easy gains are behind us. In a full second wave (CPI 6%+), gold could reach $5,500-6,000.
Energy equities have already repriced. XLE is up 30.5% year-to-date and 40.8% since the end of 2024.
If oil remains above $85/barrel, energy stocks continue to generate outsized free cash flow. But if a ceasefire is signed and oil drops to $70, the trade reverses.
Commodities broadly remain attractive. DBC is up 34.7% year-to-date. Morgan Stanley’s 2026 outlook emphasizes that commodities provide diversification when stocks and bonds fall together during inflationary periods.
Agricultural commodities face a unique setup. If the Super El Niño materializes, agricultural commodities could see significant price spikes by Q1 2027. DBA, up 6.3% year-to-date, may be early in its move.
TIPS offer direct inflation protection that didn’t exist in the 1970s. In a re-acceleration scenario, TIPS outperform nominal Treasuries as the inflation adjustment compounds.
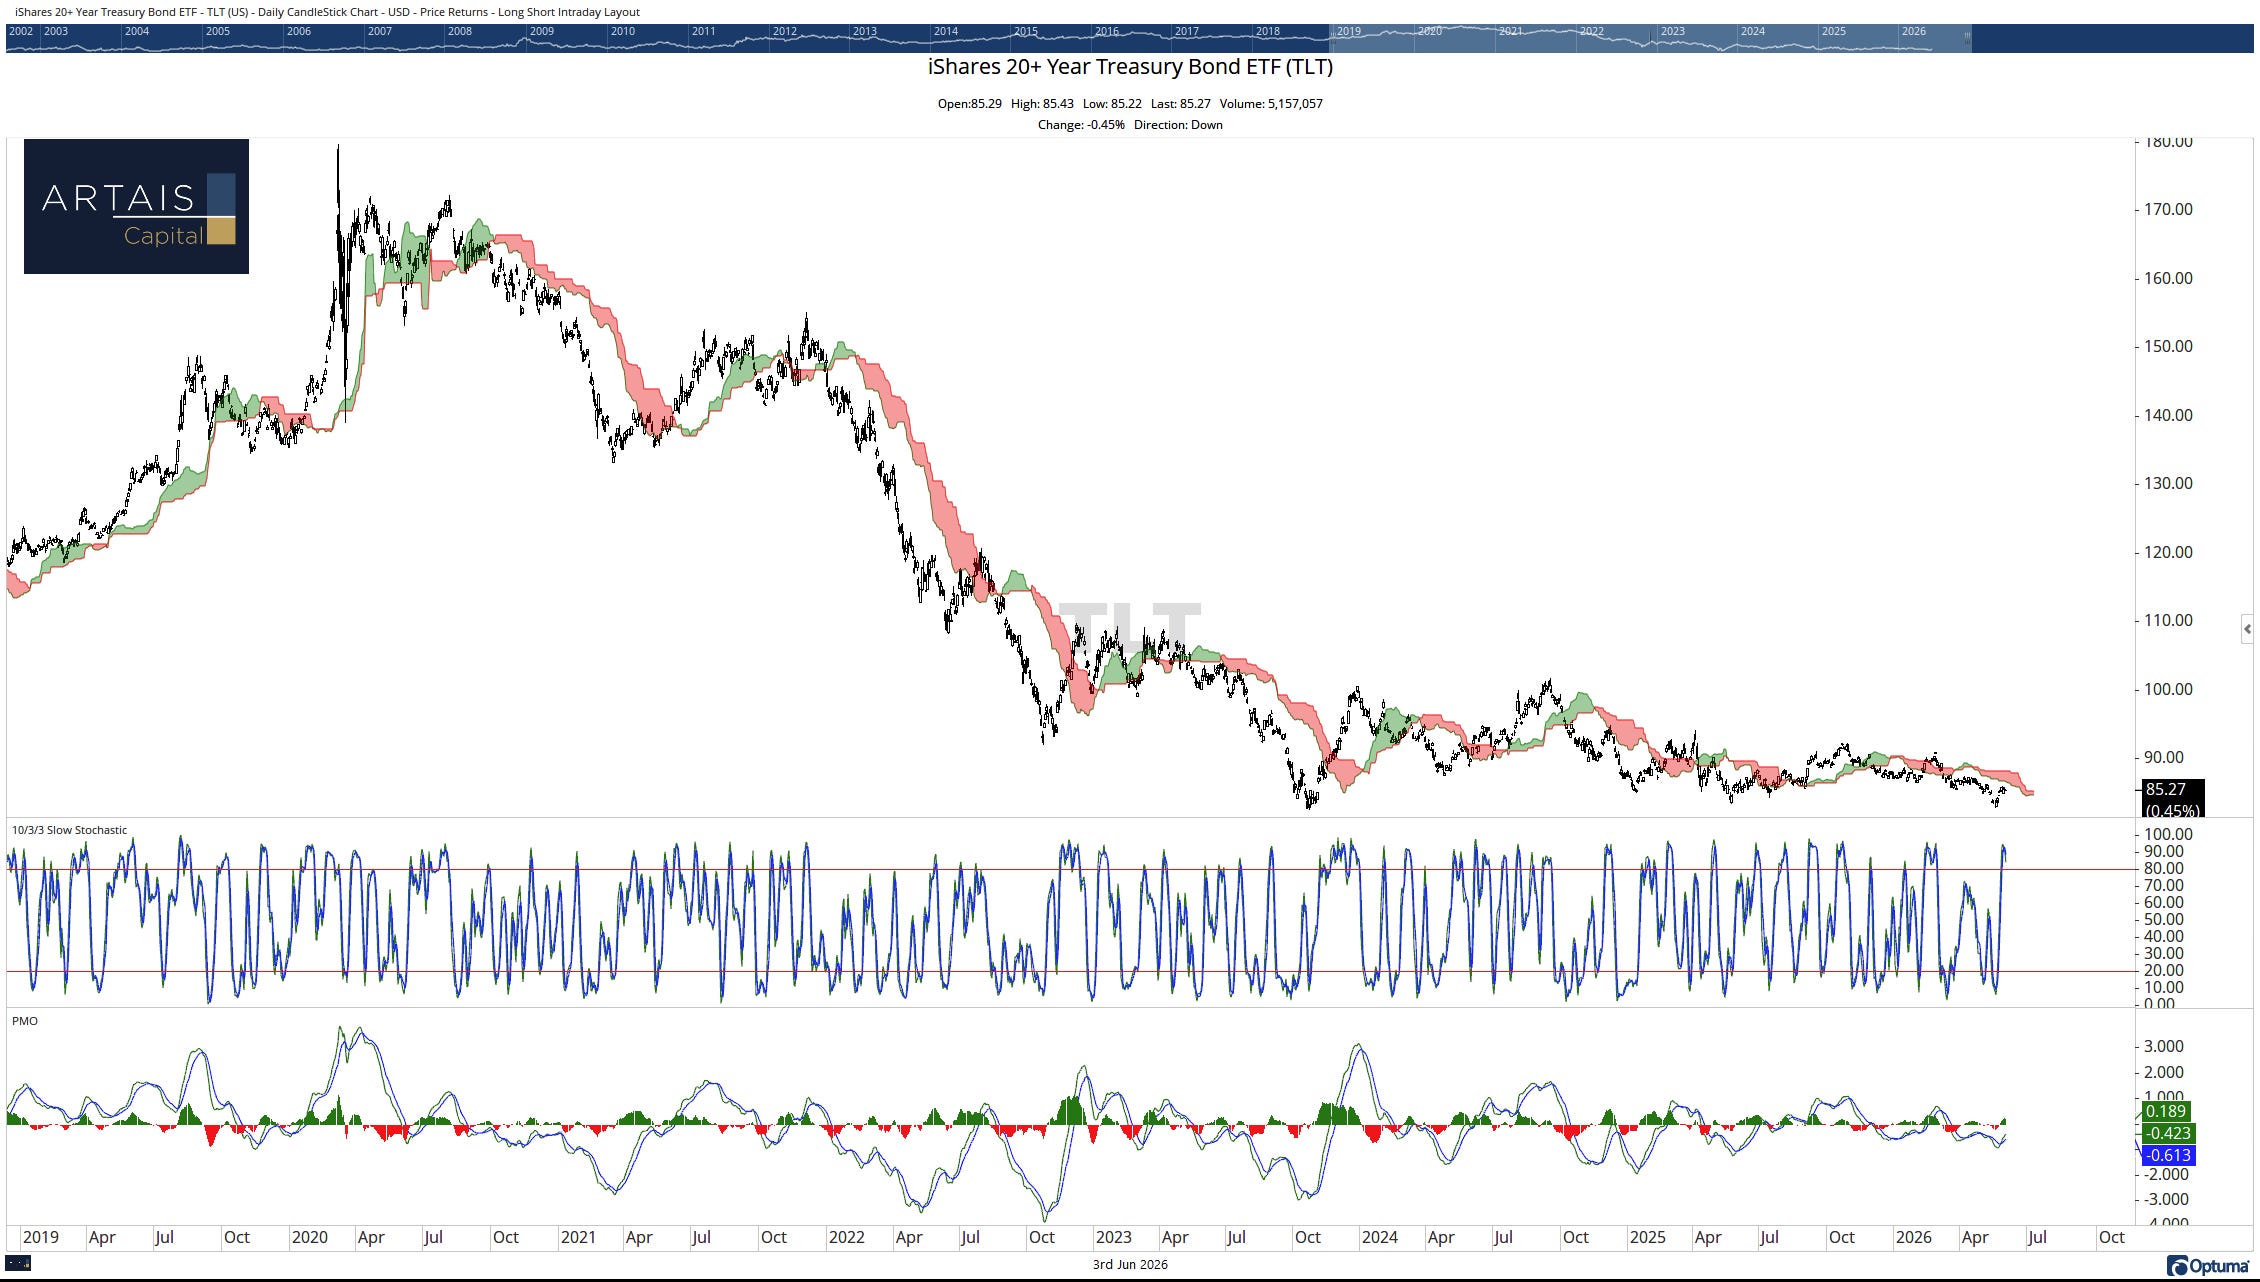
Long-duration Treasuries remain the asset class to avoid. TLT is essentially flat year-to-date. In any scenario where inflation re-accelerates, long-duration bonds lose value as yields rise.
Part IX: What Investors Should Watch
The next six months will determine whether this cycle rhymes with the 1970s or diverges. Here are the signals to monitor:
The May CPI report (June 10, 2026). If headline CPI exceeds 4.0%, the re-acceleration narrative gains significant momentum. If core CPI begins rising above 3.0%, the problem extends beyond energy.
Iran ceasefire status. The single most important variable for oil prices. Iran walked away from negotiations on June 1 -- not a good sign.
NOAA El Niño updates (monthly). A Niño 3.4 index crossing above +2.0°C confirms Super El Niño status and activates the food price channel.
University of Michigan inflation expectations. If the one-year-ahead expectation holds above 5% through summer 2026, the unanchoring becomes self-reinforcing.
Fed communication. Watch for language suggesting rate hikes are on the table. Kevin Warsh takes over with core PCE at 3.3% and rising.
DXY dollar index. A break below 95 would amplify imported inflation. A break above 103 would provide a natural offset.
Wage data. If average hourly earnings re-accelerate above 4.5%, the 1970s parallel strengthens significantly.
Credit spreads and private credit stress. Apollo and Ares have gated redemptions. If the oil shock tips overleveraged borrowers into default, this could force the Fed’s hand in either direction.
Skeptic’s Corner
I want to take the counterargument seriously, because getting this wrong in either direction has real consequences.
The wage mechanism is broken. Without 35% union membership and automatic cost-of-living adjustments, the wage-price spiral that sustained the 1970s second wave cannot operate the same way.
Wage growth at 3-4% is simply not the 8-10% that characterized the 1970s.
This is the most powerful structural argument against a full repeat.
Technology is deflationary. AI and automation are reducing costs in services, logistics, and manufacturing at a pace that has no 1970s equivalent.
The Fed would act. Unlike Burns, the current Fed has demonstrated willingness to inflict economic pain. If CPI re-accelerates above 5%, the Fed would likely hike.
Oil shocks are temporary. Every oil shock in modern history has eventually resolved. The U.S. is now a net energy producer, which partially offsets the Hormuz disruption.
The chart is a “chart crime”. The Summers overlay is a sample of one. The Cato Institute called it “uninformed madness” in 2023, noting that CPI methodology changed substantially between the two periods.
These are legitimate arguments. The second wave is not a certainty. For now it is a risk to be aware of.
Conclusion: Positioning for the Range of Outcomes
The data assembled here does not prove that a second wave is coming.
What it proves is that the conditions that preceded the second wave in the 1970s are present in sufficient quantity to take the risk seriously.
CPI is at 3.8% and re-accelerating. An active oil supply shock with the Strait of Hormuz still partially obstructed on Day 94. A Super El Niño developing with higher than average probability of reaching strong or very strong intensity.
Consumer inflation expectations more unanchored than the 1970s by the Cleveland Fed’s dispersion measure. A Fed that has already eased 200 basis points before reaching its inflation target. And fiscal deficits running at double the 1970s levels.
The 1970s lesson is that the second wave did not arrive because anyone expected it. It arrived because policymakers and markets assumed the first wave was a one-time event, declared victory prematurely, and then were overwhelmed when the next shock hit before the structural vulnerabilities had been addressed.
I am not predicting a repeat of 1980. I am observing that the setup for a re-acceleration is in place, the catalysts are identifiable, and the market is not priced for it. The May CPI report on June 10 will provide the next major data point.
Investors who positioned for inflation in the 1970s -- gold, commodities, energy, real assets -- dramatically outperformed those who assumed the storm had passed.
Those themes are already showing signs of working again in 2026, with energy up 30.5%, broad commodities up 34.7%, and gold up 70% since the end of 2024.
The question is whether to add to these positions or reduce them. That depends on the ceasefire, the El Niño, and the next CPI print. I will be closely watching all three.