
Inflation Just Got Much Worse
Here's what it means for your money and portfolio

The inflation numbers that came out yesterday and today should have your full attention.
Consumer prices rose 3.8% over the past year — nearly double the Fed’s 2% target.
Producer prices, which measure what businesses pay before those costs reach you, jumped 6.0% year-over-year, the largest increase since December 2022.
This is the biggest monthly PPI gain since March 2022.
I want to walk through what’s actually happening, why it matters for your portfolio, and where I see both risk and opportunity from here.
What The Latest Inflation Numbers Actually Mean
Two reports matter here: the Consumer Price Index (CPI) and the Producer Price Index (PPI).
CPI measures items like what you pay at the store, at the pump, and at the airport. April’s CPI came in at 3.8% year-over-year, up from 3.3% in March. That number is moving in the wrong direction.
PPI measures what businesses pay for raw materials, shipping, and energy. April’s PPI hit 6.0% year-over-year, with a 1.4% jump in a single month.
The PPI number matters because when producers’ costs rise, those costs are passed down to consumers. When PPI is rising faster than CPI, it usually means more inflation is on the way, not less.
Core CPI — which strips out food and energy — still came in at 2.8%. So the underlying trend is still unfavorable, even when the rise in oil prices is excluded.
source: ARTAIS Capital, Bureau of Labor Statistics
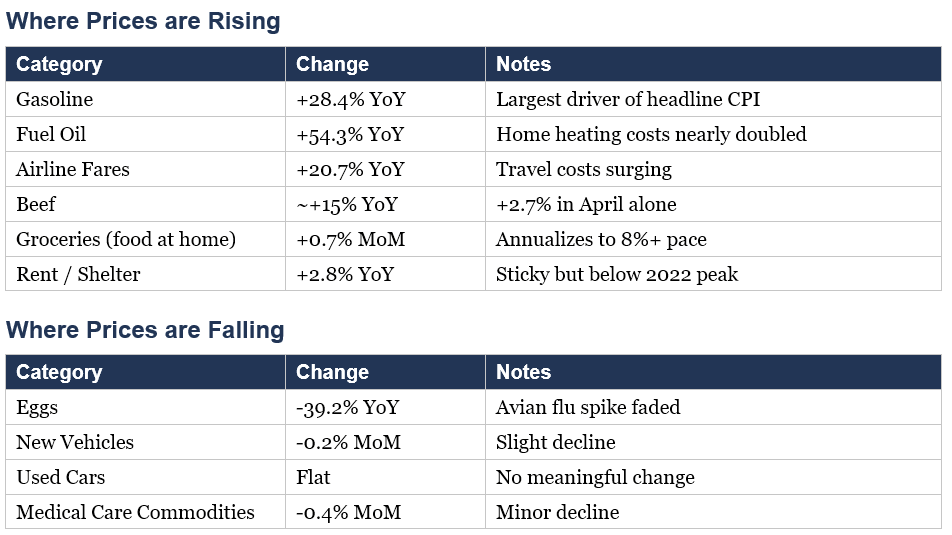
What Is Causing Inflation To Rise?
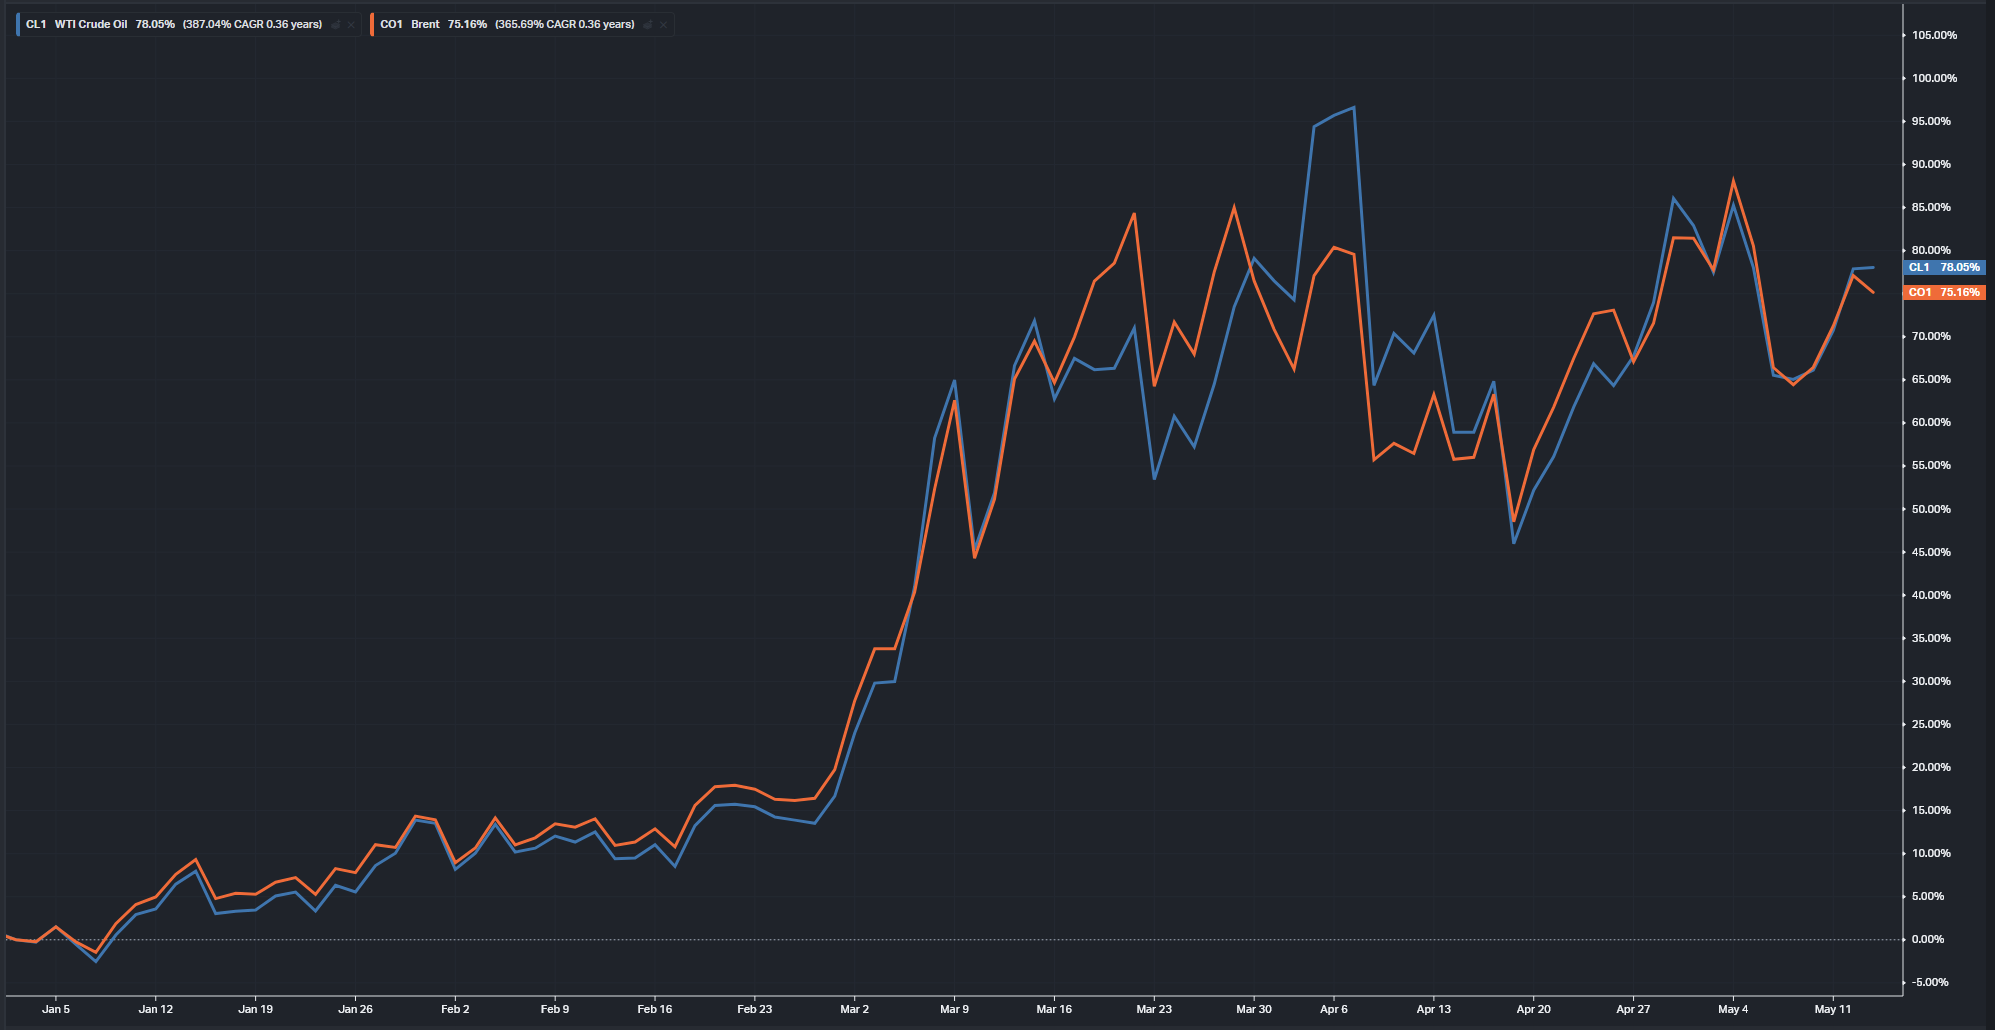
Oil Prices have risen about 75% since the start of the year
1. The Iran war and oil. Since the Strait of Hormuz disruption began on February 28, crude oil prices have risen roughly 45%. Brent crude is around $108, WTI around $102. The Strait carries about 27% of the world’s maritime crude trade. Energy accounted for more than 40% of April’s headline CPI increase.
2. Food costs are climbing. Grocery prices are being pushed higher by energy costs, global supply disruptions, and rising input costs. The IMF forecasts global food prices will rise about 6% in 2026.
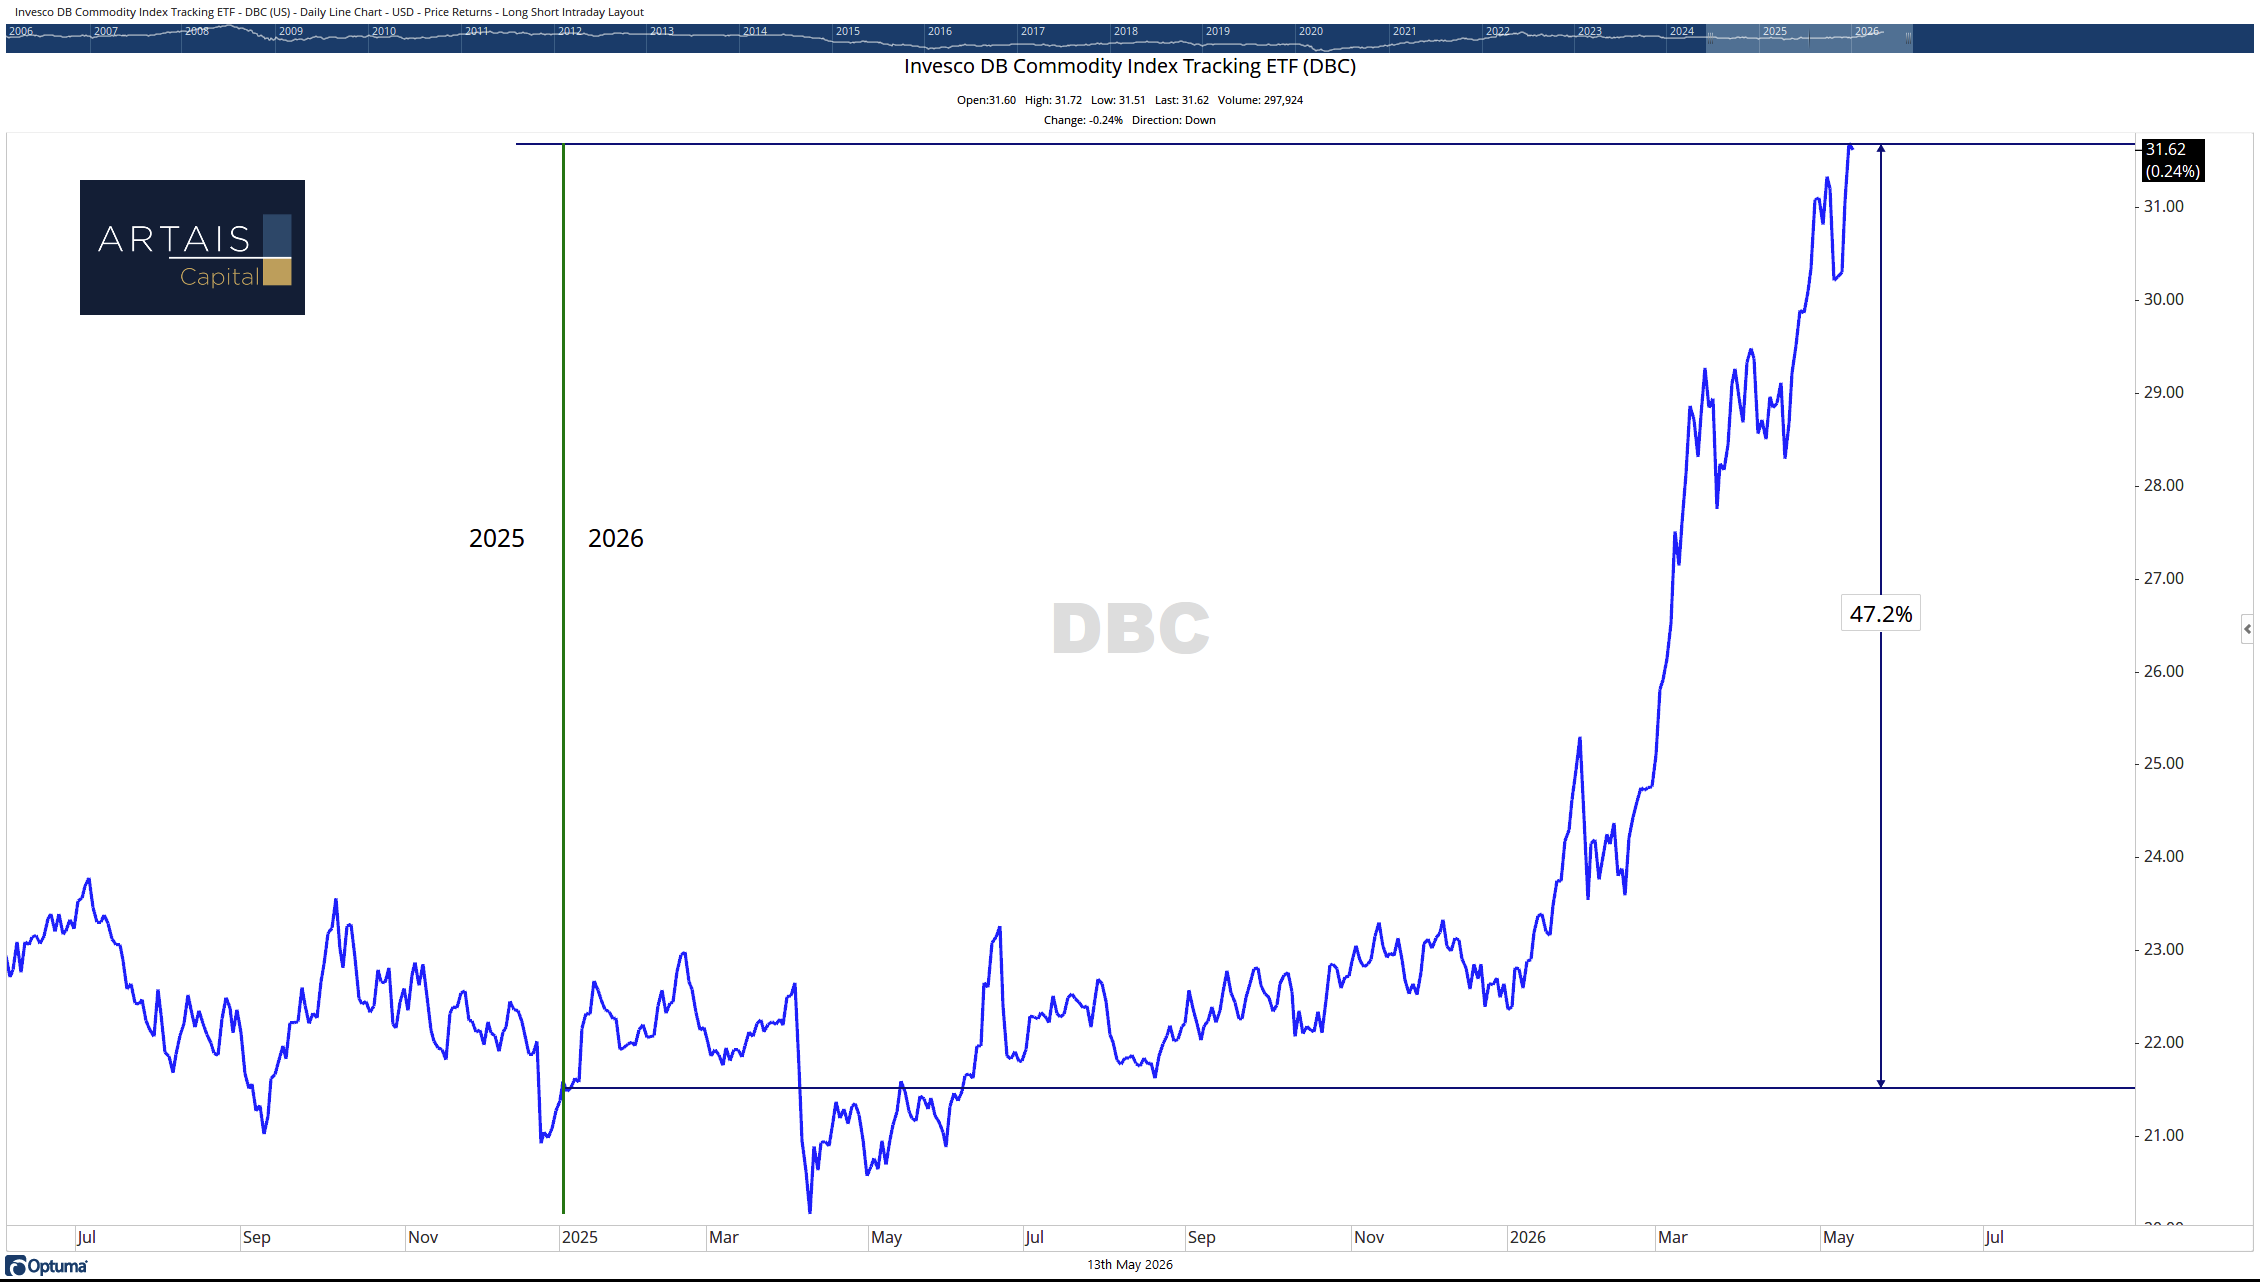
The rise in commodity prices (“DBC”) year to date
3. Tariffs. The 10% global import duty under Section 122 is raising costs across supply chains. Most businesses are passing those costs on to consumers.
4. Shelter stays sticky. Rent and housing costs continue their slow climb. Unlike energy, shelter inflation doesn’t spike and crash — it slowly grinds higher and takes years to moderate.
Your Paycheck Isn’t Keeping Up
For about two years, from mid-2023 through early 2026, wages were actually growing faster than inflation. Workers were gaining real purchasing power.
Unfortunately for consumers, that trend has reversed.
Real average hourly earnings (your wages after adjusting for inflation) fell 0.2% over the past year. In April alone, they dropped 0.5%.
Your paycheck might be bigger in nominal dollars, but it buys less than it did a year ago.
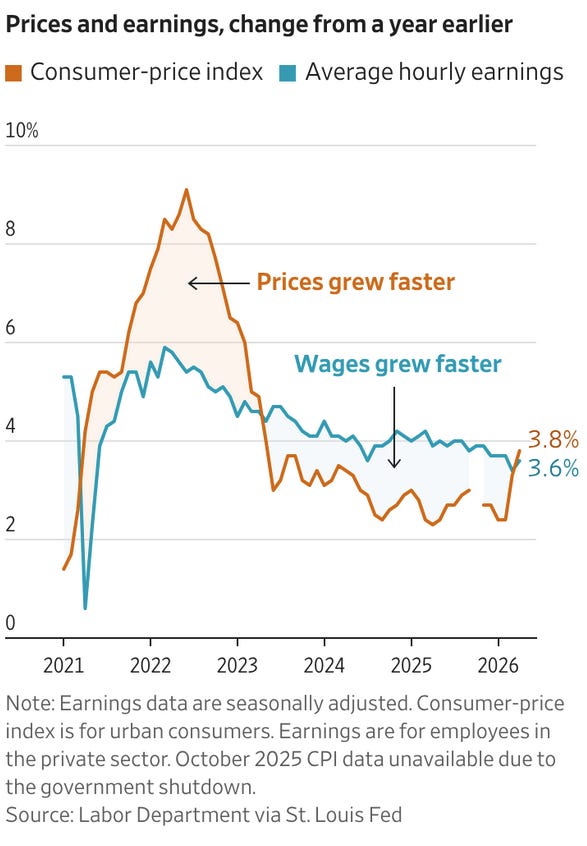
source: WSJ
Over the full post-pandemic period since January 2021, real hourly earnings are still down 0.7%. Five years later, workers have less purchasing power than when the pandemic started.
Lower-income households are hit hardest because they spend the highest share of their income on food and energy — the two categories rising fastest.
What This Means For Bonds
A quick explanation for readers not familiar with bonds:
Bonds pay you a fixed amount of interest. When inflation rises, that fixed payment buys less, so investors demand higher yields on new bonds. When yields go up, existing bond prices go down.
For example: if you invest in a 3% CD and rates suddenly go to 5%, nobody wants your 3% CD unless they can buy it at a discount. That’s what’s happening across the bond market right now, and why your bond fund is probably going down as interest rates rise.
What does this mean to the average investor who is allocated to a bond mutual fund?
After COVID, inflation rose aggressively:
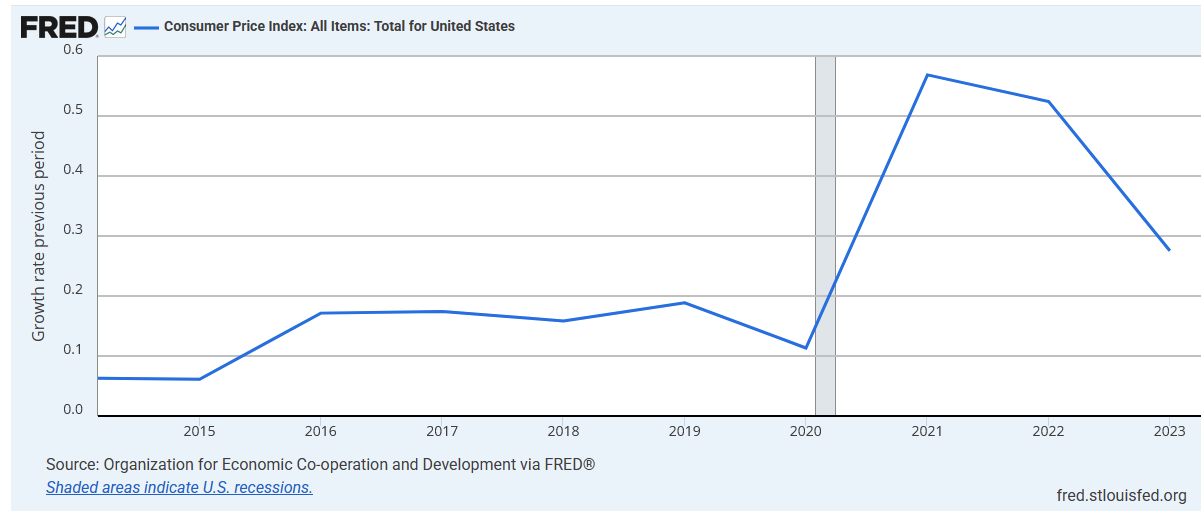
As inflation rose and the Fed raised rates to combat it, one of the largest bond fund in the world, the Vanguard Total Bond Market Index (VBMFX), fell approximately 24%:
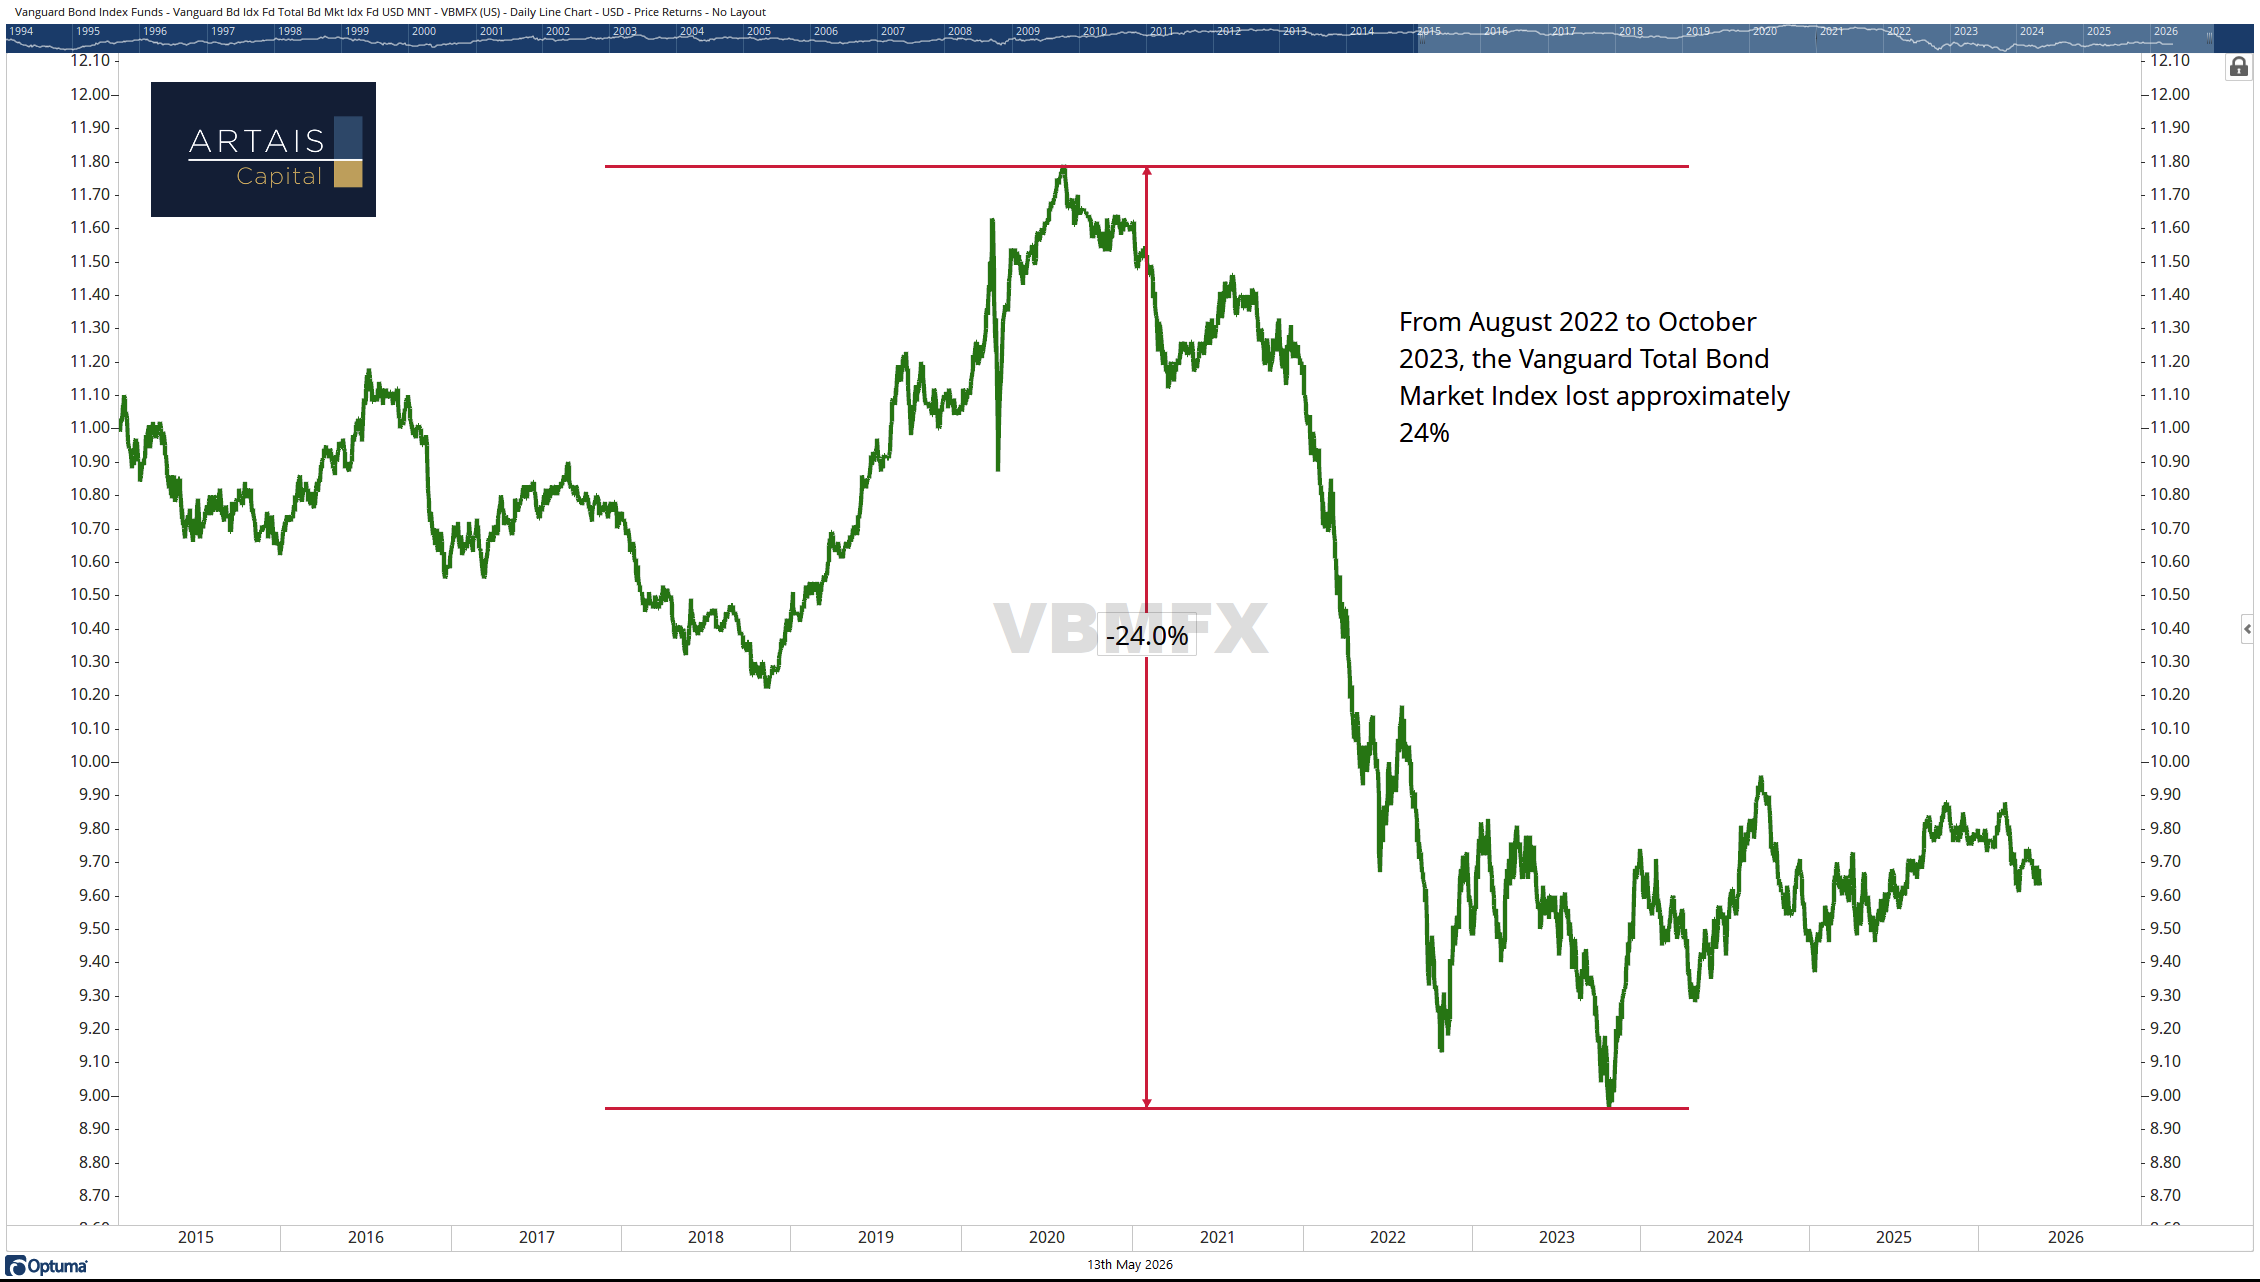
Rising rates can cause large losses to bond fund investors
What This Means For Stocks From A Historical Perspective
The stock market has been surprisingly resilient, with the S&P 500 up roughly 8% year-to-date despite all these headwinds. But under the surface, the winners and losers are sharply divided:
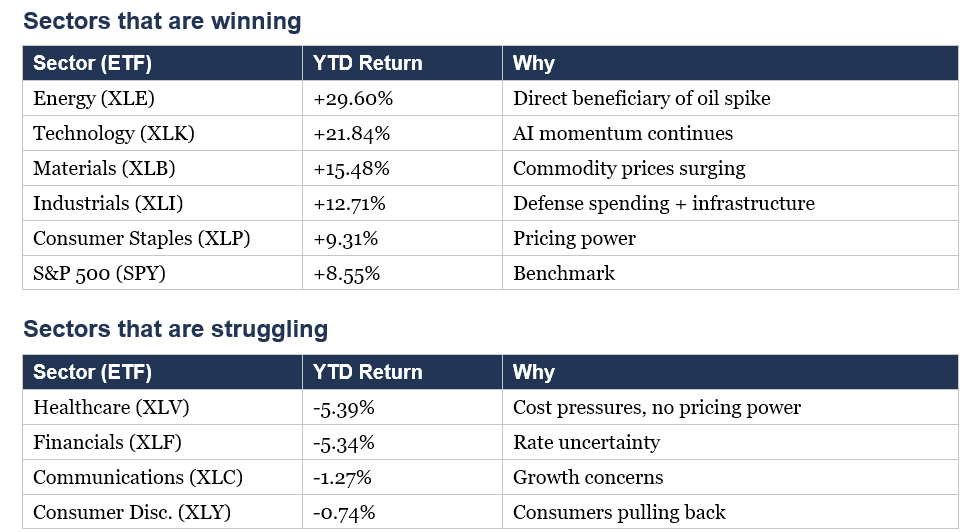
*as of 5/12/26
To help guide us as investors, taking a look back at previous inflation spikes can provide us with some insights into how markets reacted.
The 1970s oil shock: An energy crisis driven by geopolitical conflict. Value stocks returned about 12% annually while growth stocks managed just 4.1%. Commodities dominated.
The 2022 inflation spike: When CPI hit 9%, the S&P 500 fell 18%, almost entirely from P/E compression. Energy was the standout winner.
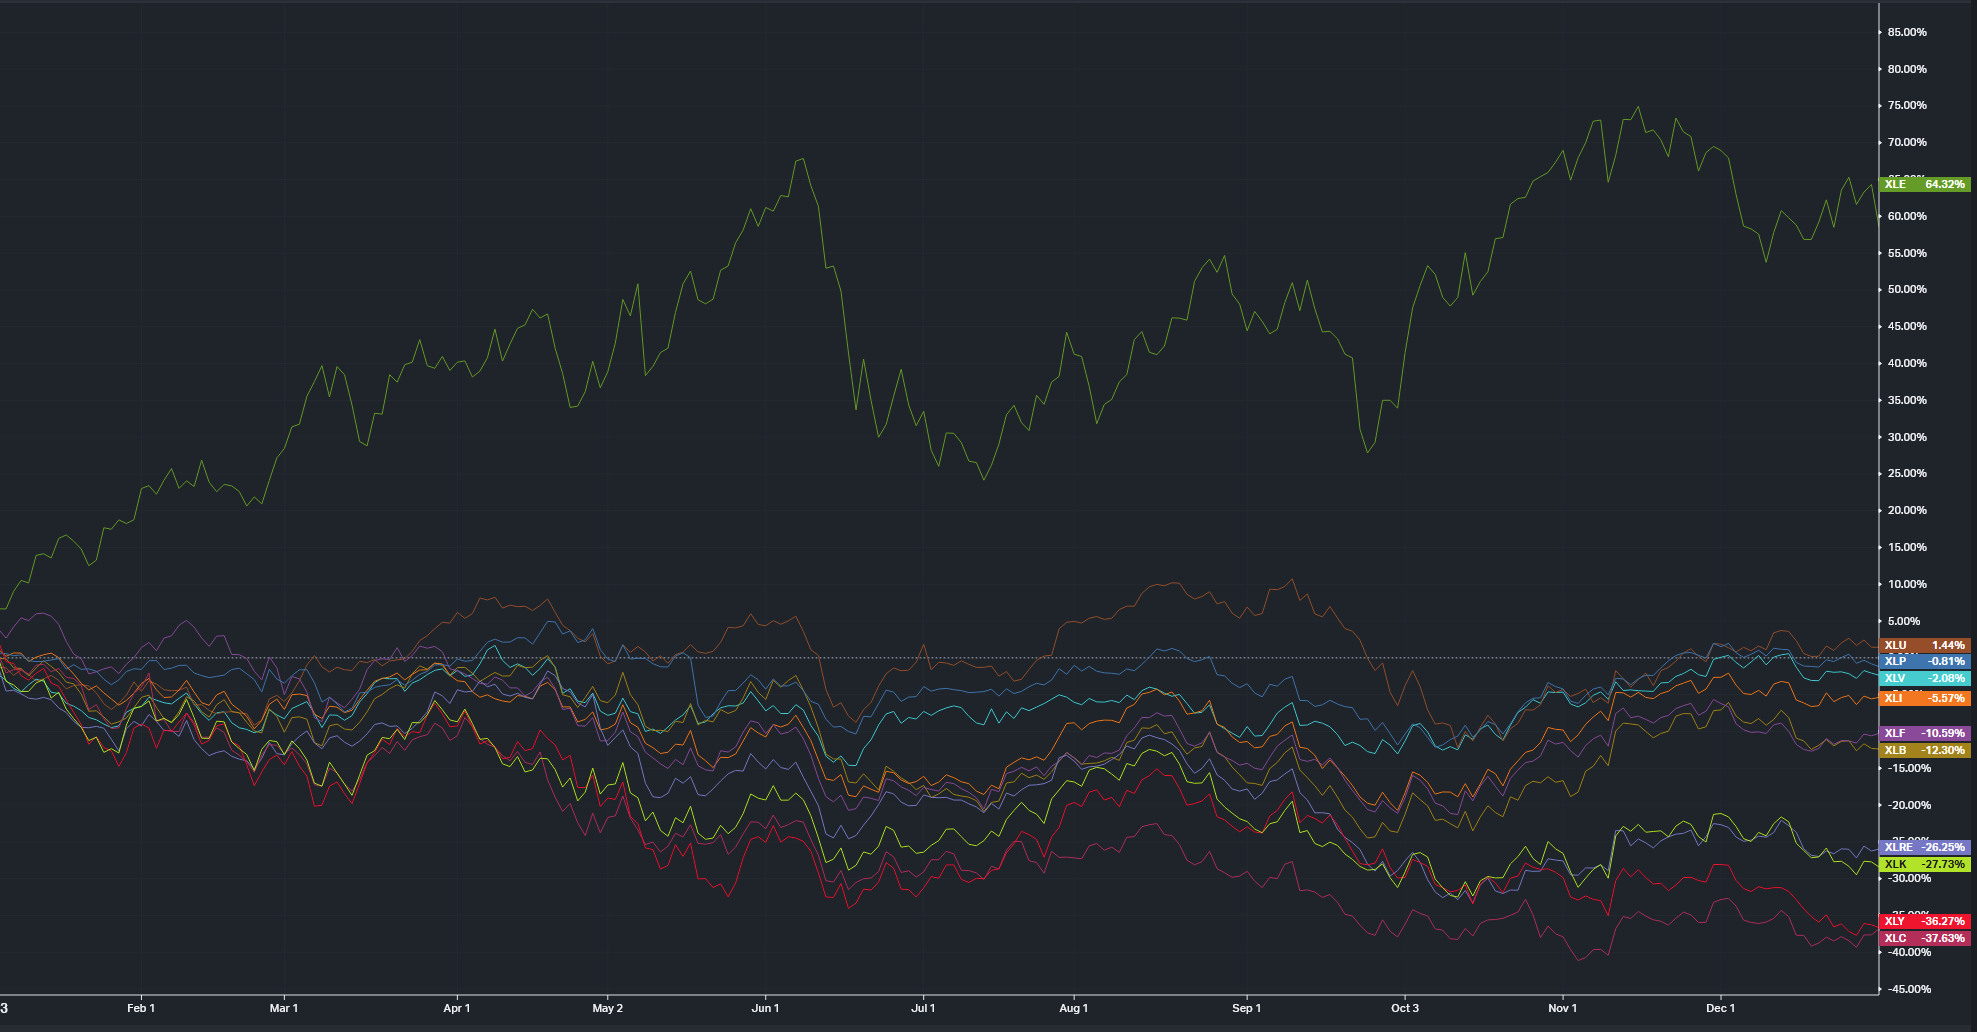
Sector Performance During 2022
The parallel to today: We have an energy shock, rising food prices, tariffs, and a Fed leadership transition — all at once. We are seeing similar trends emerge as we have in the past.
The New Fed Chair: Kevin Warsh
Kevin Warsh was confirmed by the Senate and will take over as the new Fed Chair, replacing Jerome Powell.
End forward guidance. Under outgoing Fed Chair Powell, the Fed would essentially tell you what it planned to do.
Warsh wants to stop telegraphing rate decisions. Markets will have to react to actual decisions rather than guided expectations. Expect more volatility around future Fed meetings.
Redefine how inflation is measured. Warsh wants to move toward an inflation “range” rather than a hard 2% target. Again, markets have grown to expect transparency from the Fed. Warsh seems to want to lessen the transparency the Fed has provided to the market.
Use AI as cover for cuts. Warsh has called AI a “significant disinflationary force.” If he believes AI will push prices down over time, he can argue that rate cuts are appropriate even with above-target inflation today.
His first FOMC meeting is June 16-17. The real signal will be how Warsh communicates — or doesn’t.
What I Am Watching
Positive catalysts
Iran ceasefire: Oil could fall 30-40% if the Strait reopens. However, Saudi Aramco's CEO Amin Nasser warned that if the Strait stays blocked beyond mid-June, market normalization could slip into 2027.
As of 5/13/26, the Strait of Hormuz is seeing little movement
Warsh rate cut: If the new Fed chair redefines inflation targets and cuts, equities would rally.
Tariff rollback: Section 122 tariffs are legally limited to 150 days. Could expire as early as July. (U.S. Court of International Trade ruled Section 122 tariffs unlawful in a 2-1 decision on May 7, 2026. The Trump administration appealed on May 8.)
Earnings resilience: S&P 500 up 8.55% YTD despite war, inflation, and tariffs.
Negative catalysts
Ceasefire collapse: Earlier this week, Trump rejected Iran’s latest counteroffer as “garbage”.
According to the International Food Policy Research Institute, …“in 2024, up to 30% of global fertilizer trade passed through the Strait of Hormuz from the Persian Gulf to export markets around the world, as well as an estimated 20% of liquefied natural gas (LNG), a key fertilizer feedstock, and 27% of globally traded oil.”
If the conflict escalates, oil, natural gas, and food costs will go higher.
Inflation acceleration: If May CPI (June 10 release) shows further acceleration, rate cut hopes are dead.
Futures markets are already pricing in 30% chance of a rate hike by the end of the year.
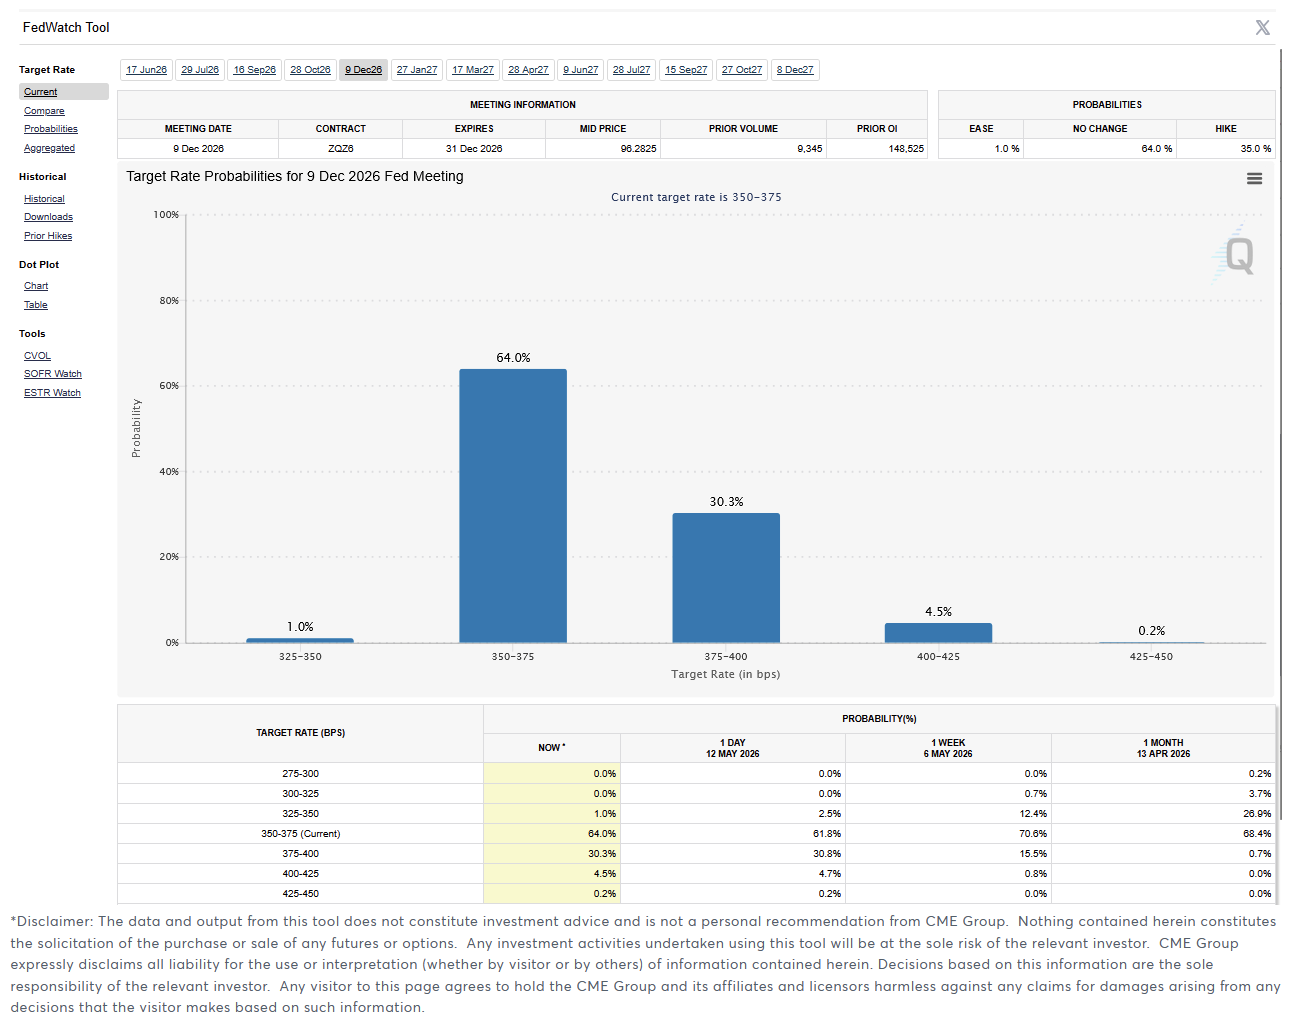
This is a dramatic change from a month ago, when the market was pricing in a 26.9% chance of a rate cut.
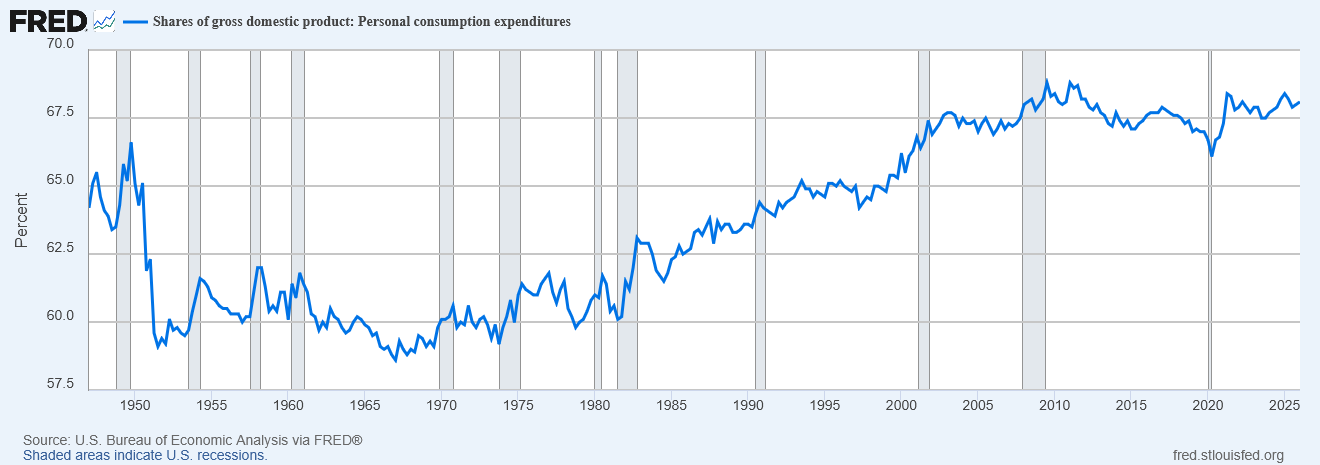
Consumer spending cracking: Real wages declining plus savings depletion is the formula for demand destruction.
This could have a real impact on the US economy, as nearly 70% of GDP is from consumer spending:
30-year yield above 5%: If it keeps climbing, we could see P/E compression. This is what we saw in 2022 as the 30-year Treasury yield climbed above 5%.
Investors could suddenly earn a safe, guaranteed return from bonds that beats what many stocks are providing. As a result, money starts leaving stocks and moving into bonds.
That selling pressure forces stock prices down until the "earnings yield" on stocks (the flip side of the P/E ratio) becomes attractive again compared to bonds.
In short, high bond yields make stocks look expensive; therefore, expensive stocks have to get cheaper to re-attract investors.
The Bottom Line
Inflation is running nearly double the Fed’s target, producer prices are rising even faster, and real wages are declining. That’s the reality right now.
This is a moment to review your allocations, not to panic. The investors who did best during the 1970s and 2022 weren’t the ones who moved to cash — they were the ones who shifted toward sectors and strategies that perform in inflationary environments.
Stay systematic. Adapt when the data changes. Don’t let the headlines make your decisions.