
Is the Market Starting to Look Past Iran?

The headlines change daily.
One morning, Trump signals a diplomatic breakthrough with Iran. The next, he threatens to escalate.
Tariffs are on, then off, then modified. Ceasefire terms are announced, then walked back, then quietly renegotiated.

Washington is running on improvisation. And yet — the stock market has largely stopped reacting.
Are Investors Starting to Look Past Iran?
Bloomberg ran a headline this morning: “Stock Investors Look Past Iran War Despite Shaky Ceasefire.”
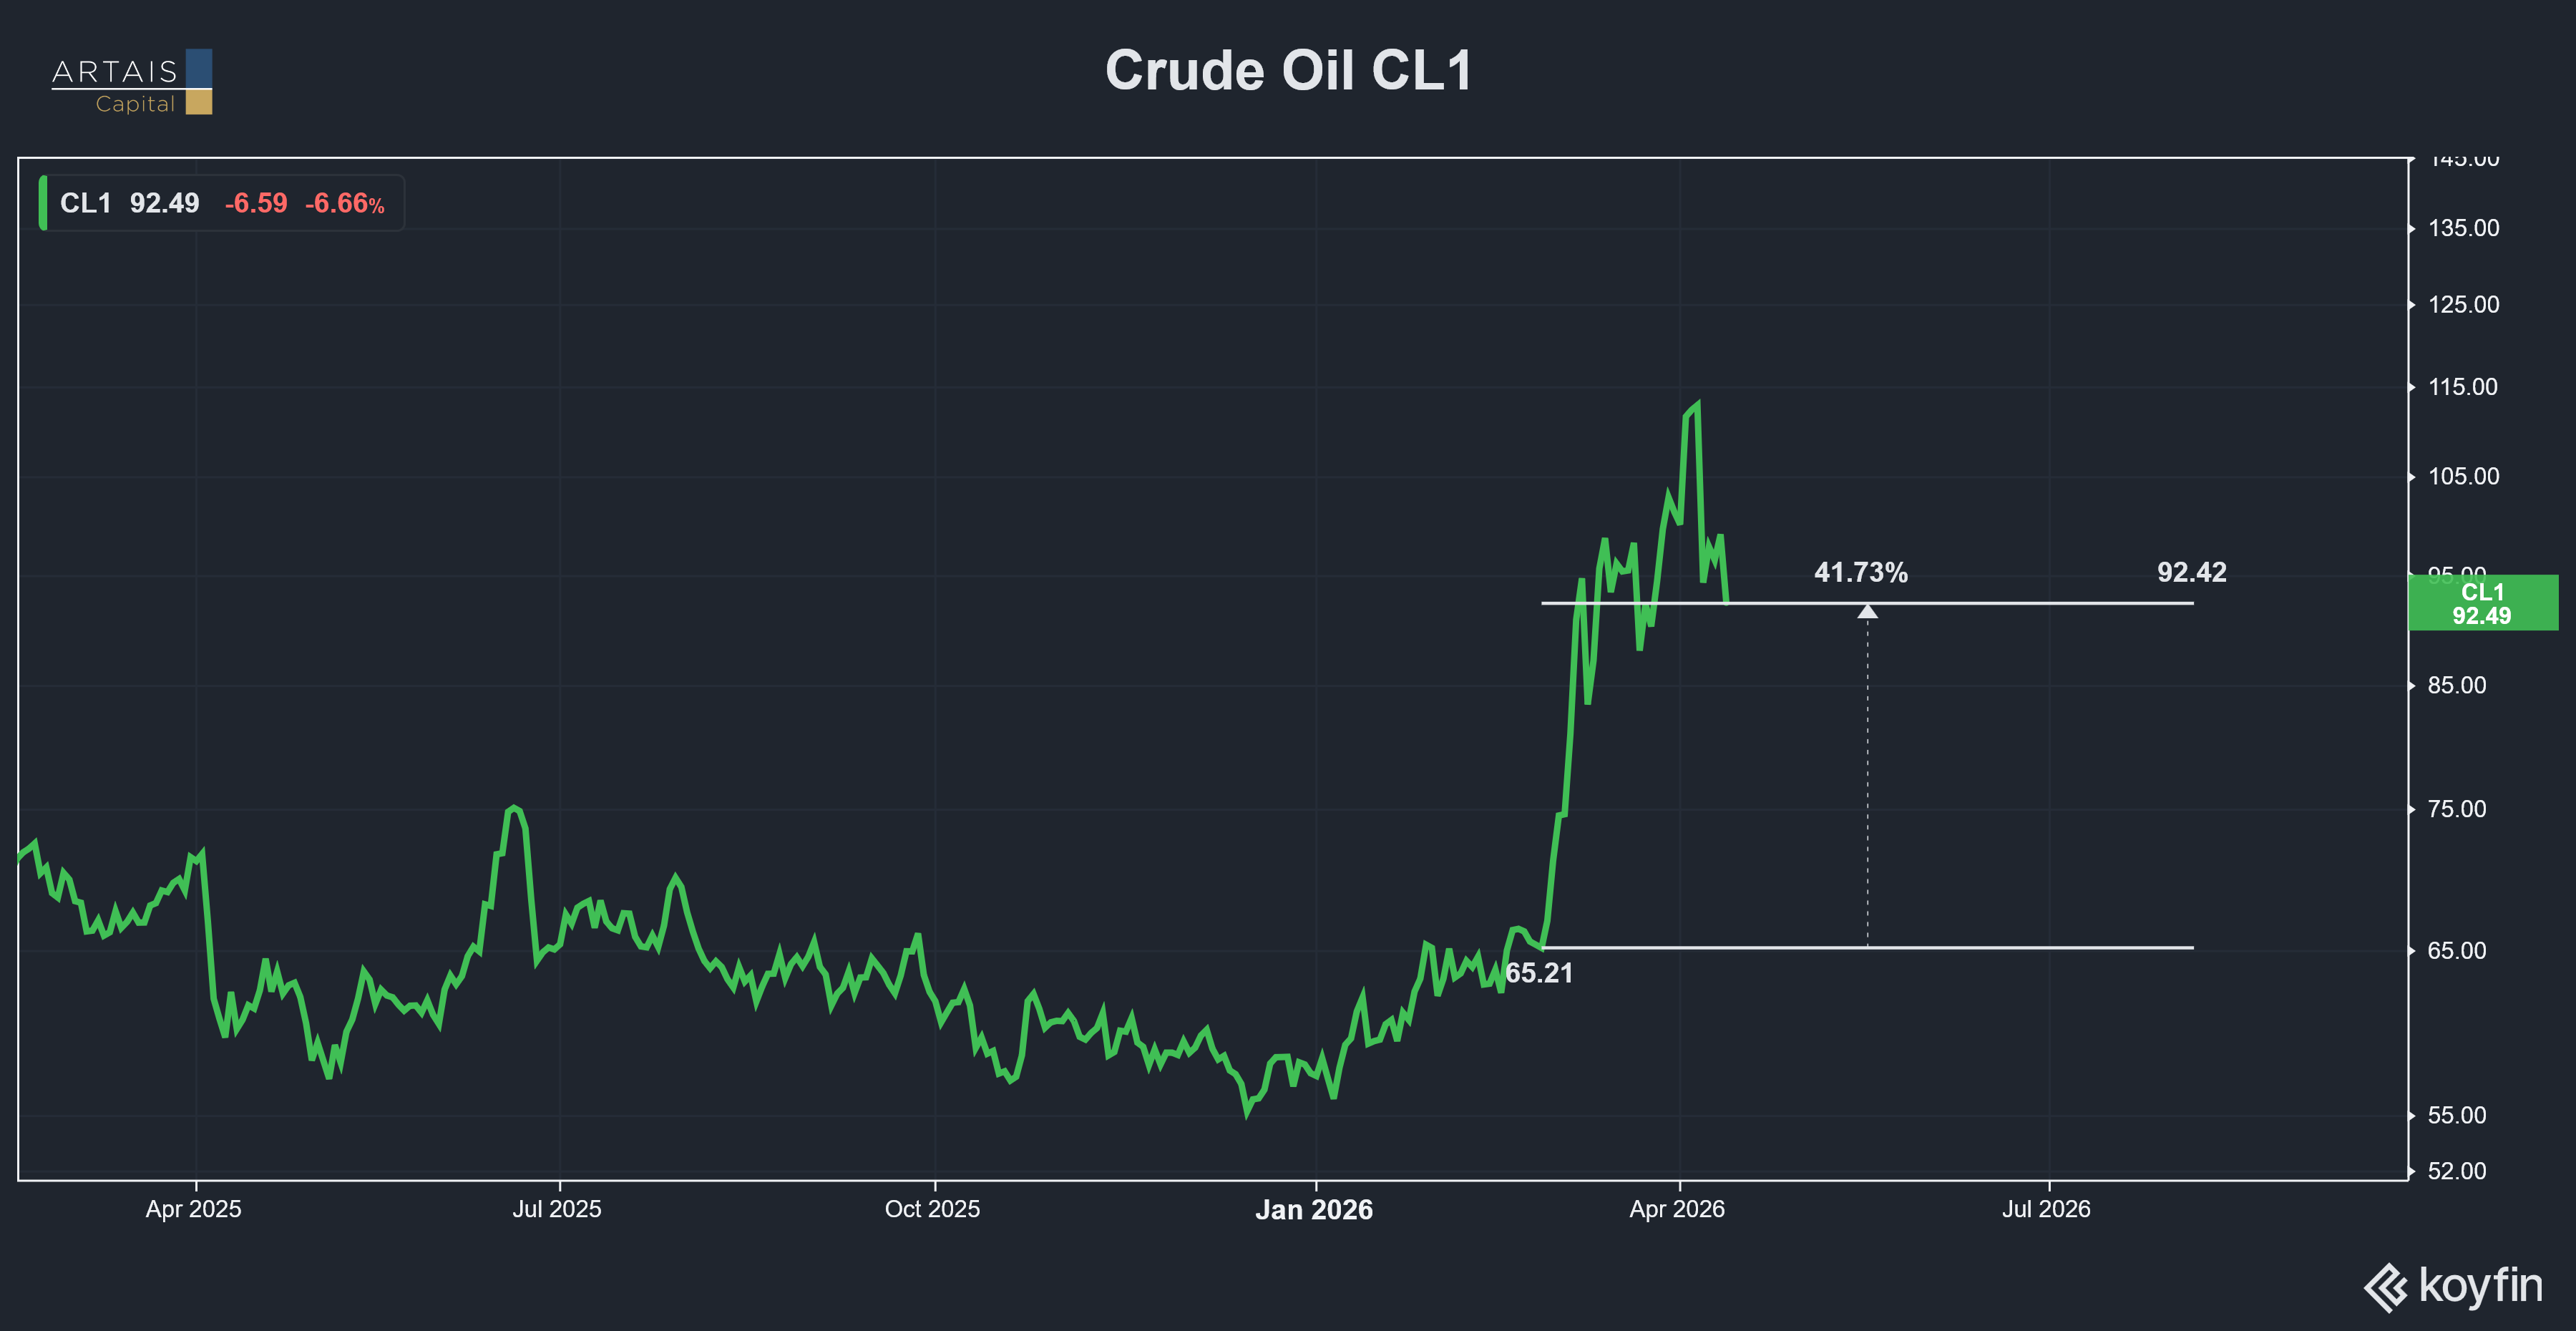
On February 28th, the U.S. and Israel launched 900 airstrikes on Iran. The Supreme Leader was killed. The Strait of Hormuz shut down. Oil jumped 55%. The S&P 500 index dropped nearly 8%.
And now? Back to pre-war levels as of yesterday:
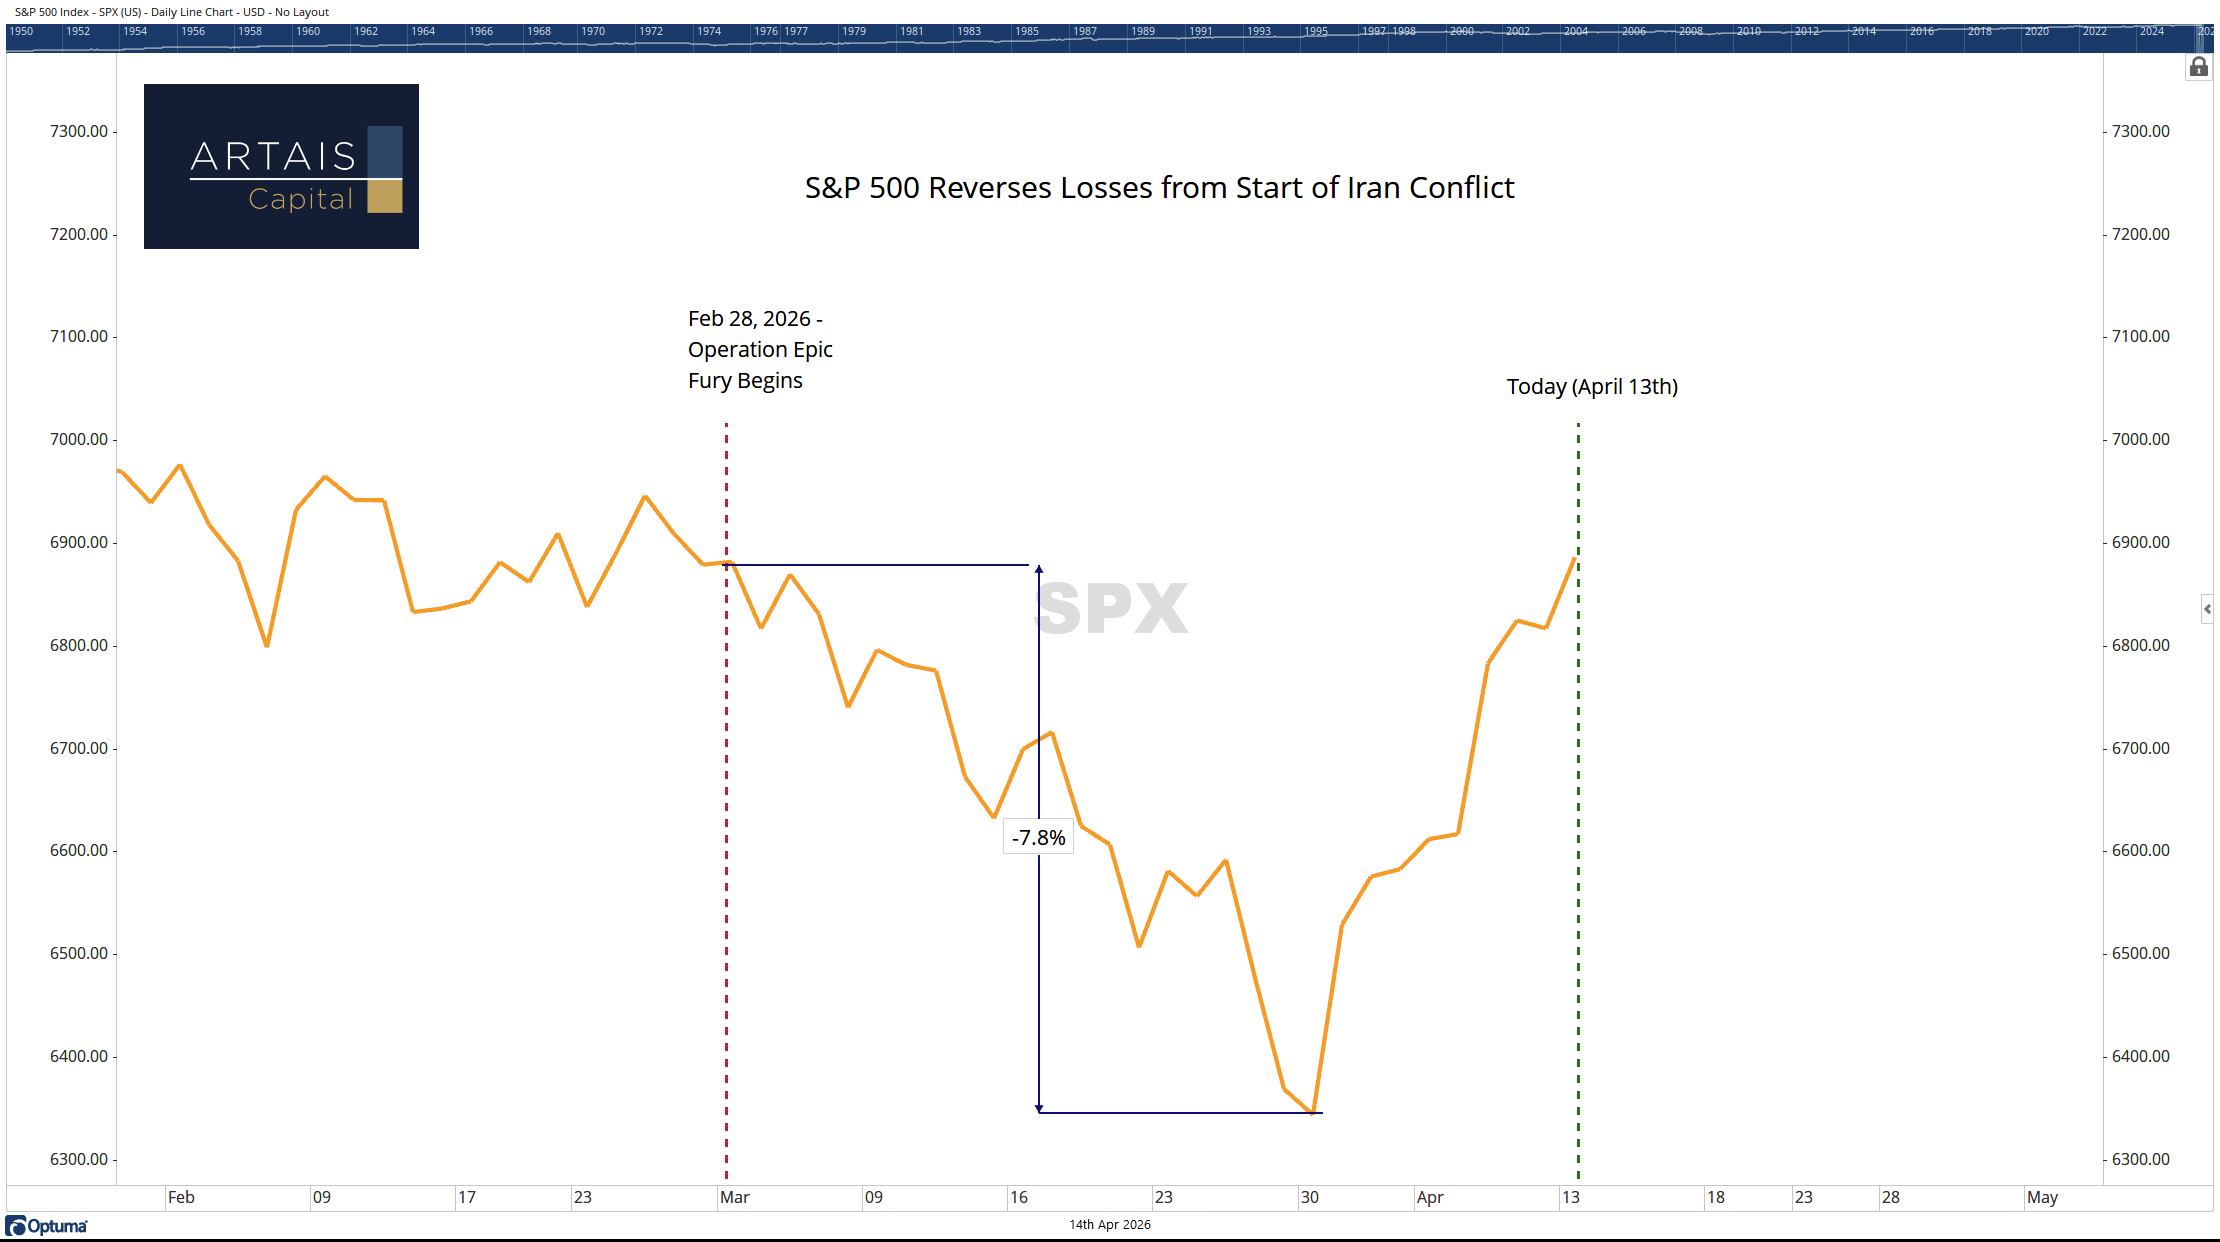
The market seems to have stopped caring about Iran.
I spent the past few days pulling together every credible study I could find on how long geopolitical shocks actually move markets.
I wanted a real answer to a simple question: how long does the market actually care?
A research note from RBC stated:
“In 20 major post-Second World War military interventions and hostilities that we evaluated, the S&P 500 fell six percent, on average, from the initial market impact to the trough level.
In 19 of the 20 events, the market took an average of only 28 days to return to where it had been prior to those events.”
Further published institutional research found that:
On average, Morningstar found that the S&P 500 took 16 days to bottom following past geopolitical shocks.
LPL Financial studied 26 events over 80 years and found an average of 39 days for the S&P 500 to recover.
After approximately 40 days, the geopolitical risk premium on equities became statistically indistinguishable from noise, according to the European Central Bank.
The current Iran conflict? 30 trading days from event to recovery. Right in the historical range.
However…
Every study I reviewed makes the same caveat: energy supply disruptions are the exception to the “markets recover quickly” rule.
The reason - energy disruptions have historically been followed by a recession.
James Hamilton at UC San Diego found that 10 of 11 U.S. recessions since 1945 were preceded by oil price spikes.
(Previously, I went into detail about recoveries during a recession here: Five Weeks of Red: What History Says Comes Next)
So on one hand, the market is following the historical post-geopolitical recovery “playbook” almost perfectly.
On the other hand, this conflict involves a sustained disruption to roughly 20% of global oil transit, which is structurally different from every post-WWII geopolitical shock except the 1973 embargo and the 1990 Gulf War.
What Do the Charts Say?
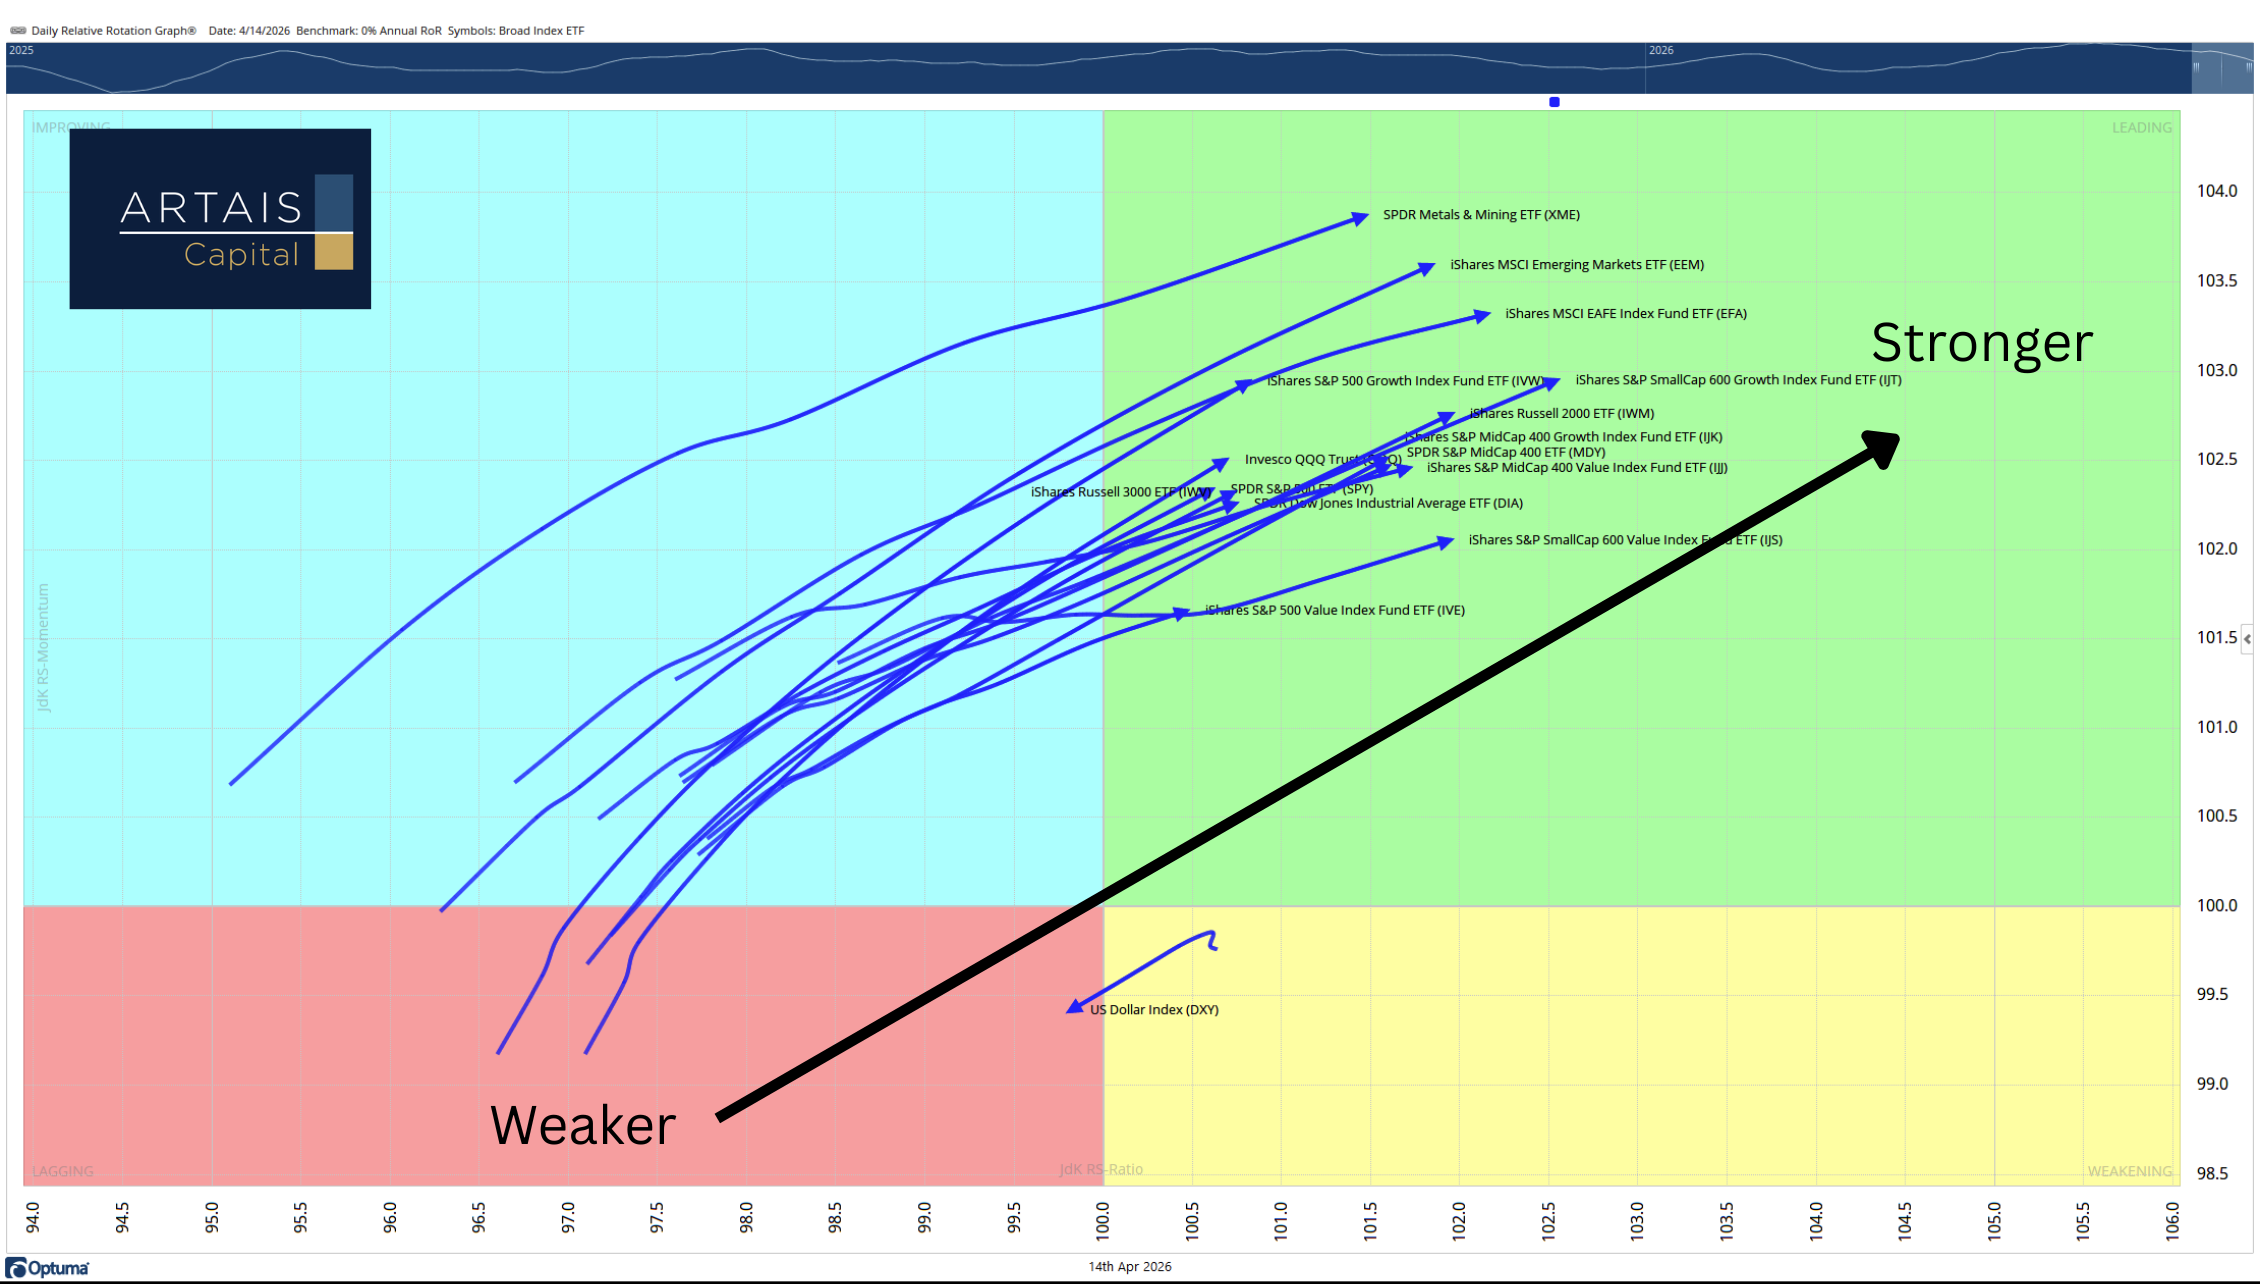
Improving momentum
Relative rotation graphs (RRG) are showing increasing momentum and relative strength across numerous areas of the market. Small, mid, and large-cap indices are all improving.
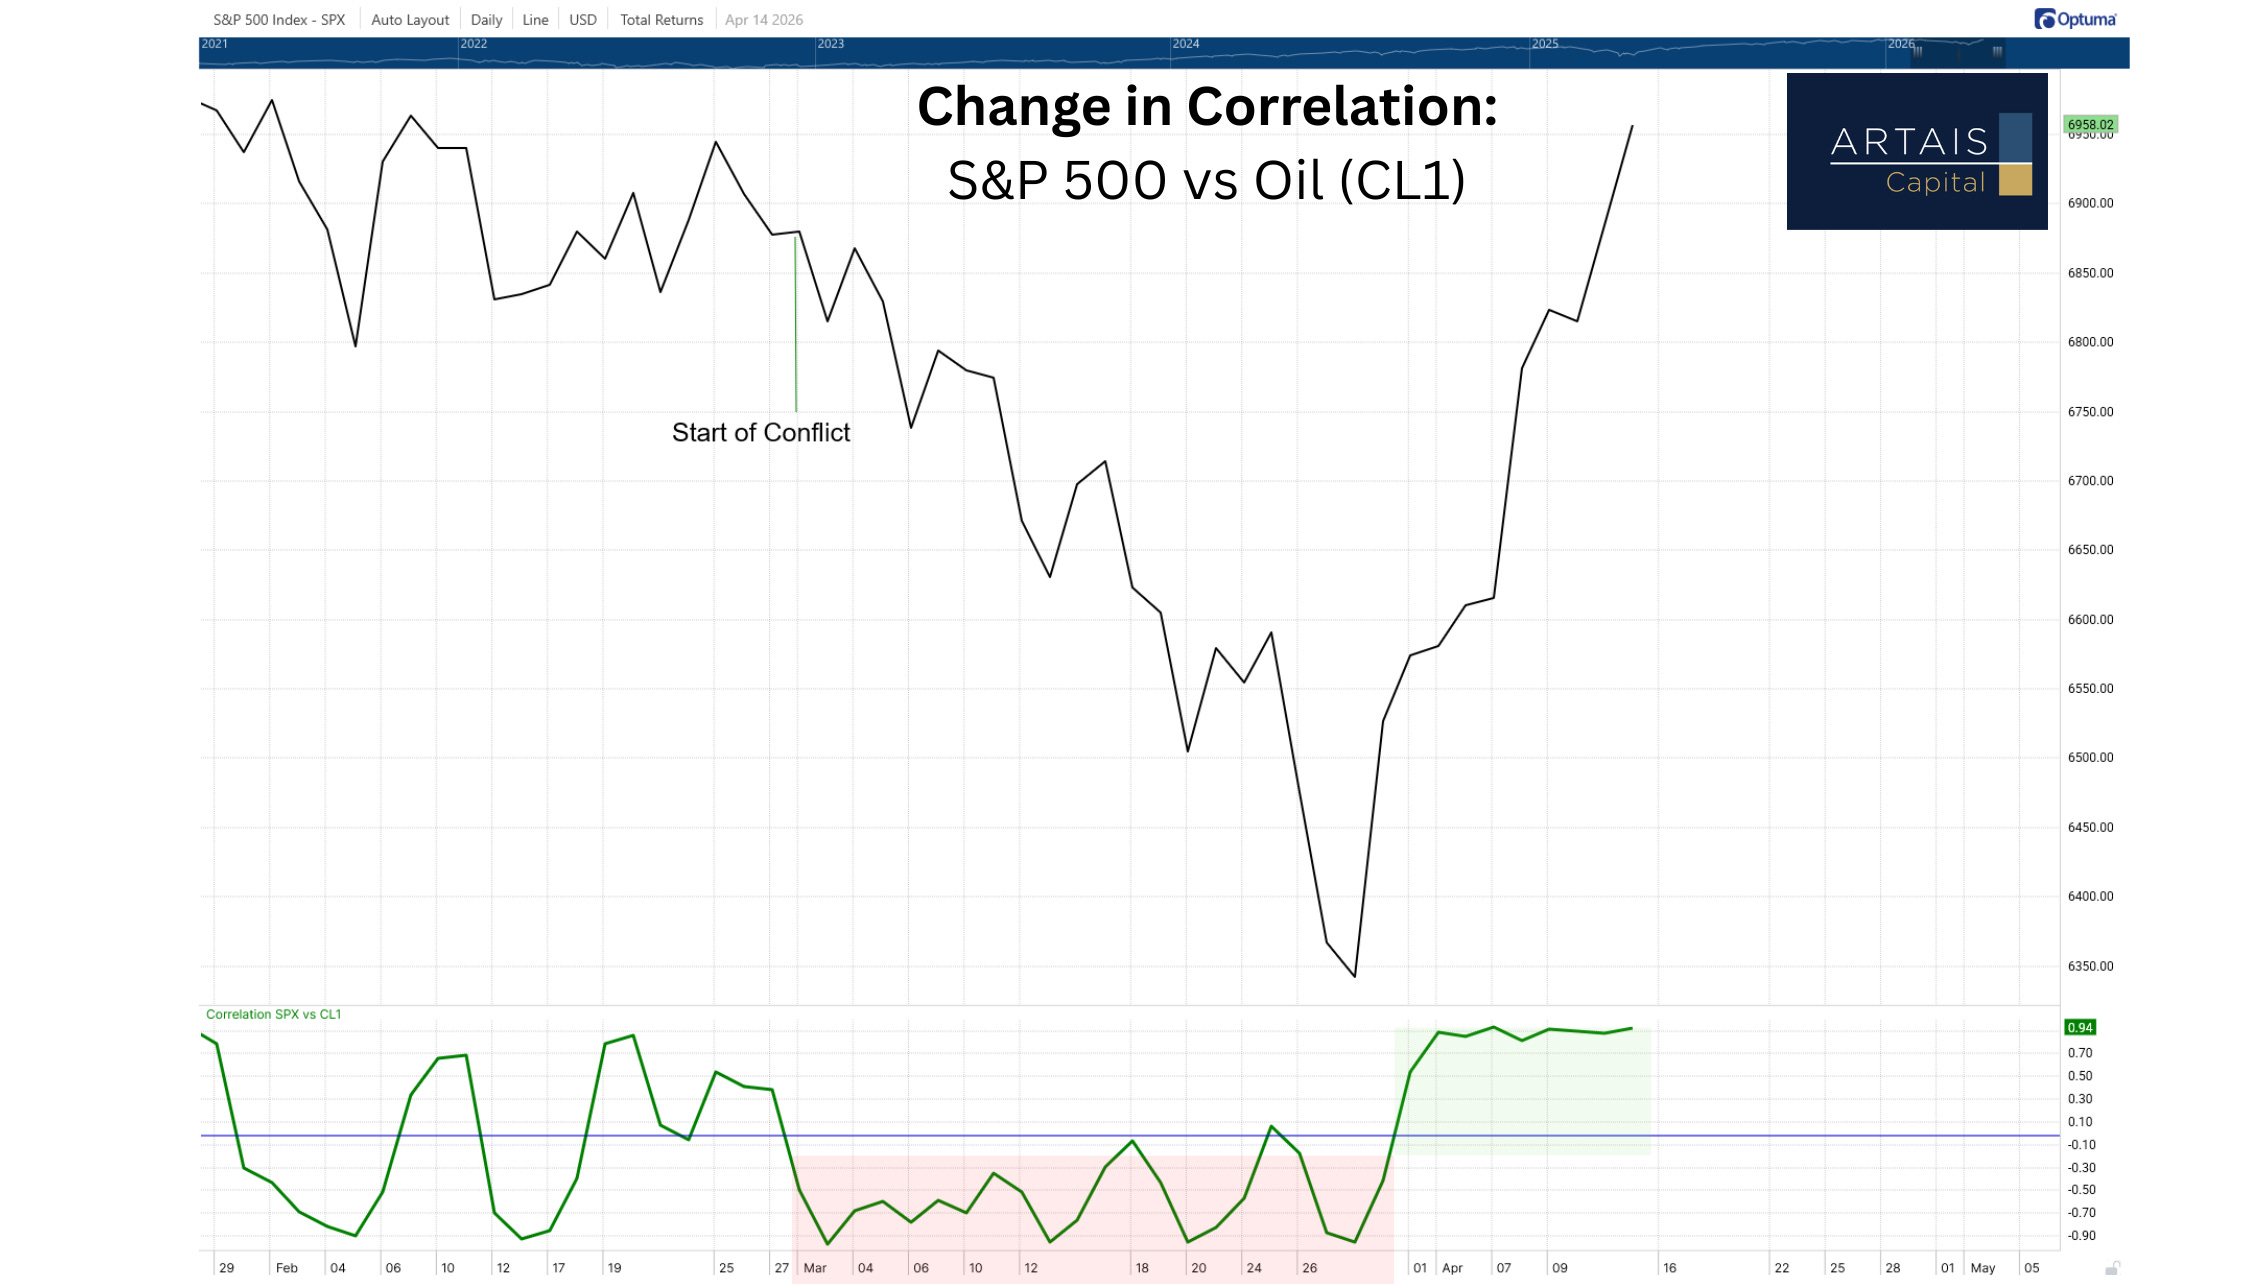
The price relationship between oil and the stock market has also changed.
At the start of the conflict, oil prices went up, and stocks went down.
Now, the relationship (correlation) has changed - indicating that investors are not as worried about the impact current oil prices are having on the S&P 500 index:
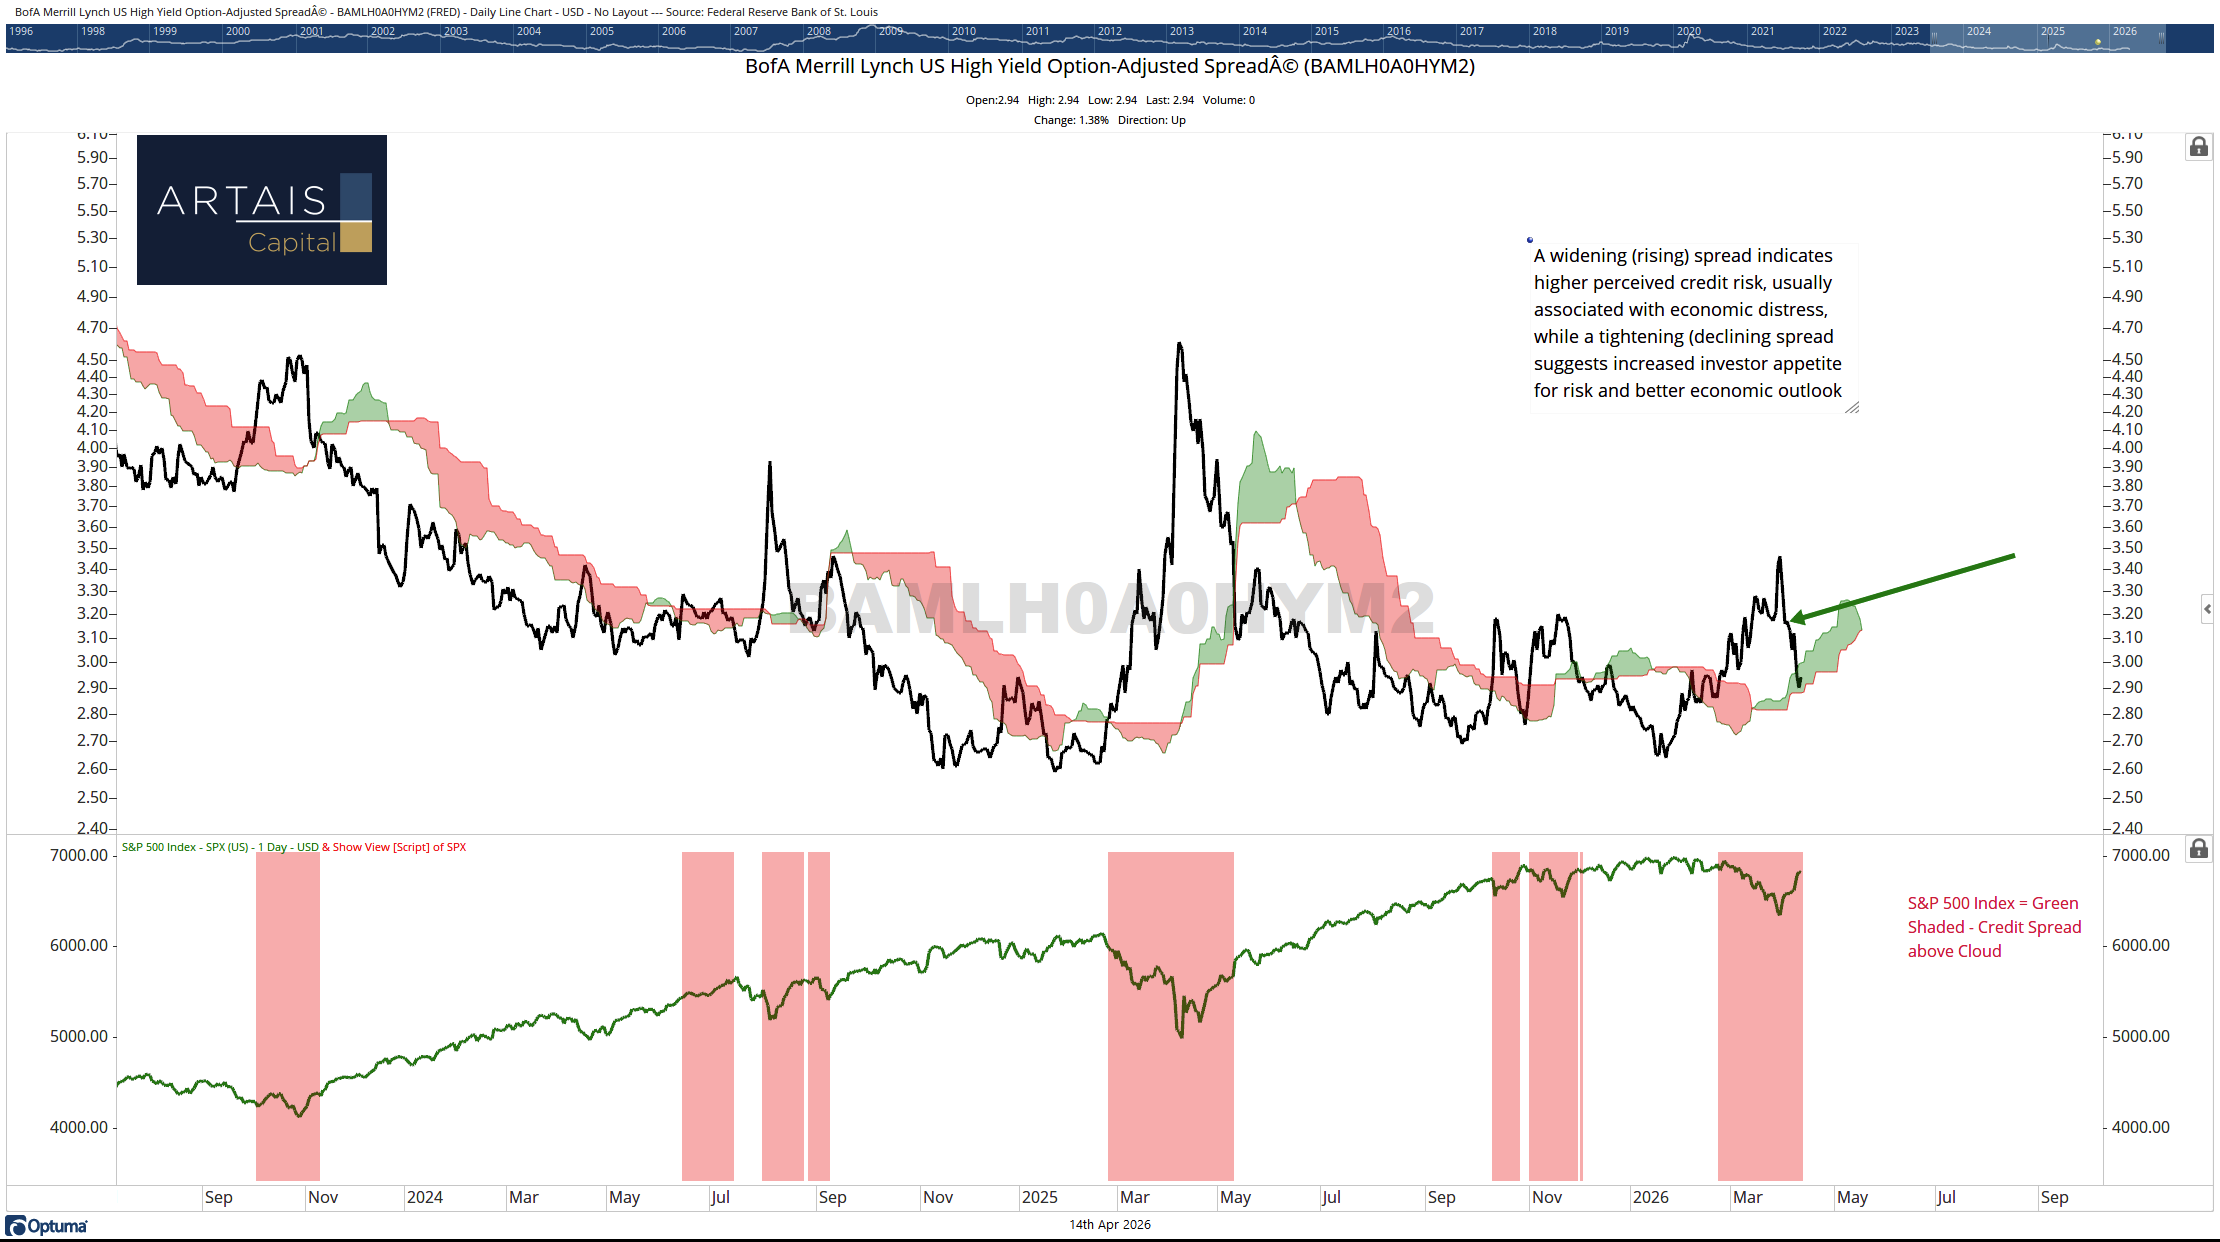
High-Yield Credit spreads are going back down.
High-Yield Credit spreads are the difference between the yield of a riskier asset class (in this case, high-yield bonds) and a safer benchmark, like US bonds.
As the difference, or spread, gets wider, it is an indication that investors are viewing high-yield bonds as riskier than before. If investors are viewing these bonds as riskier, it may be because they are becoming more worried that economic conditions are starting to deteriorate.
Upcoming Catalysts
While the charts show a stock market that is starting to regain its footing, it is a good idea to keep an eye on potential, upcoming, and near-term catalysts (both good and bad).
1. Earnings season is the first test
Q1 earnings growth is expected at +13.2% year-over-year, the strongest expectation going into any earnings season since Q2 2022. Nine of eleven sectors are projected to be positive, led by Information Technology at +45%. (FactSet, April 2026.)
The real test comes in late April, when Microsoft, Alphabet, Meta, Amazon, and Apple report. These five companies are roughly 25% of the S&P 500.
2. The Fed is Trapped
The Federal Open Market Committee (FOMC) is scheduled to hold a two-day meeting on April 28–29, 2026, and is expected to keep rates unchanged.
What will matter is the language the Fed uses. The market is waiting to hear if the Fed revises, or provides additional insight, on how it plans to handle rising inflation, combined with today’s delicate economy.
The March CPI report showed headline inflation at 3.3% year-over-year. The month-over-month increase was 0.9%, the largest since 1967.
Gasoline jumped 21.2% in a single month and accounted for three-quarters of the increase. (Bureau of Labor Statistics, April 10, 2026.)
3.3% headline inflation with oil above $95 is not a backdrop that invites rate cuts. The March FOMC minutes revealed a willingness to consider rate increases, the most hawkish signal since the hiking cycle ended.
The problem with raising interest rates to combat inflation is that it will further weaken the economy.
Already, consumer sentiment is at a record low:

3. April 30th - Will Q1 GDP Show We Are In A Recession?
The advance estimate of first-quarter GDP arrives on April 30, just two days after the FOMC decision. Q4 2025 was revised down to 0.5%. A negative Q1 print would mean two consecutive quarters of near-zero or negative growth.
4. The Iran Ceasefire
The market has priced in a ceasefire. But the ceasefire is fragile.
Oil is roughly 37-40% above pre-war levels. The Strait of Hormuz, which handles about 20% of global oil transit, remains tightly controlled.
If the ceasefire holds and the Strait reopens, oil prices settle, inflation pressure fades, and the Fed gets room to cut. This is what the market is hoping for.
If talks collapse permanently and the naval blockade escalates, we may see oil surge above $120. At that level, the market may need to start pricing in a recession.
5. Private Credit:
This is the one that keeps me up at night. The private credit market is $1.8 trillion in outstanding loans, and it is showing stress that most retail investors have no idea about.
The U.S. private credit default rate has risen to 5.8% (Fitch Ratings), with direct lending defaults projected to reach 8%.
Why worry about private credit?
JPMorgan estimates that 30% of the $1.8 trillion in private credit loans are to software companies. The same companies that are most at risk from AI disruption.
So the $700 billion in AI capital spending that is supposed to be the bull case for tech may actually be the bear case for private credit.
A Goldman Sachs survey found that 63% of institutional fund managers cite private credit as the most likely source of a systemic event.
For now, as I showed above, credit spreads are normalizing, but it is something that I will be keeping a close eye on.
To Sum Up
The market is not ignoring the risks. It is making a bet.
The bet is that the ceasefire holds, the Strait reopens, oil retreats, inflation cools, and the Fed finds room to breathe.
History says geopolitical shocks fade.
But history also says that when a geopolitical shock comes attached to an energy disruption — the kind that hits 20% of global oil supply — the aftermath tends to look less like a recovery and more like the opening chapter of a recession.
I believe the reason investors are leaning towards an optimistic outcome is due to the mid-term elections.

Voters’ main concerns center around rising costs. An extended conflict that puts oil above $120 per barrel would likely result in significantly higher costs.
I’m willing to bet that Trump is facing tremendous pressure from Republican candidates who are up for reelection this Fall.
The market may have found its most unlikely source of stability: a President who needs gas prices to be lower before November.