

Equity investors seem to be in a bit of a holding pattern as the S&P 500 index has yet to successfully close above a key resistance level:
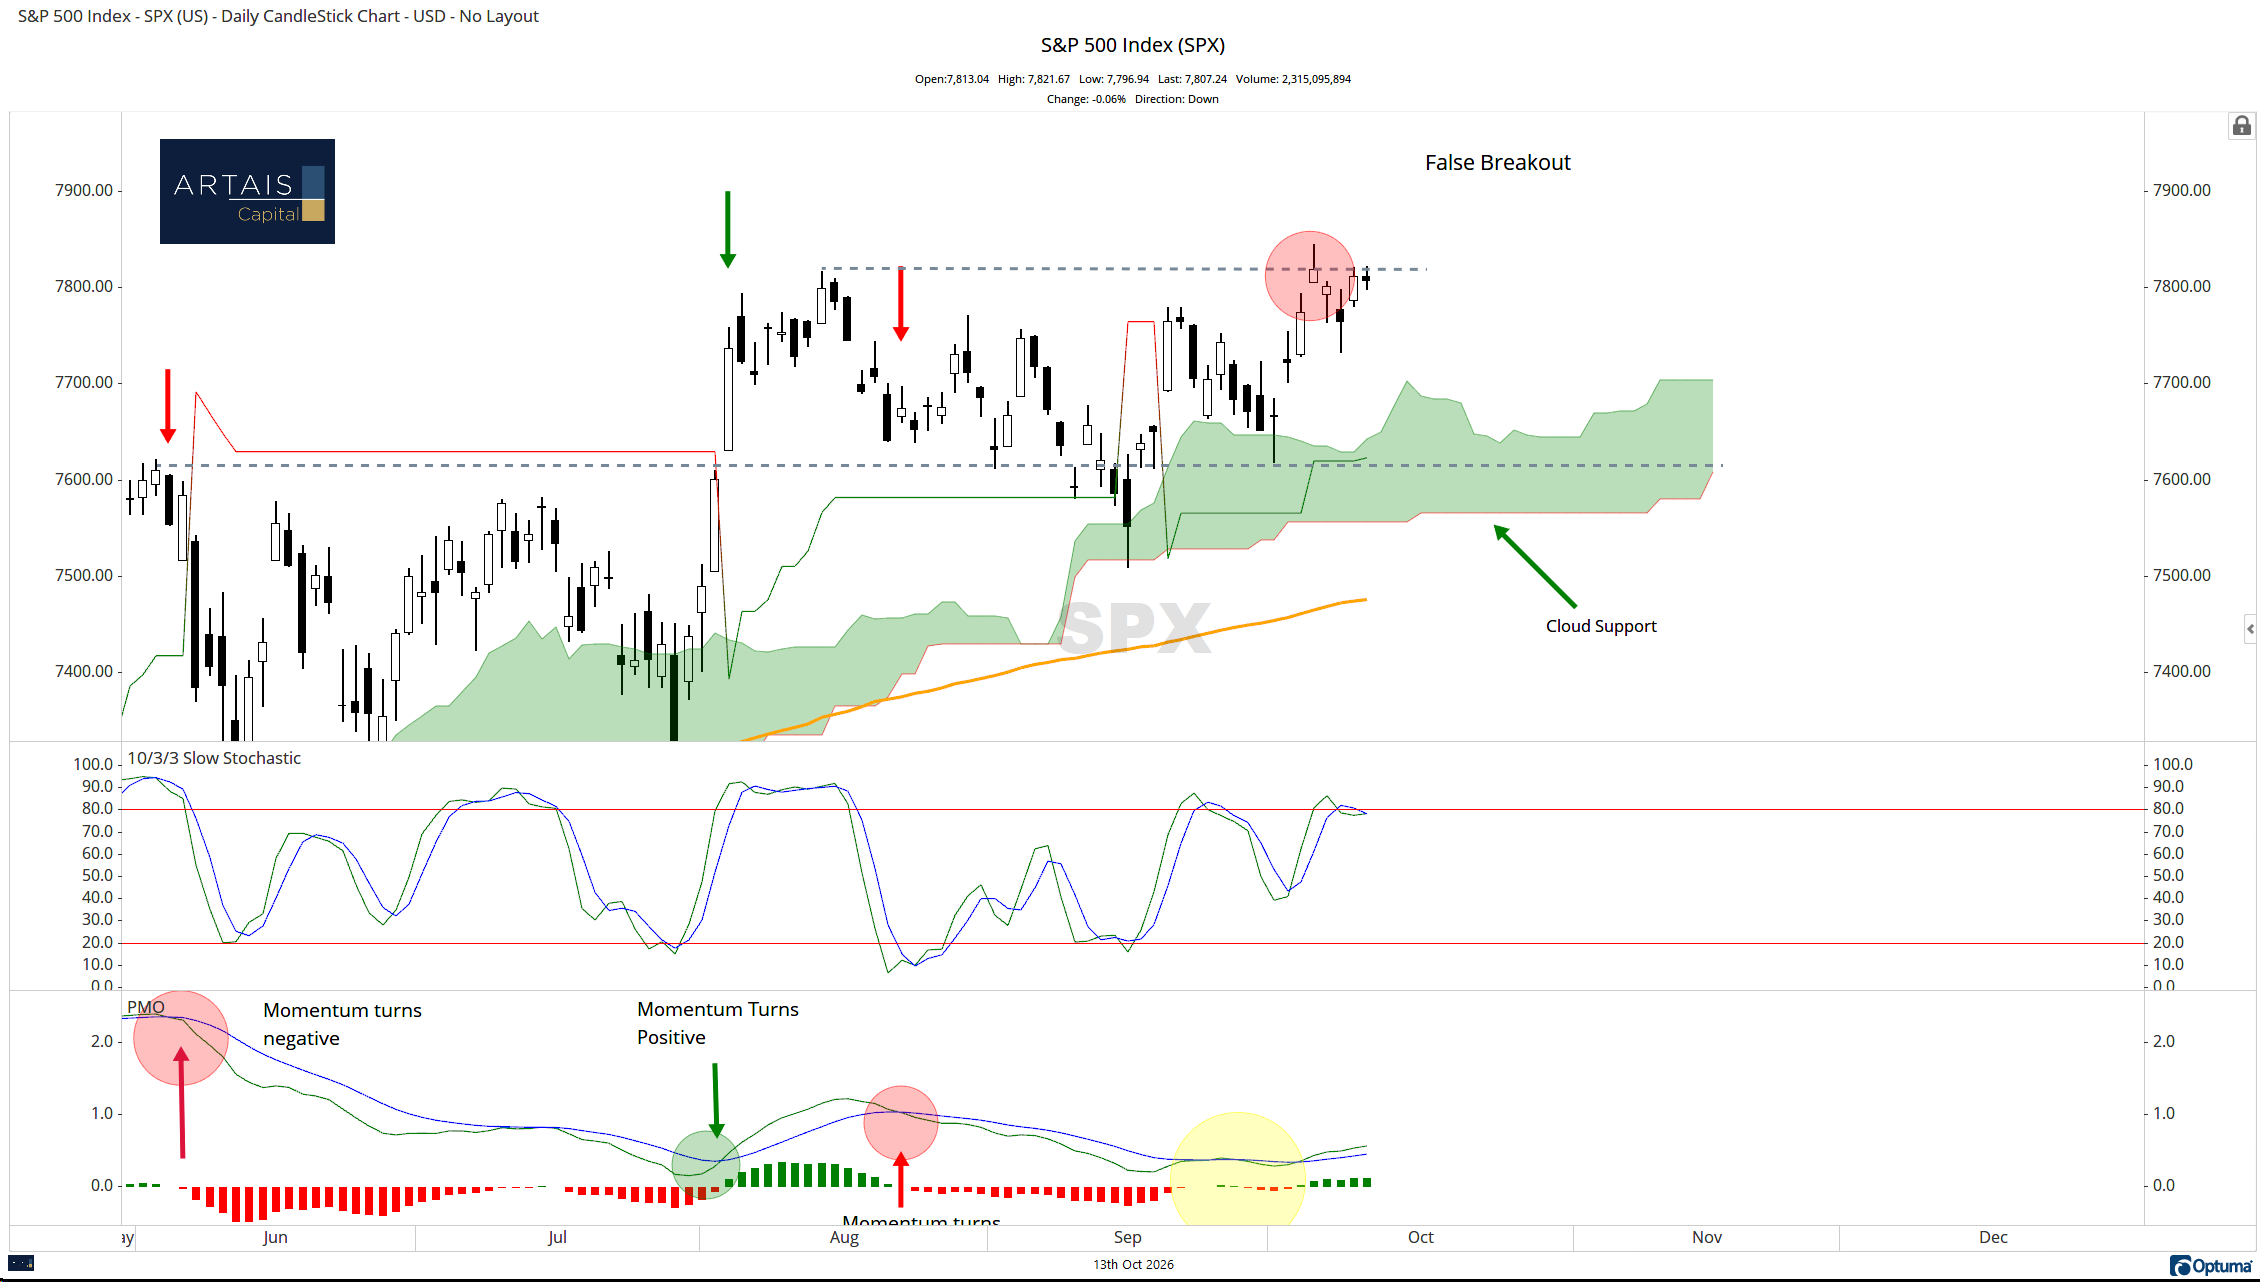
This hesitation is coming in the form of rotation out of high-beta growth names and into lower-volatility value names.
High Beta vs Low Volatility
The Relative Rotation Graph (RRG) below shows a continued decline in momentum and relative strength in growth and high-beta areas of the S&P 500.
At the same time, low-volatility and value names are improving:
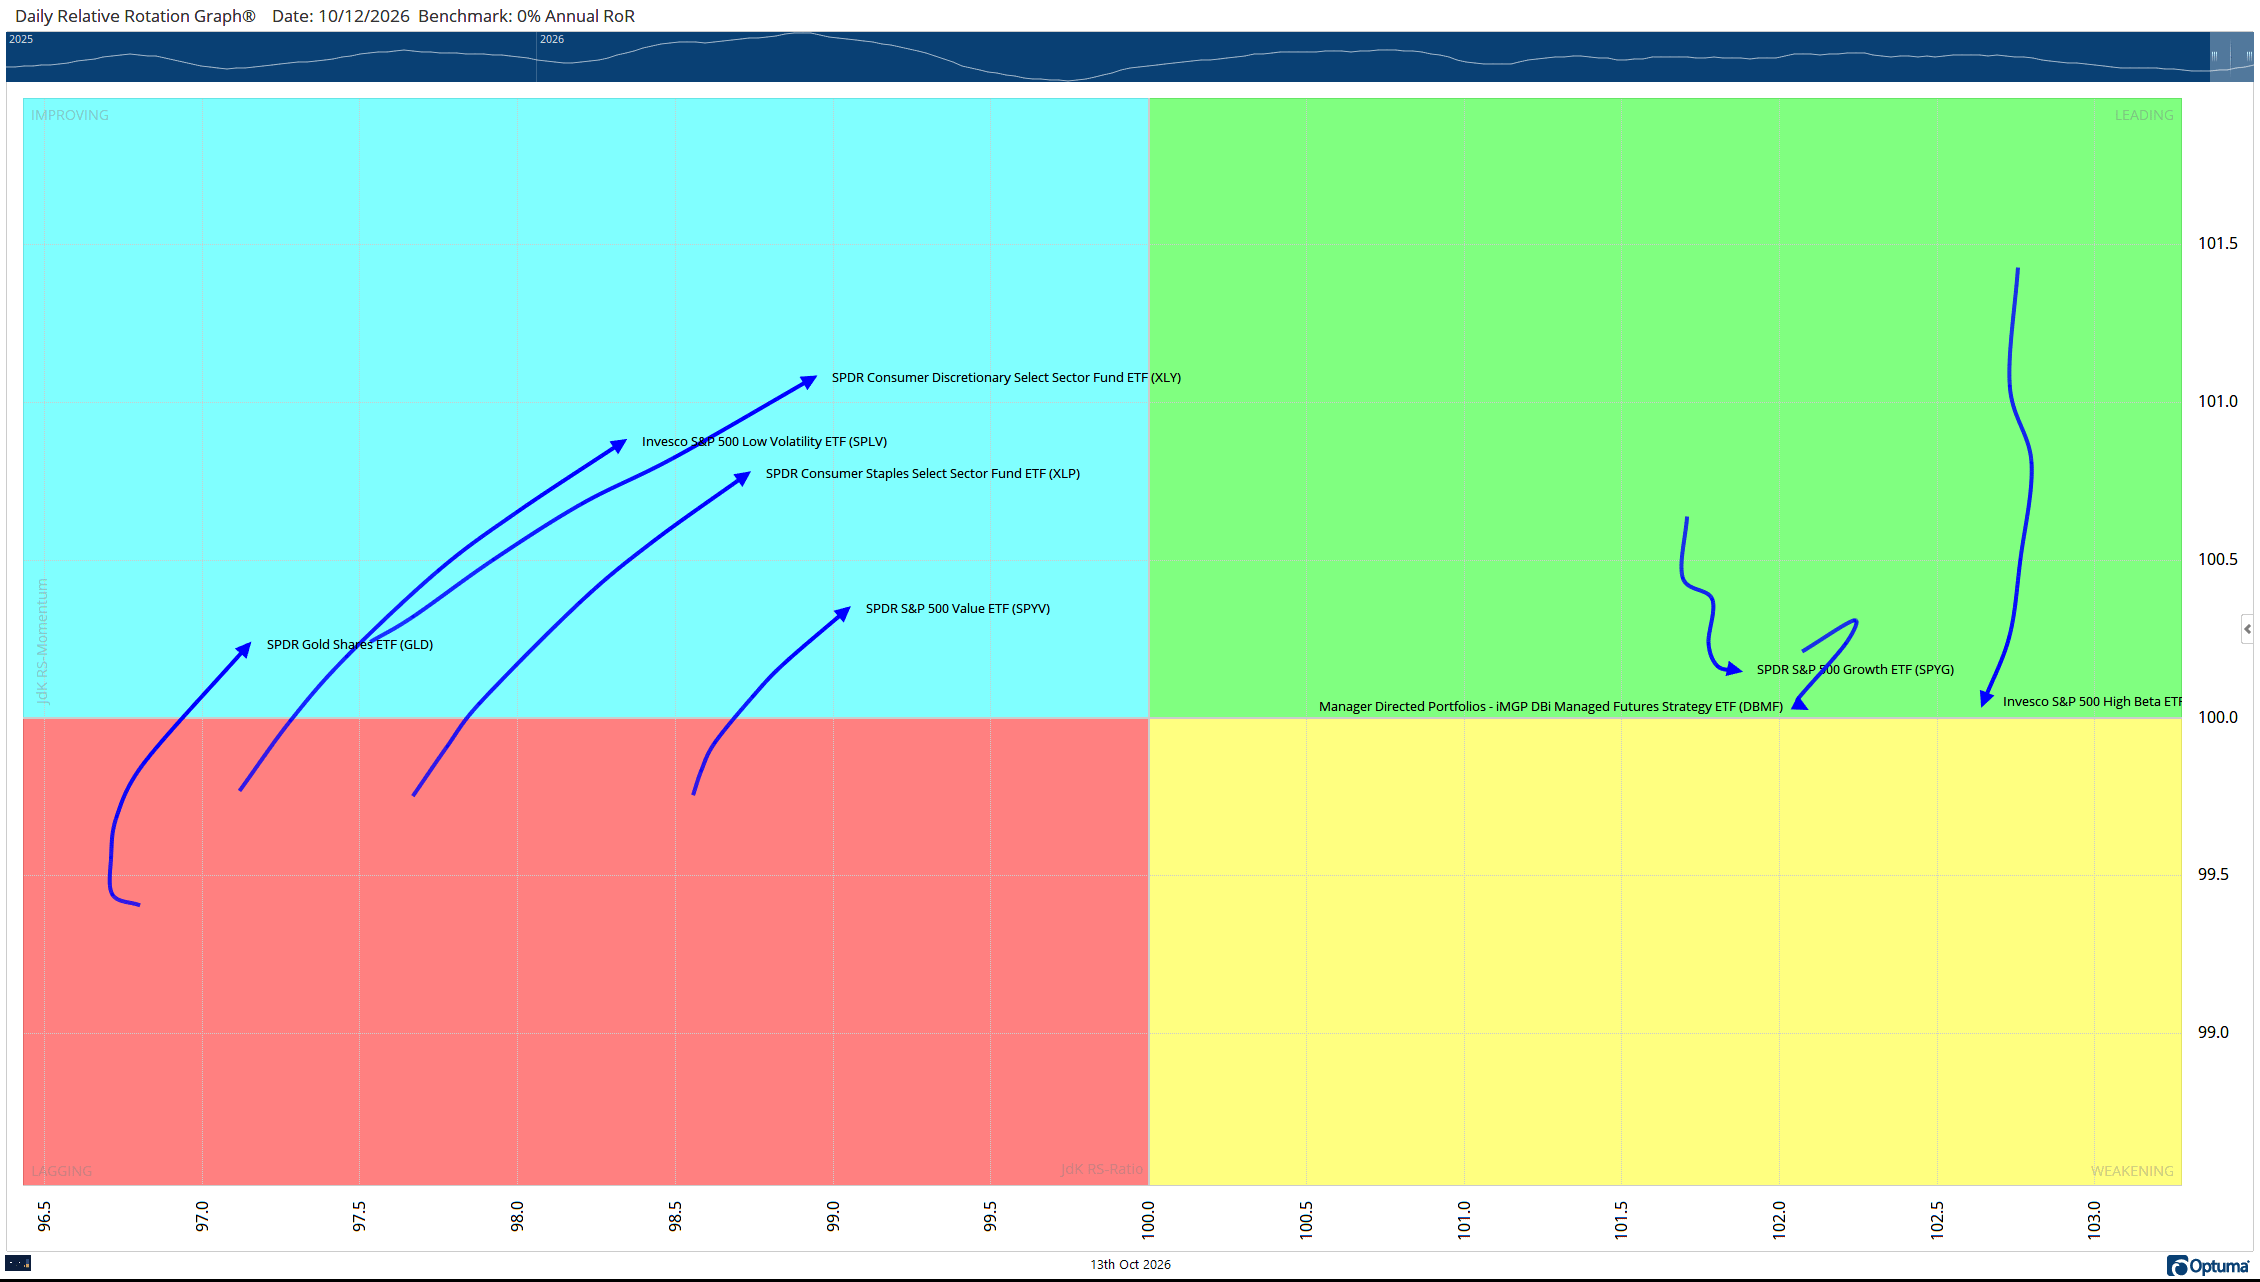
Relative Rotation Graphs tend to rotate in a clockwise fashion, with the upper right quadrant being the strongest and the lower left quadrant being the weakest
As of now, this looks like a rotation away from tech and not a rotation out of the stock market:
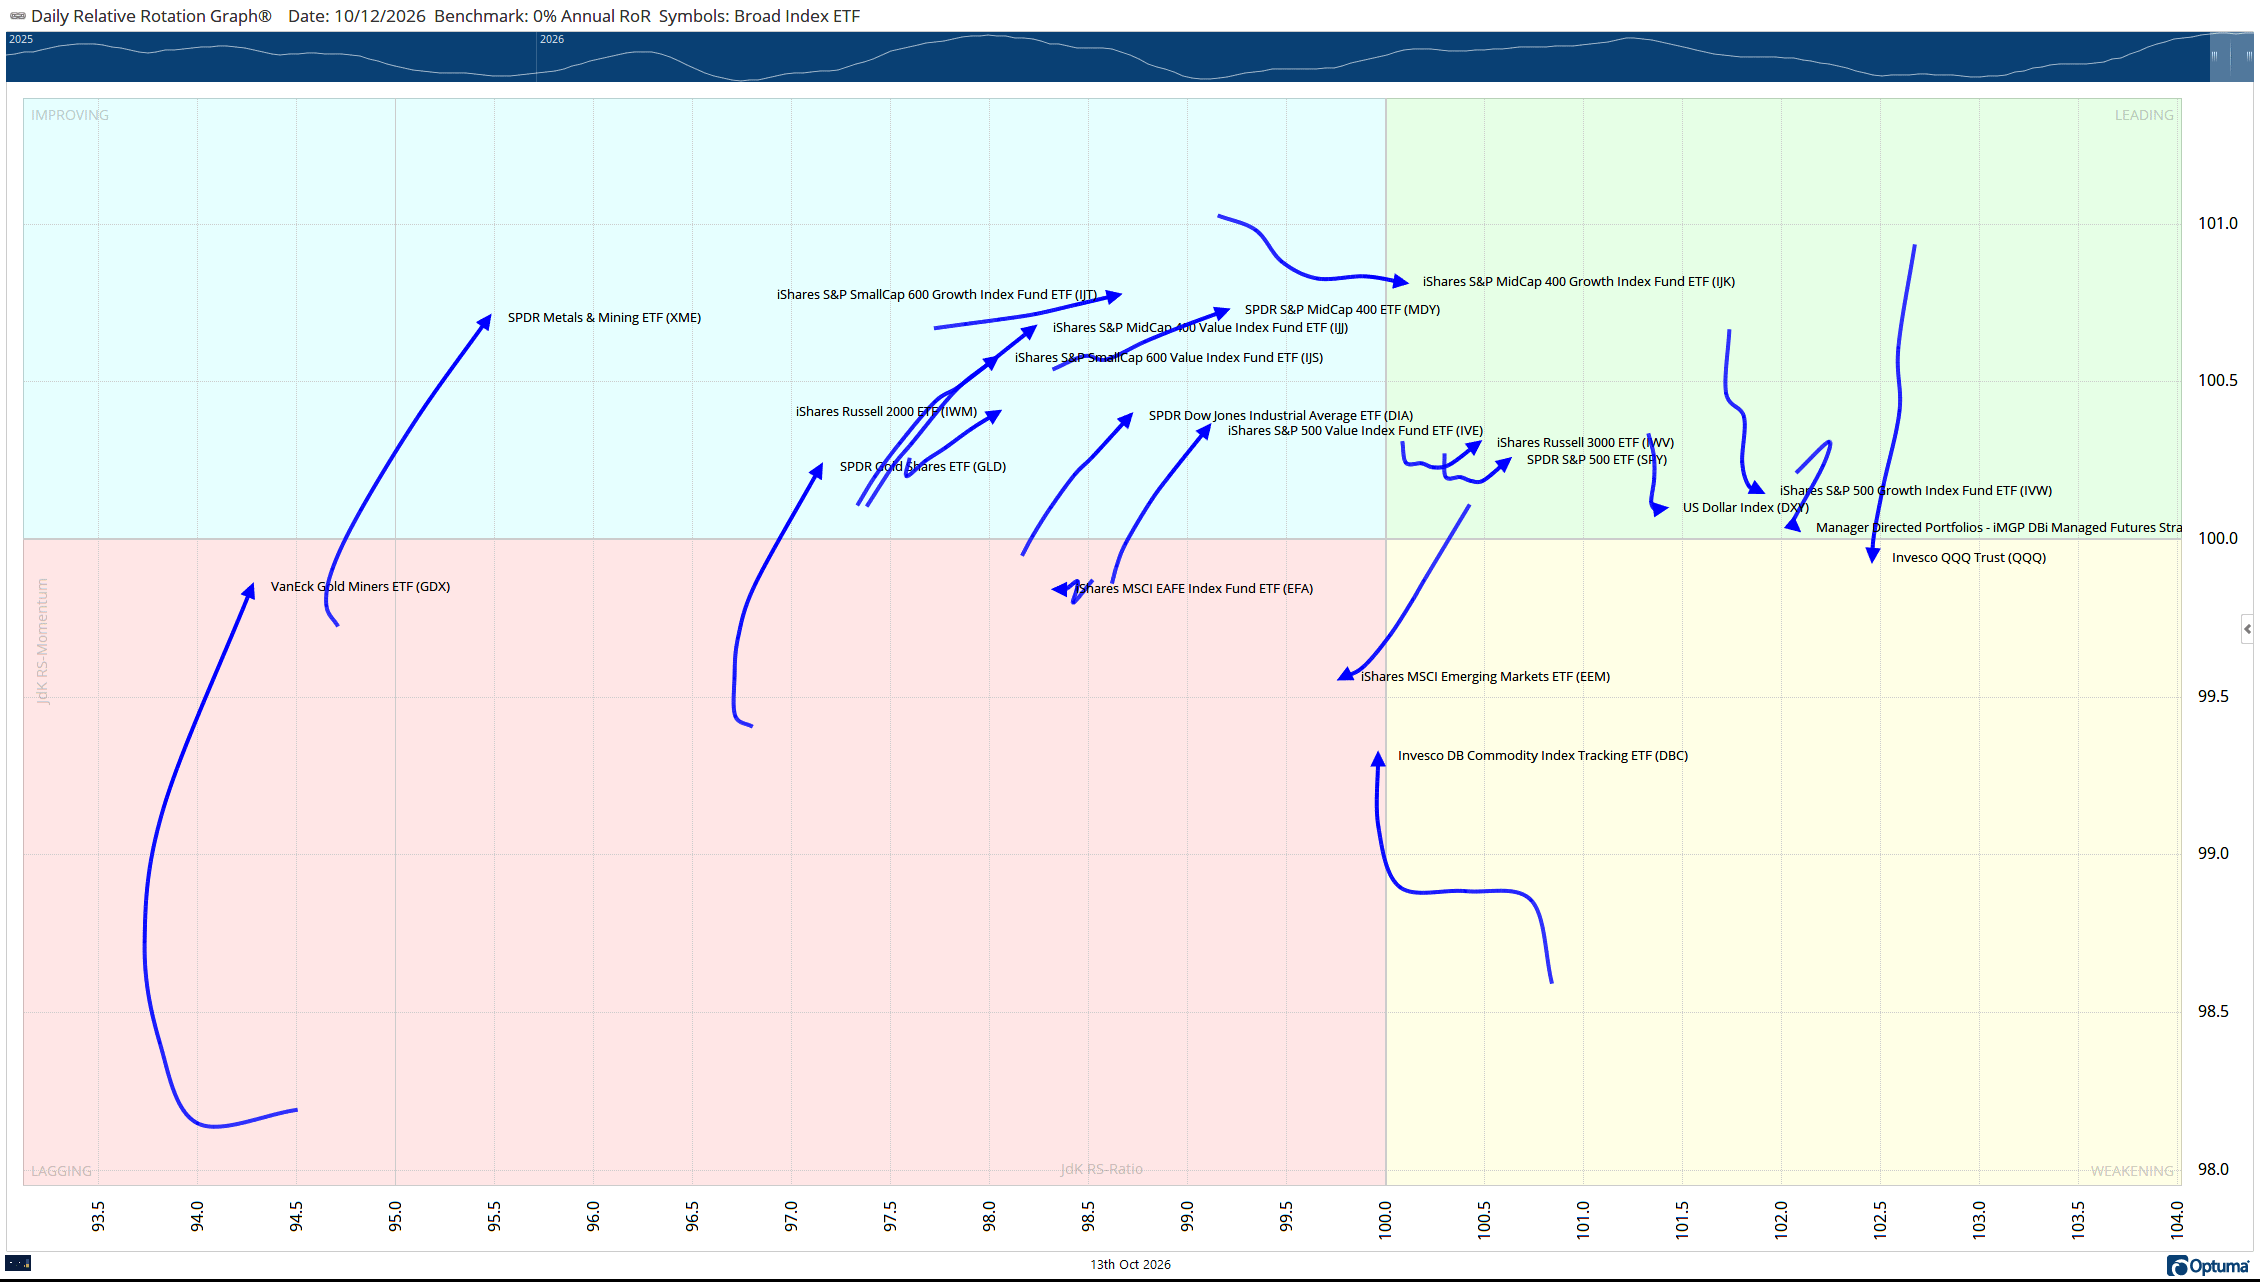
Momentum and relative strength are weakening for S&P 500 (Large-Cap) Growth and QQQ stocks, while improving in Small and Mid-Cap names
Market Breadth Is Improving
Breadth is starting to improve. As I have mentioned before, the S&P 500 index is heavily weighted towards technology stocks.
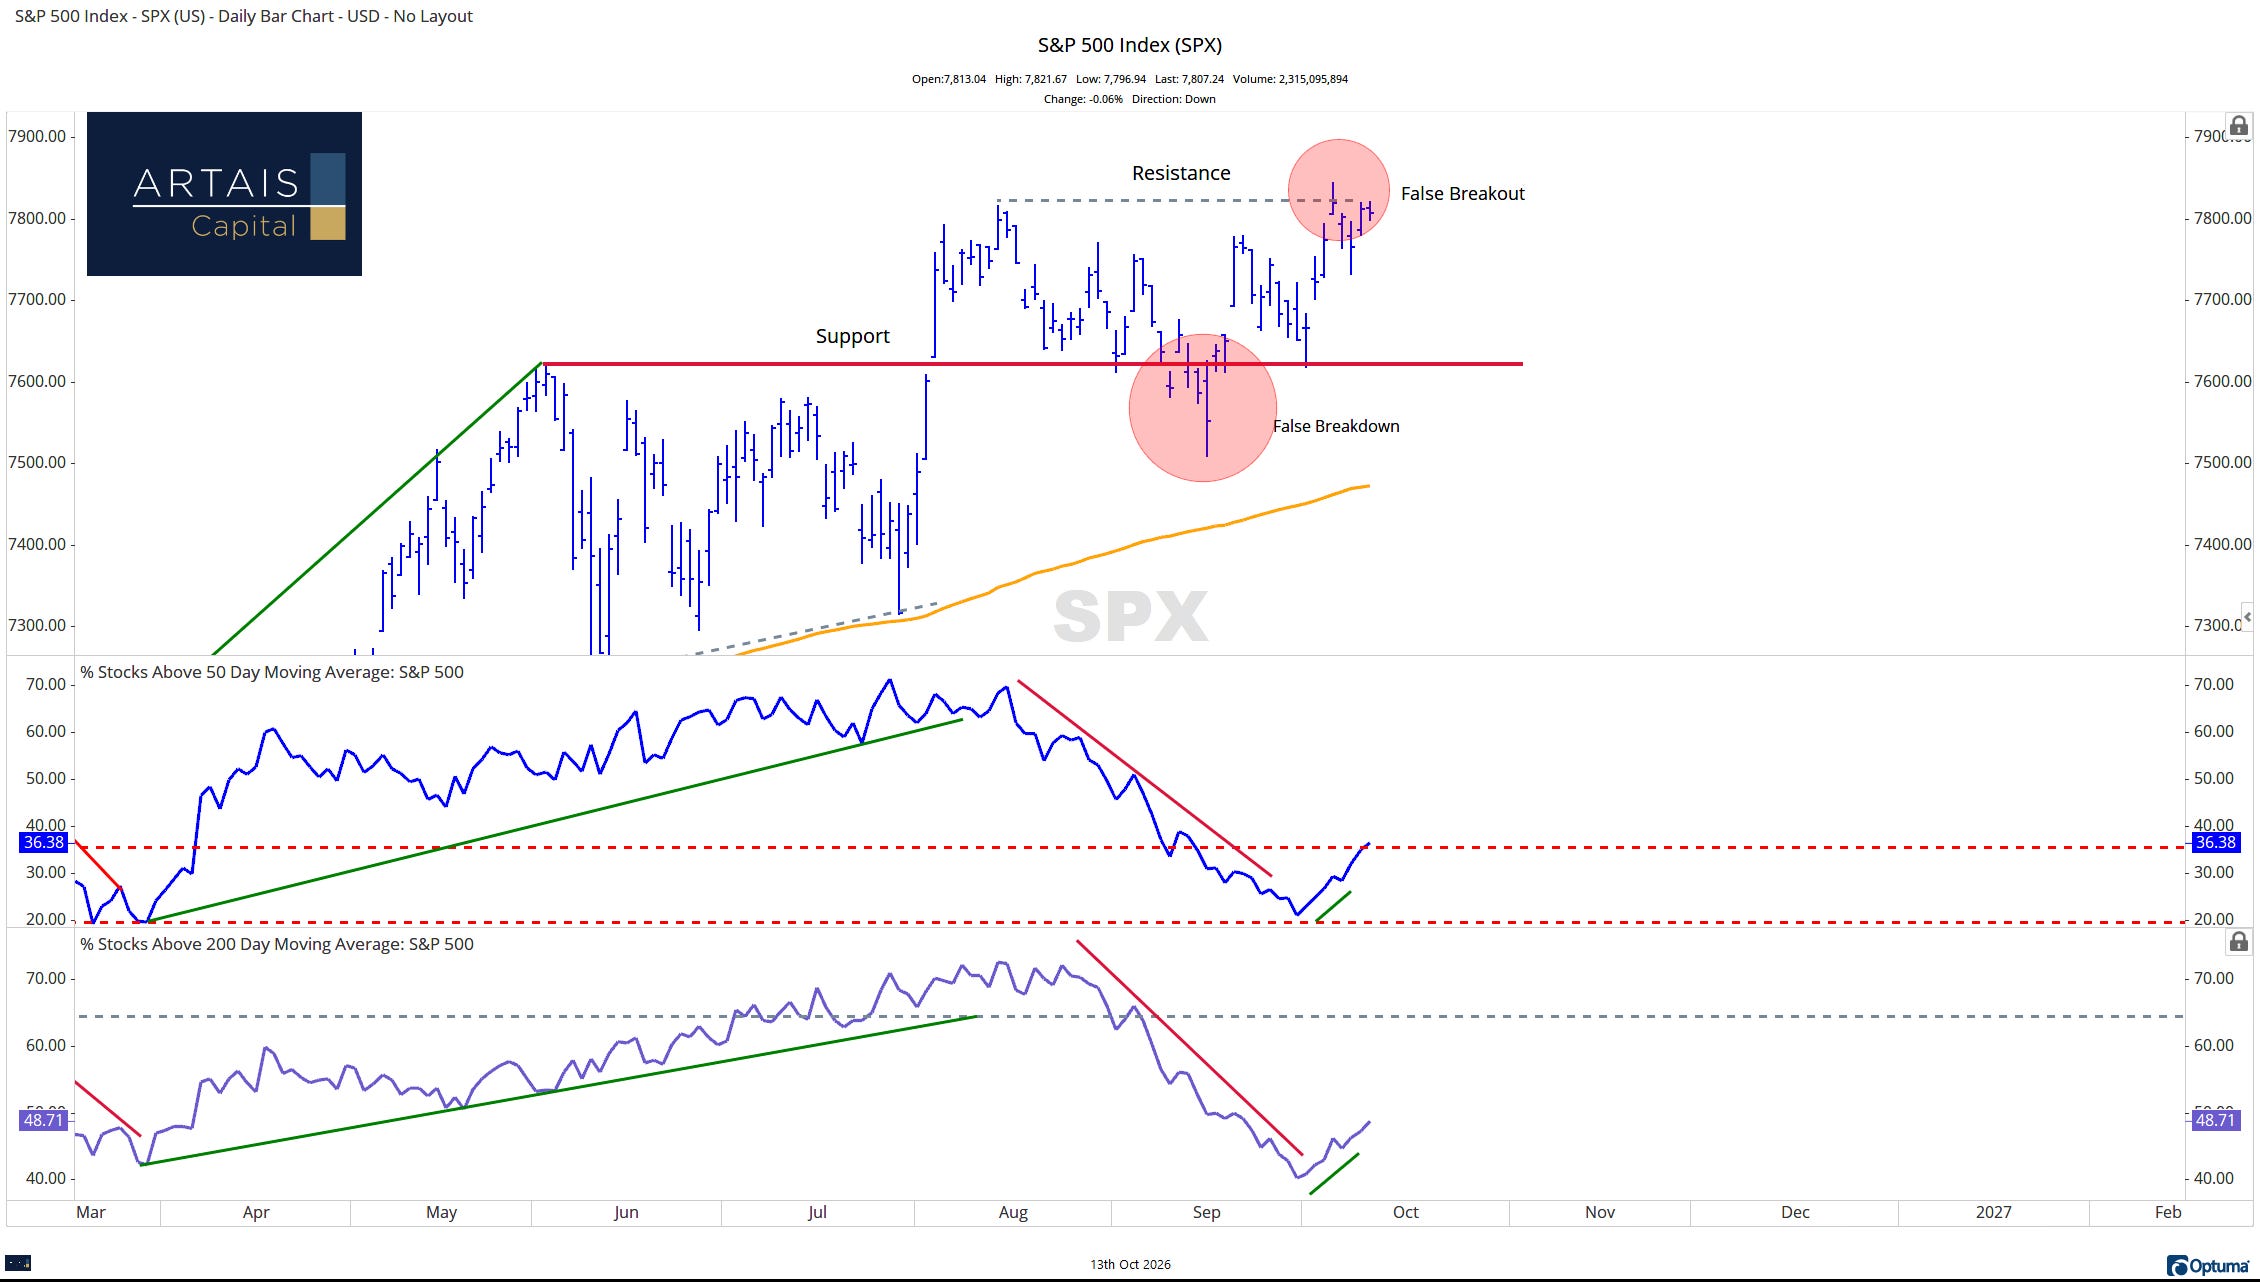
Market breadth is improving as the number of stocks trading above their 50 and 200-day moving averages rises
For breadth to improve while tech is declining, we need to see strong participation in non-tech names, which is what I am currently seeing.
However, whether there will be enough buyers in non-tech names to keep supporting the index remains to be seen.
If investors are rotating away from high-beta names to reduce risk, they may be investing only part of that money in lower-volatility areas of the market and keeping the rest in cash/short-term T-bills.
If this is the case, then we may start to see the S&P 500 index breakdown.
Bullish Percent Index
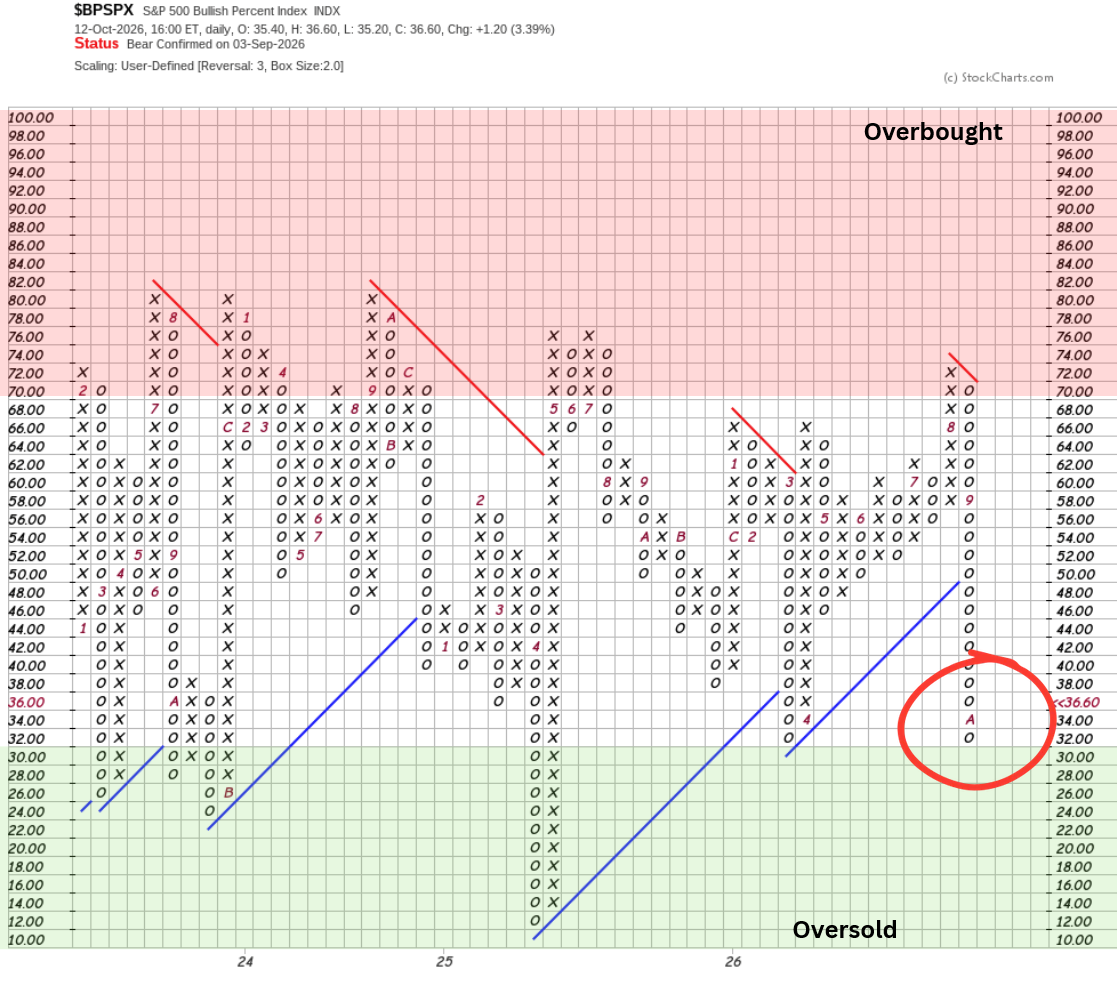
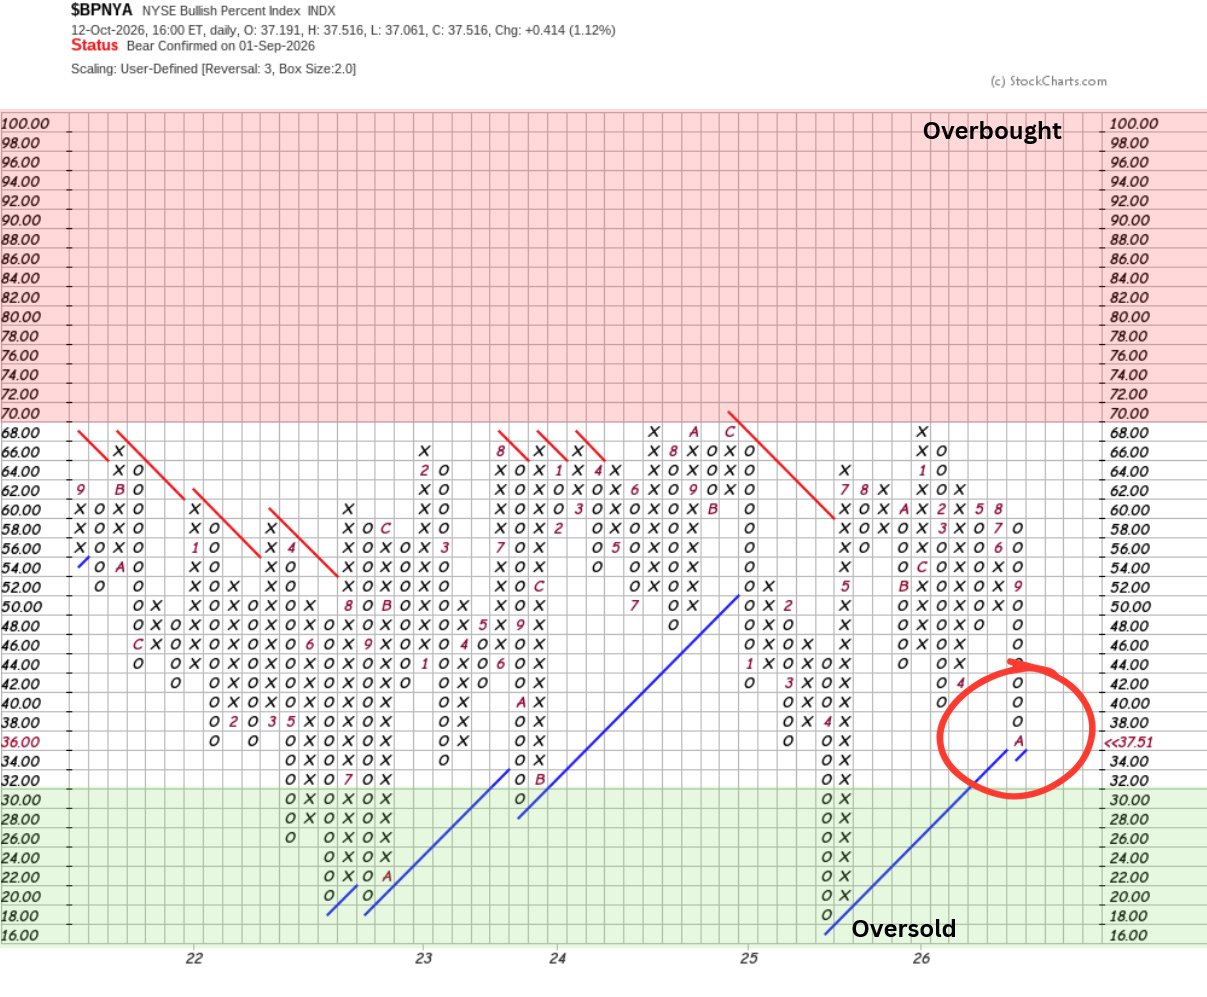
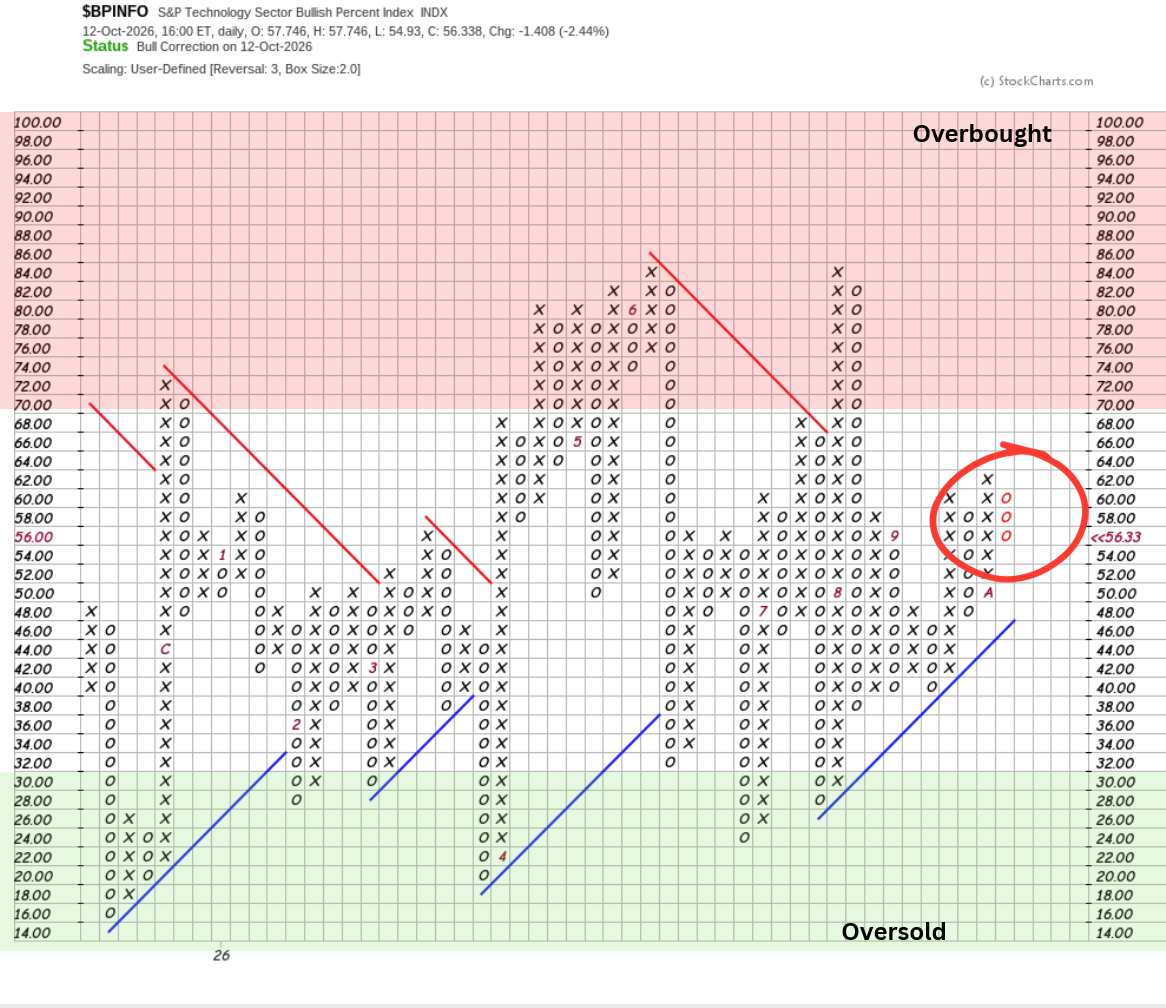
The Bullish Percent Indexes for the S&P 500, NYSE, and NASDAQ 100 are all declining.
The Bullish Percent Index (BPI) is a market breadth indicator that measures the percentage of stocks within an index or sector (like the S&P 500 or NYSE) that are currently on Point-and-Figure buy signals.
Developed by Abe Cohen in the mid-1950s, the BPI ranges from 0% to 100%. Instead of just tracking the price of an index, it gives us a look under the hood at the internal strength or weakness of the market.
(Think of a column of Xs as the offense—buyers—on the field, and a column of Os as the defense—sellers.)
Bullish Percent Index for S&P 500 Index:
Bullish Percent Index for NYSE-listed stocks:
Bullish Percent Index for NASDAQ-100:
Is This the Start of a Larger Decline?
In the rest of this report: what the long-term trend says about growth vs. value, the two events that could break this stalemate, and the semiconductor signal that would tell me investors are abandoning risk altogether.