
Nvidia's $120 Billion Year — And Why the Stock Dropped
Record earnings. Flat stock. What the market is really telling us about AI's $650 billion bet.

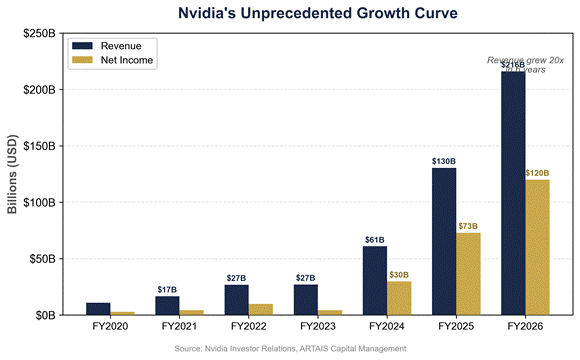
Three years ago, Nvidia posted $4.4 billion in annual profit. Last week, the company reported $120 billion. The stock dropped. When perfection can’t move the needle, it’s time to pay attention.
Let that number breathe for a moment.
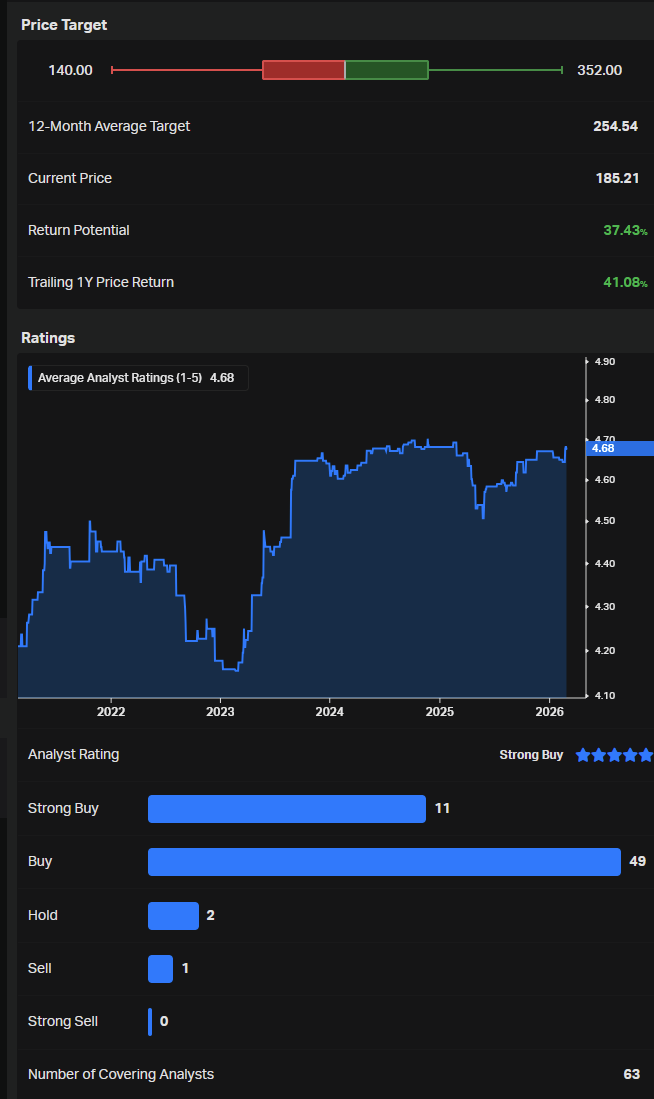
Nvidia delivered fourth-quarter revenue of $68.1 billion, crushing Wall Street’s $66.2 billion estimate. Net income hit $43 billion in a single quarter — more than Cisco Systems generated in annual revenue at the height of the dot-com bubble.
The company guided for $78 billion next quarter, blowing past the $72.8 billion consensus by a margin that would qualify as a rounding error at most companies.
Jensen Huang told analysts that “the agentic AI inflection point has arrived” and that customers are “racing to invest in AI compute.”
Every metric in the report screamed dominance: data center revenue surged 75% year-over-year to $62.3 billion — now a staggering 91.5% of total sales. Free cash flow hit $34.9 billion, up 125%.
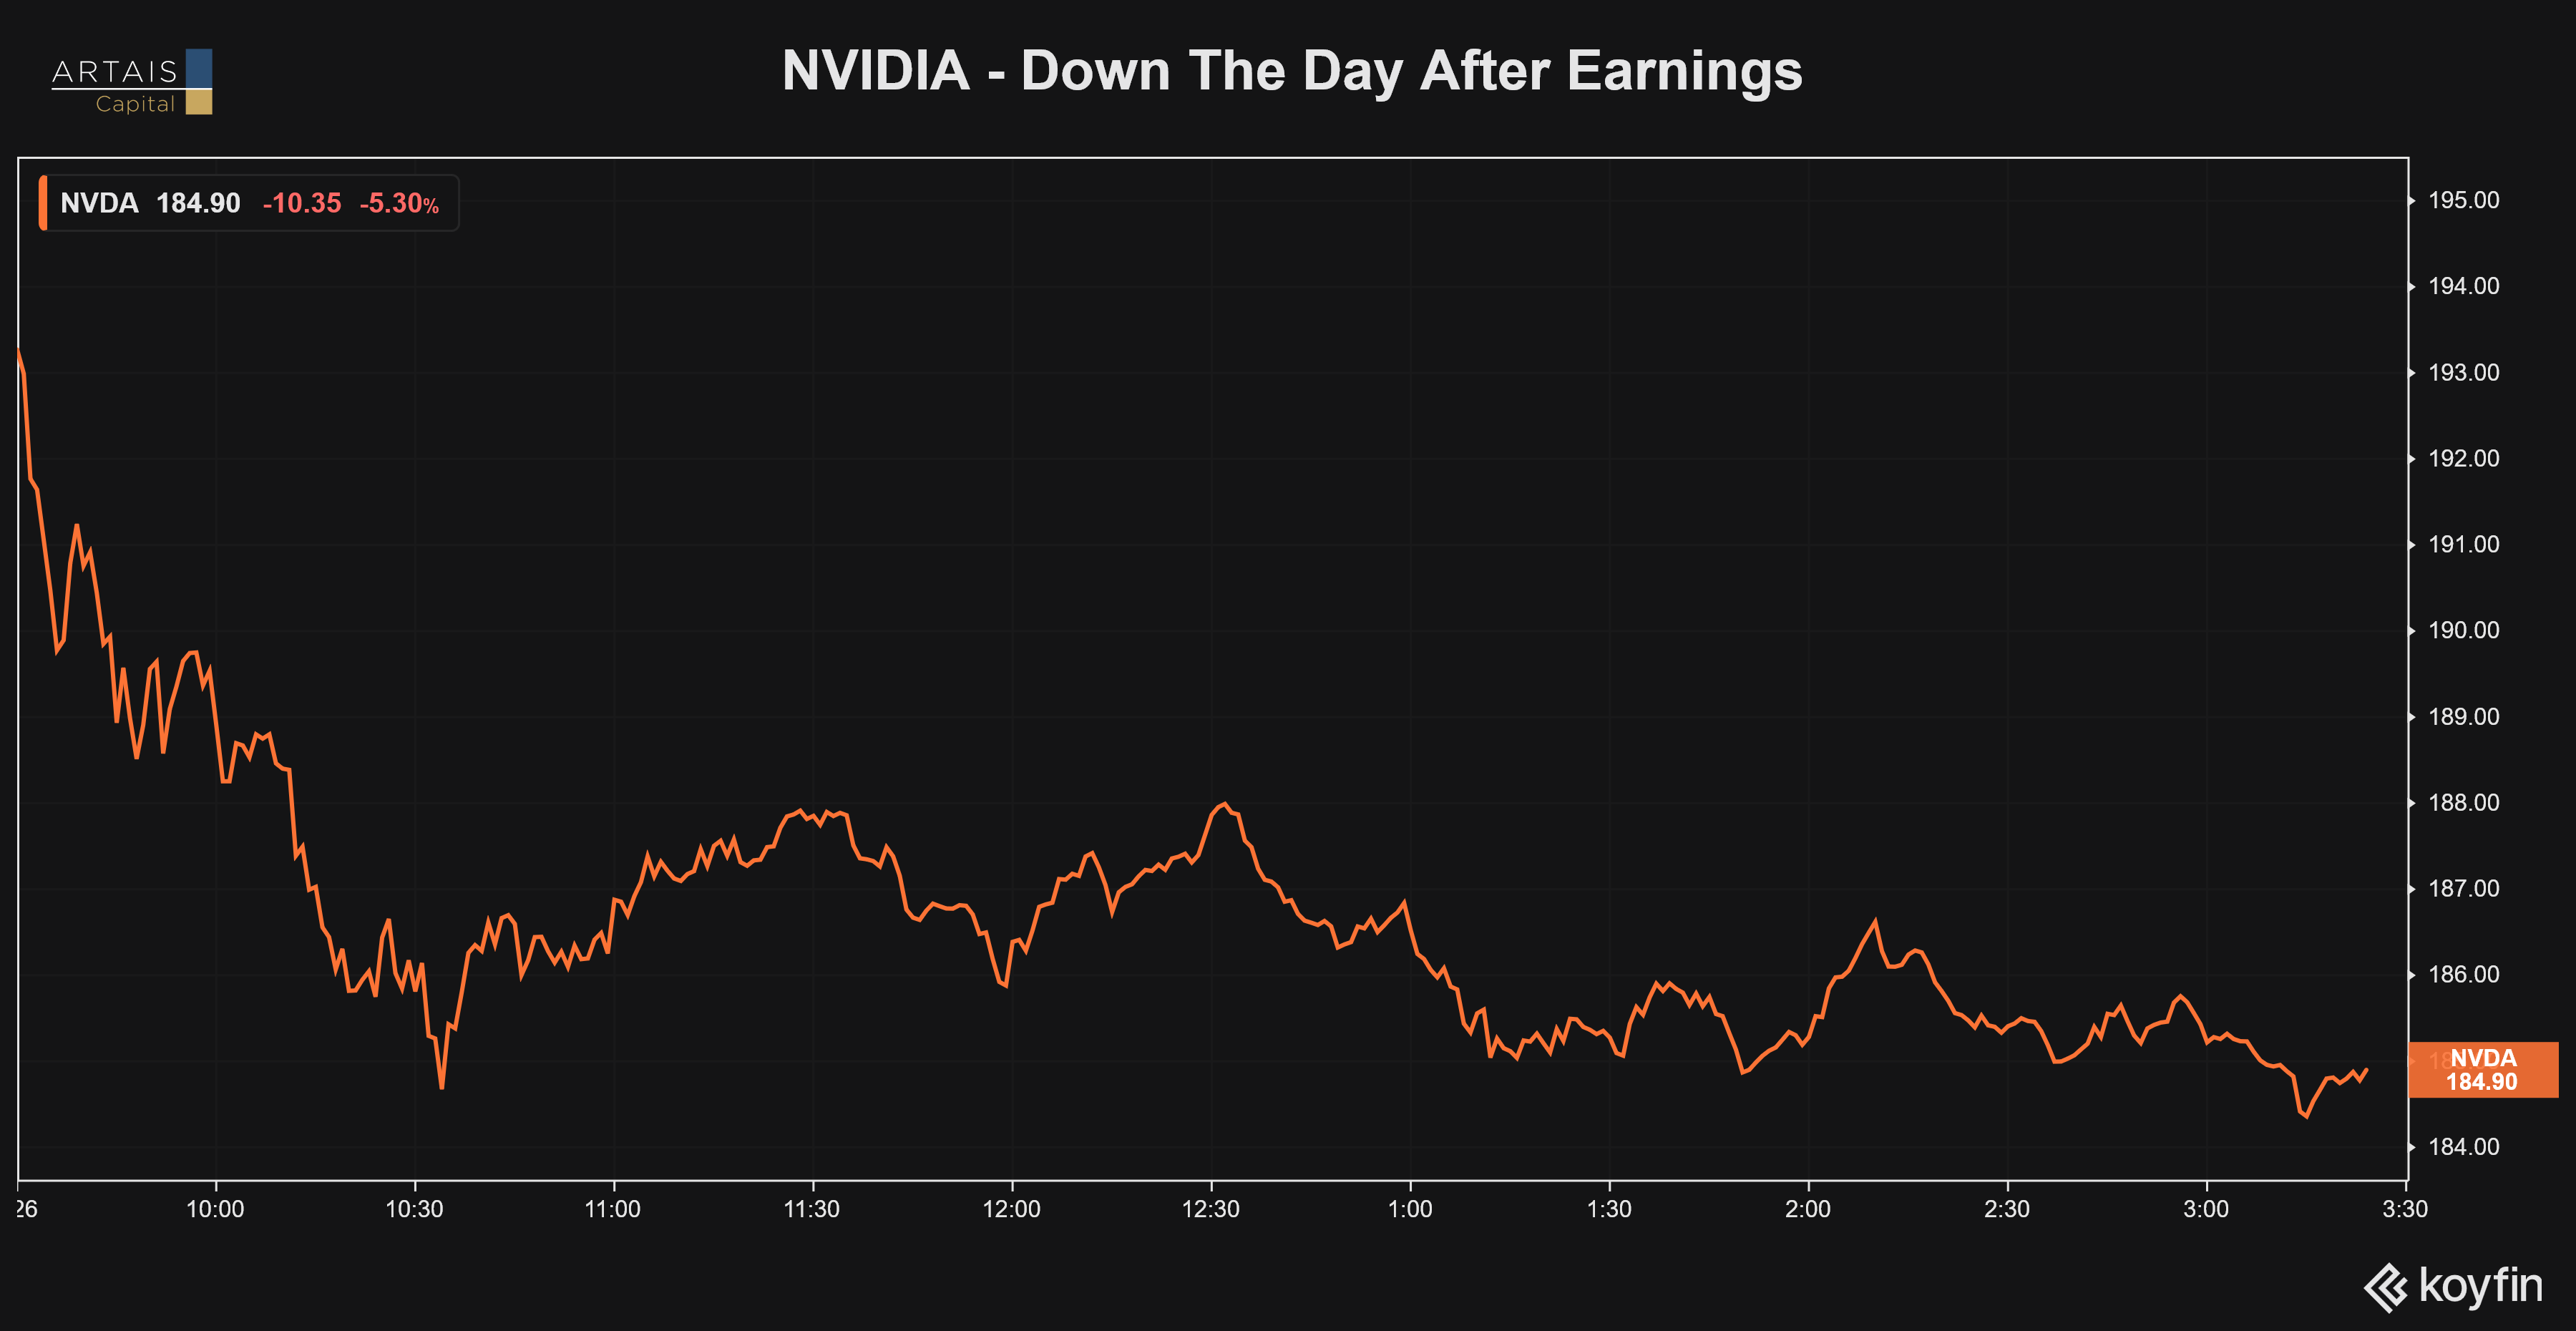
The market’s response? A yawn, a shrug, and a 4-5% decline the following day.
This is the single most important signal for investors to understand right now. Not because Nvidia’s business is failing — it clearly isn’t. But because the market’s inability to reward perfection tells you something critical about where we are in the cycle.
The $650 Billion Question
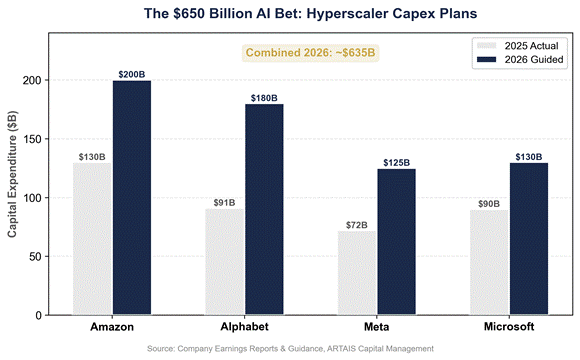
Nvidia’s fortune is directly tied to the biggest capital expenditure wave in corporate history. The four major hyperscalers — Google, Amazon, Microsoft, and Meta — have committed to spending approximately $650 billion on AI infrastructure in 2026, according to Bridgewater Associates.
Here’s what that looks like:
● Amazon: ~$200 billion (up ~55% from $130 billion in 2025)
● Alphabet: $175-185 billion (nearly double the $91 billion spent in 2025)
● Meta: $115-135 billion (up ~80% from $72 billion)
● Microsoft: An estimated $110-150 billion based on analyst extrapolations of quarterly run rates (up from ~$80-90 billion; Microsoft has not provided explicit full-year guidance)
That is real money from the most profitable companies on Earth. Jensen Huang’s mantra — “compute equals revenue” — is being tested at unprecedented scale.
But here’s the math that keeps skeptics awake at night:
Morgan Stanley estimates these hyperscalers will need to borrow approximately $400 billion in 2026, more than double the $165 billion they borrowed in 2025.
When the most profitable companies on Earth start borrowing at this pace to fund a single technology bet, the question stops being “is AI real?” and becomes “does the math work at this scale?”
Cisco’s Ghost
Every tech boom gets its historical parallel, and the most honest comparison isn’t comforting for Nvidia bulls — even though it should be reassuring on the surface.
At Cisco’s peak in March 2000, the company traded at extreme multiples — roughly 200 times trailing earnings according to the Financial Times — on approximately $18.9 billion in annual revenue.
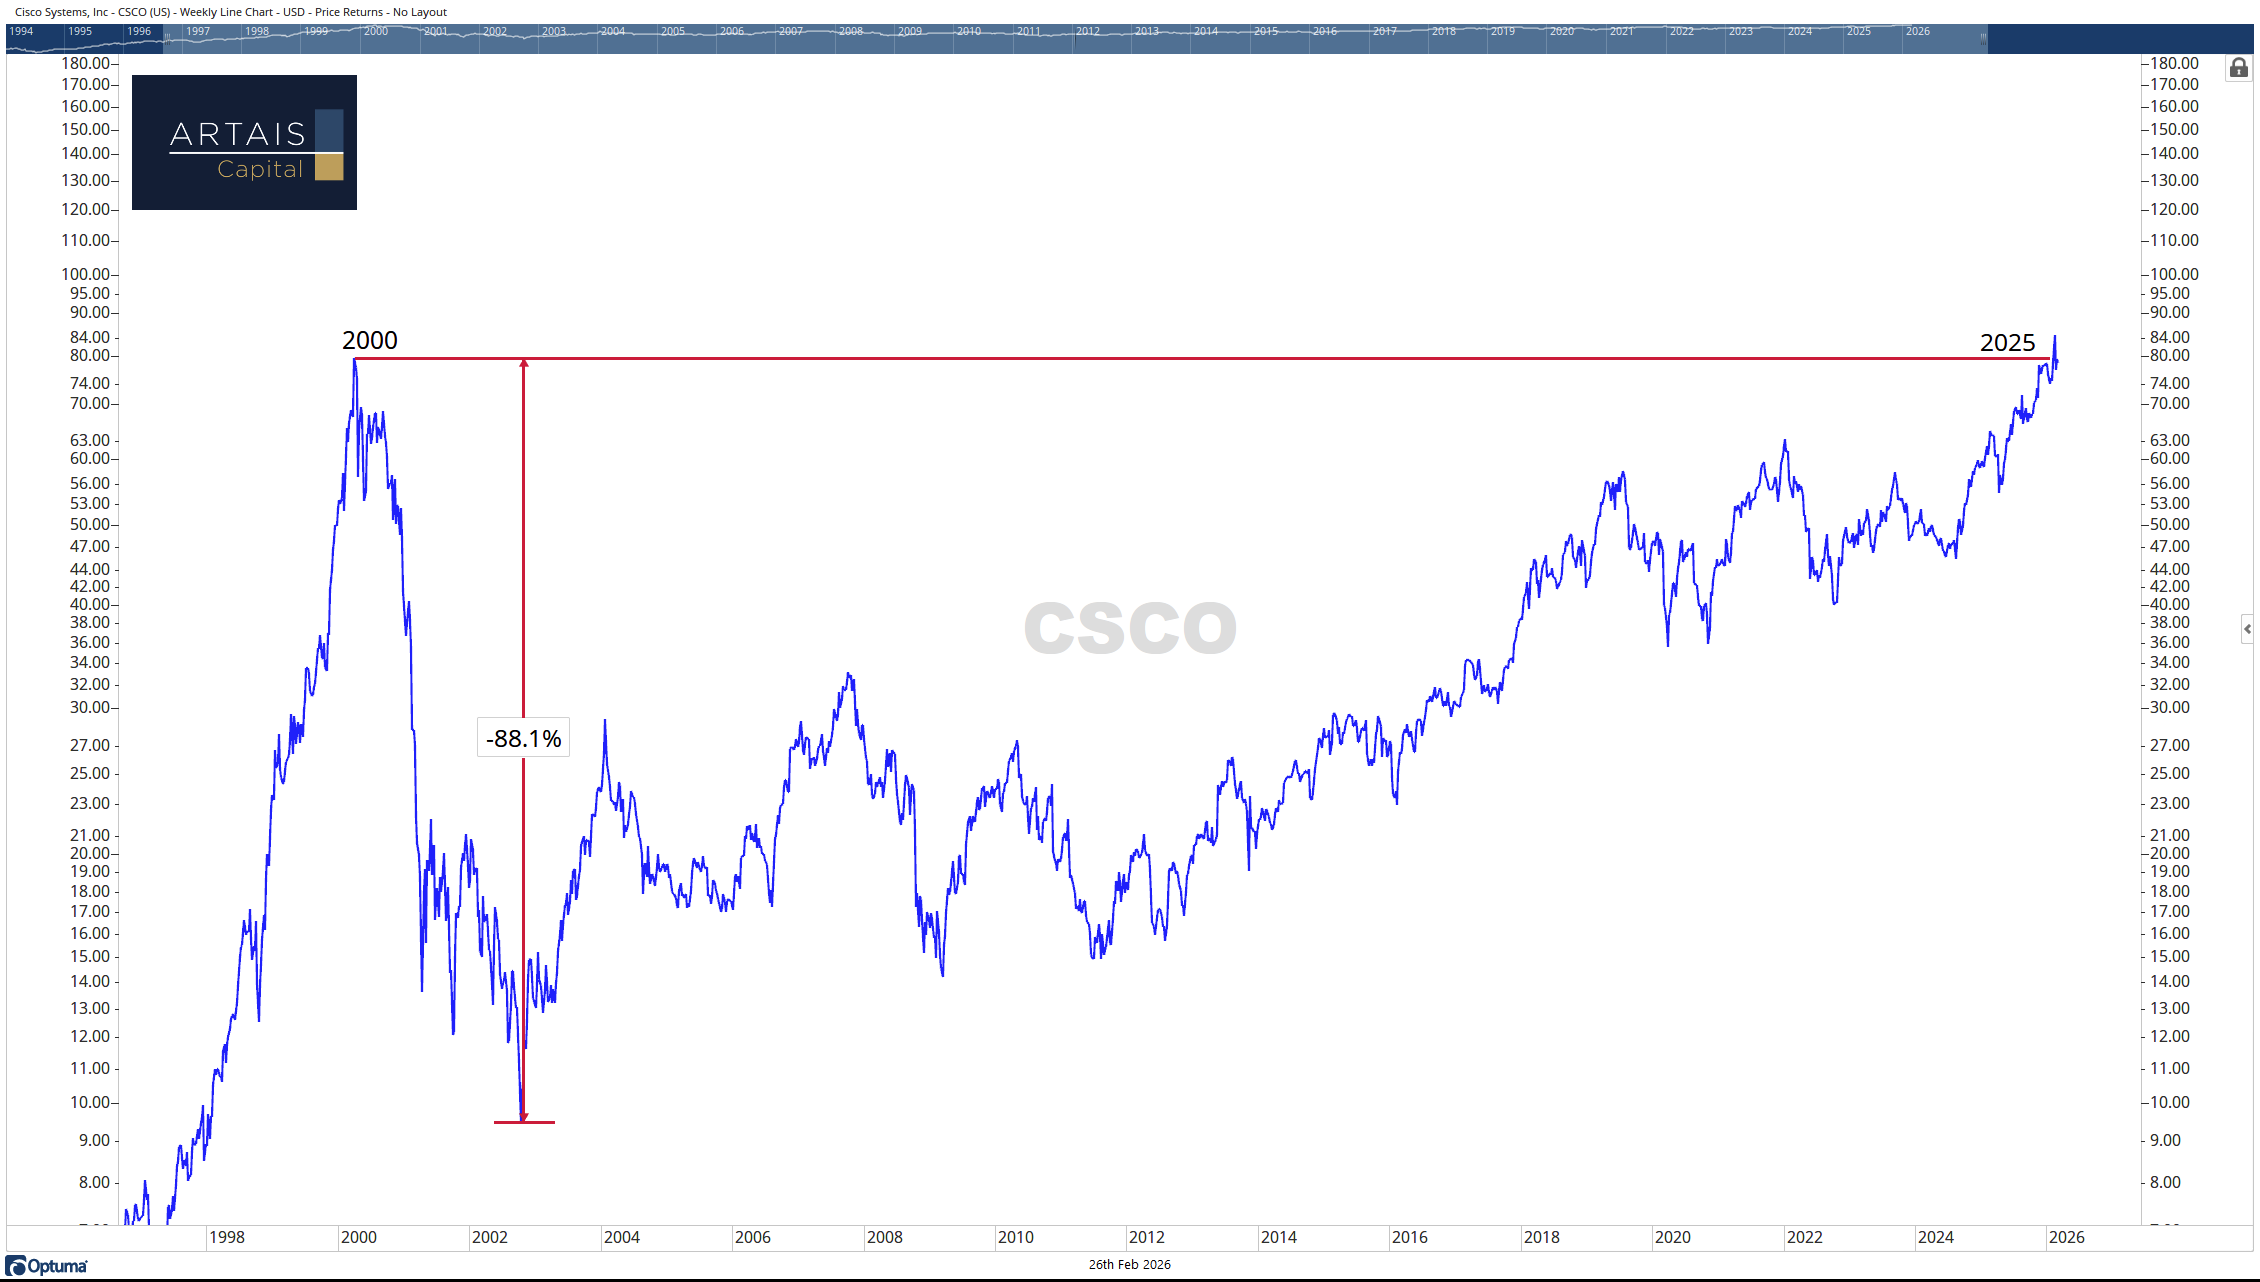
Its customers were dot-com startups burning venture capital. The stock fell 88% over the next two years and took 25 years to recover its all-time high — finally surpassing its March 2000 close in December 2025.
Nvidia’s situation is fundamentally different in several important ways:
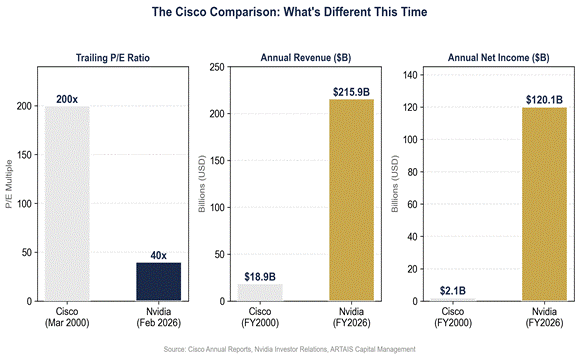
● Valuation: Nvidia trades at approximately 47 times trailing earnings, versus Cisco’s roughly 200x. The forward P/E — based on FY2027 analyst consensus estimates of approximately $7.46-$7.74 per share — sits around 25-26x, meaningfully below Nvidia’s own 5-year average P/E of 65x.
● Earnings quality: Nvidia generated $120 billion in real net income. Cisco’s annual profit never exceeded $2.1 billion. Nvidia’s single-quarter profit exceeds Cisco’s peak annual revenue.
● Customer quality: Cisco sold to dot-com startups that evaporated. Nvidia sells to Apple, Microsoft, Google, Amazon, and Meta — companies with over $200 billion in combined free cash flow.
So no, this is not a valuation bubble in the traditional sense. The P/E multiples are elevated but not absurd. The earnings are real. The customers are solvent.
But dismissing the comparison entirely misses the more subtle danger.
The Capacity Bubble
The risk with Nvidia isn’t that the stock price is “fake” the way Cisco’s was. The risk is that demand may be temporary.
Sequoia Capital’s David Cahn framed it as “AI’s $600 Billion Question” — the gap between what’s being spent on AI infrastructure and the actual revenue being generated by AI applications.
Research from MIT found that approximately 95% of companies see no measurable financial return from current generative AI deployments.
The hyperscalers insist capacity is being absorbed as fast as they can deploy it. And that may be true — today. But enterprise CIO surveys from Morgan Stanley indicate only 3.8% growth in software budgets for 2026, suggesting the companies buying AI capacity might not be scaling spending as fast as the companies building it.
Source: Koyfin
This is what I’d call a “capacity bubble” — not a valuation bubble. Nvidia’s earnings are real, but they’re dependent on customers continuing to pour capital into infrastructure at a rate that may or may not be sustainable.
Goldman Sachs argues AI capex at 0.8% of GDP remains well below the 1.5%+ peaks seen during prior technology investment cycles — like the late-1990s telecom buildout — suggesting room to run. But Goldman also noted that capital spending of this magnitude has never been concentrated in so few companies.
The Concentration Problem
This brings us to the elephant in the room for index investors.
The Magnificent Seven now represent approximately 34% of the S&P 500’s market capitalization, according to Motley Fool research as of early February 2026.
That’s above the 27% concentration peak during the dot-com bubble, per RBC Wealth Management data. The top 10 stocks account for roughly 39% of the index.
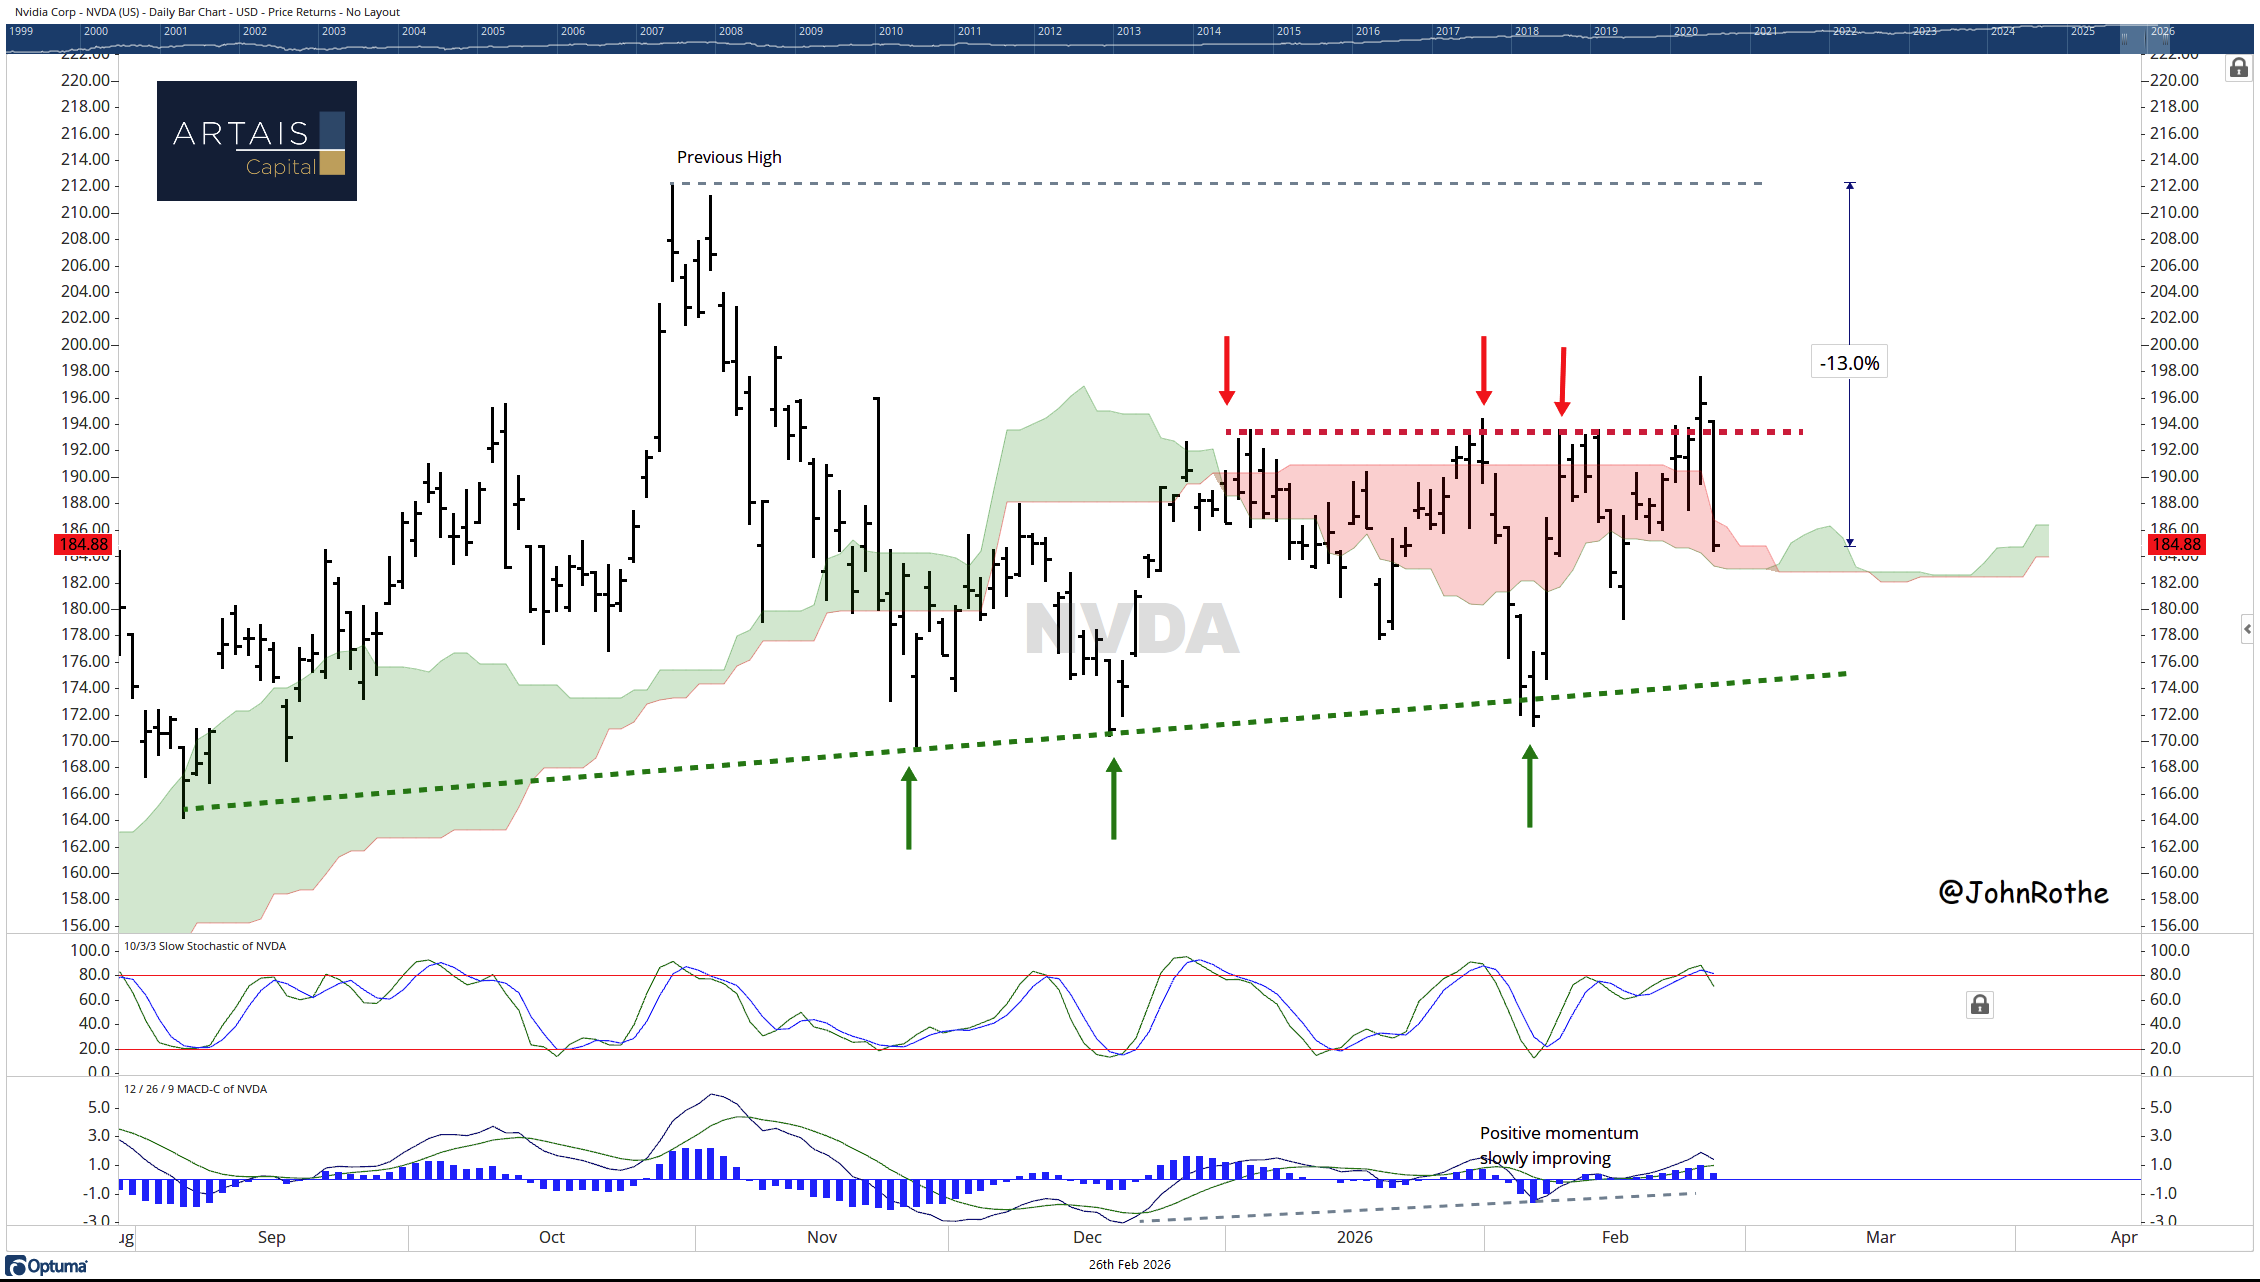
Nvidia contines to struggle in 2026 and is still approx 13% below its 2025 high.
Nvidia alone is approximately 7.3% of the S&P 500 — one company’s quarterly earnings report effectively moving the direction of the entire market. When Nvidia dropped 4-5% the day after earnings, it dragged the Nasdaq lower with it.
For investors in passive index funds — which now represent the majority of equity market flows — you are making a concentrated bet on AI infrastructure spending whether you realize it or not.
Buying the S&P 500 means roughly a third of your money goes to seven companies, most of which are either building AI infrastructure or selling it.
What a Rules-Based Investor Should Watch
The market’s reaction to Nvidia’s earnings tells a familiar story to students of market cycles: when expectations get so high that perfection isn’t enough, you’re in the late innings.
That doesn’t mean the top is in. Bull markets routinely climb walls of worry, and Nvidia’s actual business metrics remain extraordinary. A forward P/E of roughly 25x for a company growing earnings around 58% annually is not expensive by traditional growth metrics.
But momentum-based investors should be watching three signals:
1. Earnings revision trajectory. When analyst estimates stop rising — even if earnings keep beating — the momentum trade weakens. Nvidia’s guidance beat was massive ($78 billion versus $72.8 billion consensus), which buys time. But the bar keeps rising.
2. Hyperscaler free cash flow deterioration. If Amazon’s free cash flow turns materially negative and Alphabet’s drops as Pivotal Research projects, watch for any language shift on earnings calls about “optimizing” or “rationalizing” AI spend. That’s the euphemism for cutting budgets.
3. Breadth vs. concentration. The healthiest markets are broad markets. When the S&P 500’s direction is determined by a handful of stocks, the index becomes fragile. Watch the equal-weight S&P 500 versus the cap-weighted version — divergence between the two is a warning sign.
The Skeptic’s Corner
To be fair to the bull case: every mega-trend in technology history faced the same “spending too much, returns unclear” skepticism at scale.
Amazon’s AWS was called a money pit before it became the most profitable business in tech.
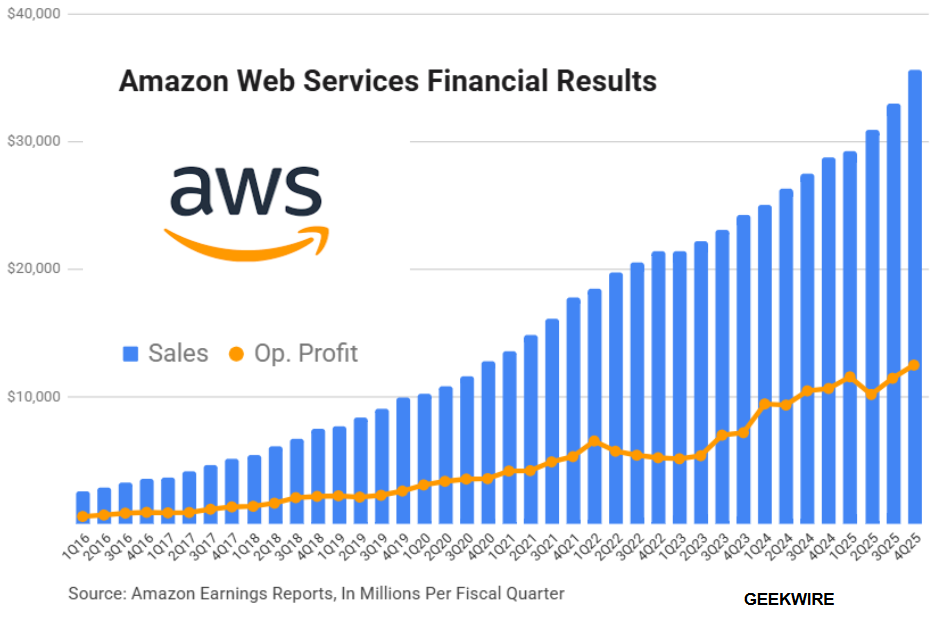
Source: Amazon, GeekWire
The internet was “over-hyped” in 1998 — and it was, in the short term — but the long-term skeptics missed a generational shift.
The difference this time is the scale and speed of commitment. $650 billion in a single year from four companies is not a measured bet. It’s an arms race.
Arms races tend to produce winners, but they also produce spectacular waste — and the companies funding this race are doing so with borrowed money.
What This Means for Your Portfolio
Nvidia’s earnings report was perfect. The stock went down. That’s not a market failure — it’s a market telling you that perfection is already priced in.
For tactical investors, this isn’t a sell signal — it’s a caution signal. The momentum remains strong. The earnings are real. But the margin of safety has evaporated.
When $120 billion in profit isn’t enough to excite the market, the risk-reward has shifted.
The right question isn’t whether AI is real. It is.
The right question is whether $650 billion in annual infrastructure spending is sustainable, and what happens to the most concentrated stock market in history if it isn’t.
John Rothe, CMT
Founder, Portfolio Manager
ARTAIS Capital Management

Disclaimer
ARTAIS Capital Management, LLC (“ARTAIS Capital”) is a registered investment advisor offering advisory services in registered states and in other jurisdictions where exempt. Registration does not imply a certain level of skill or training.
The author and/or ARTAIS Capital clients may be long NVDA stock.
The information on this site is not intended as tax, accounting or legal advice, as an offer or solicitation of an offer to buy or sell, or as an endorsement of any company, security, fund, or other securities or non-securities offering. This information should not be relied upon as the sole factor in an investment making decision.
Past performance is no indication of future results. Investment in securities involves significant risk and has the potential for partial or complete loss of funds invested. It should not be assumed that any recommendations made will be profitable or equal any performance noted on this site.
The information on this site is provided “AS IS” and without warranties of any kind either express or implied. To the fullest extent permissible pursuant to applicable laws, ARTAIS Capital Management, LLC disclaims all warranties, express or implied, including, but not limited to, implied warranties of merchantability, non-infringement, and suitability for a particular purpose.
For more information about ARTAIS Capital Management, LLC, including our Form ADV, please visit the SEC’s Investment Adviser Public Disclosure website at www.adviserinfo.sec.gov or contact us directly.