Issue No. 7 · Tuesday · July 7, 2026
What’s Inside:
At a Glance - A “weight of the evidence” look at the current market environment, as well as my Regime map.
The Call - A deeper dive into what I am seeing
Under the Hood - Current market internals, sector breadth, and intermarket analysis.
Sector Watch - Which sectors pass/fail the screening process.
Current Screen - Which stocks pass the screening process.
What I Am Watching - Stocks I am watching that are approaching a passing grade in the screening process. Plus, what changed from last week.
At a Glance
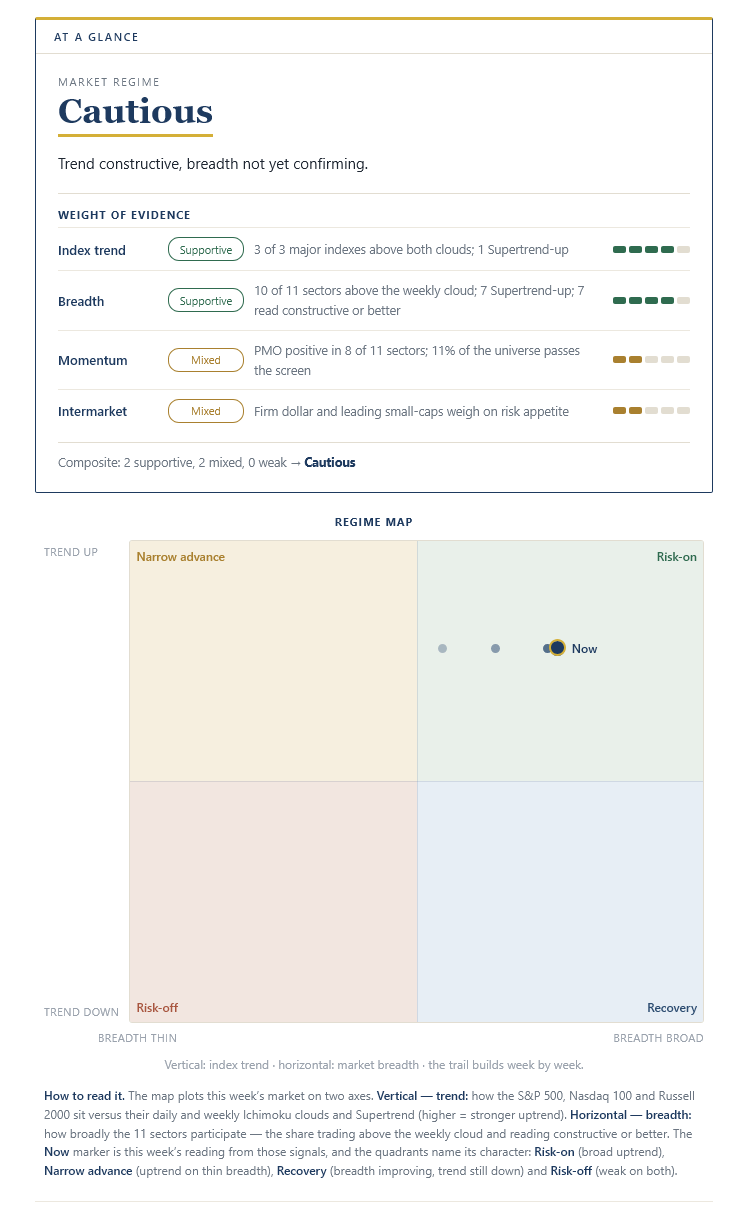
Market regime: Cautious
The Call
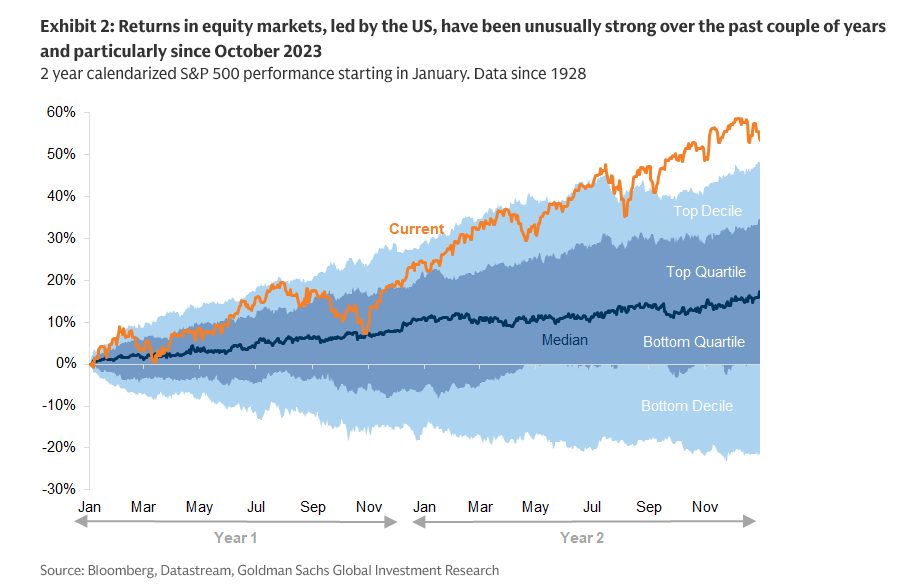
Is the market starting to regress back to its mean?
The concentration into tech names, especially AI leadership names, is at (in my opinion) ridiculously high levels.
Does this mean it’s time to pack up and go home?
Not necessarily. These overconcentrations can take years to resolve.
The 90’s Tech Boom
I remember in the late 1990s, I was at Morgan Stanley, and there were so many pundits and analysts arguing back and forth about the tech bubble we were in.
The arguments were the same as today: “The valuations are too high and don’t support future growth” vs “The internet is new technology and will change the world. This time is different”.
Sound familiar?
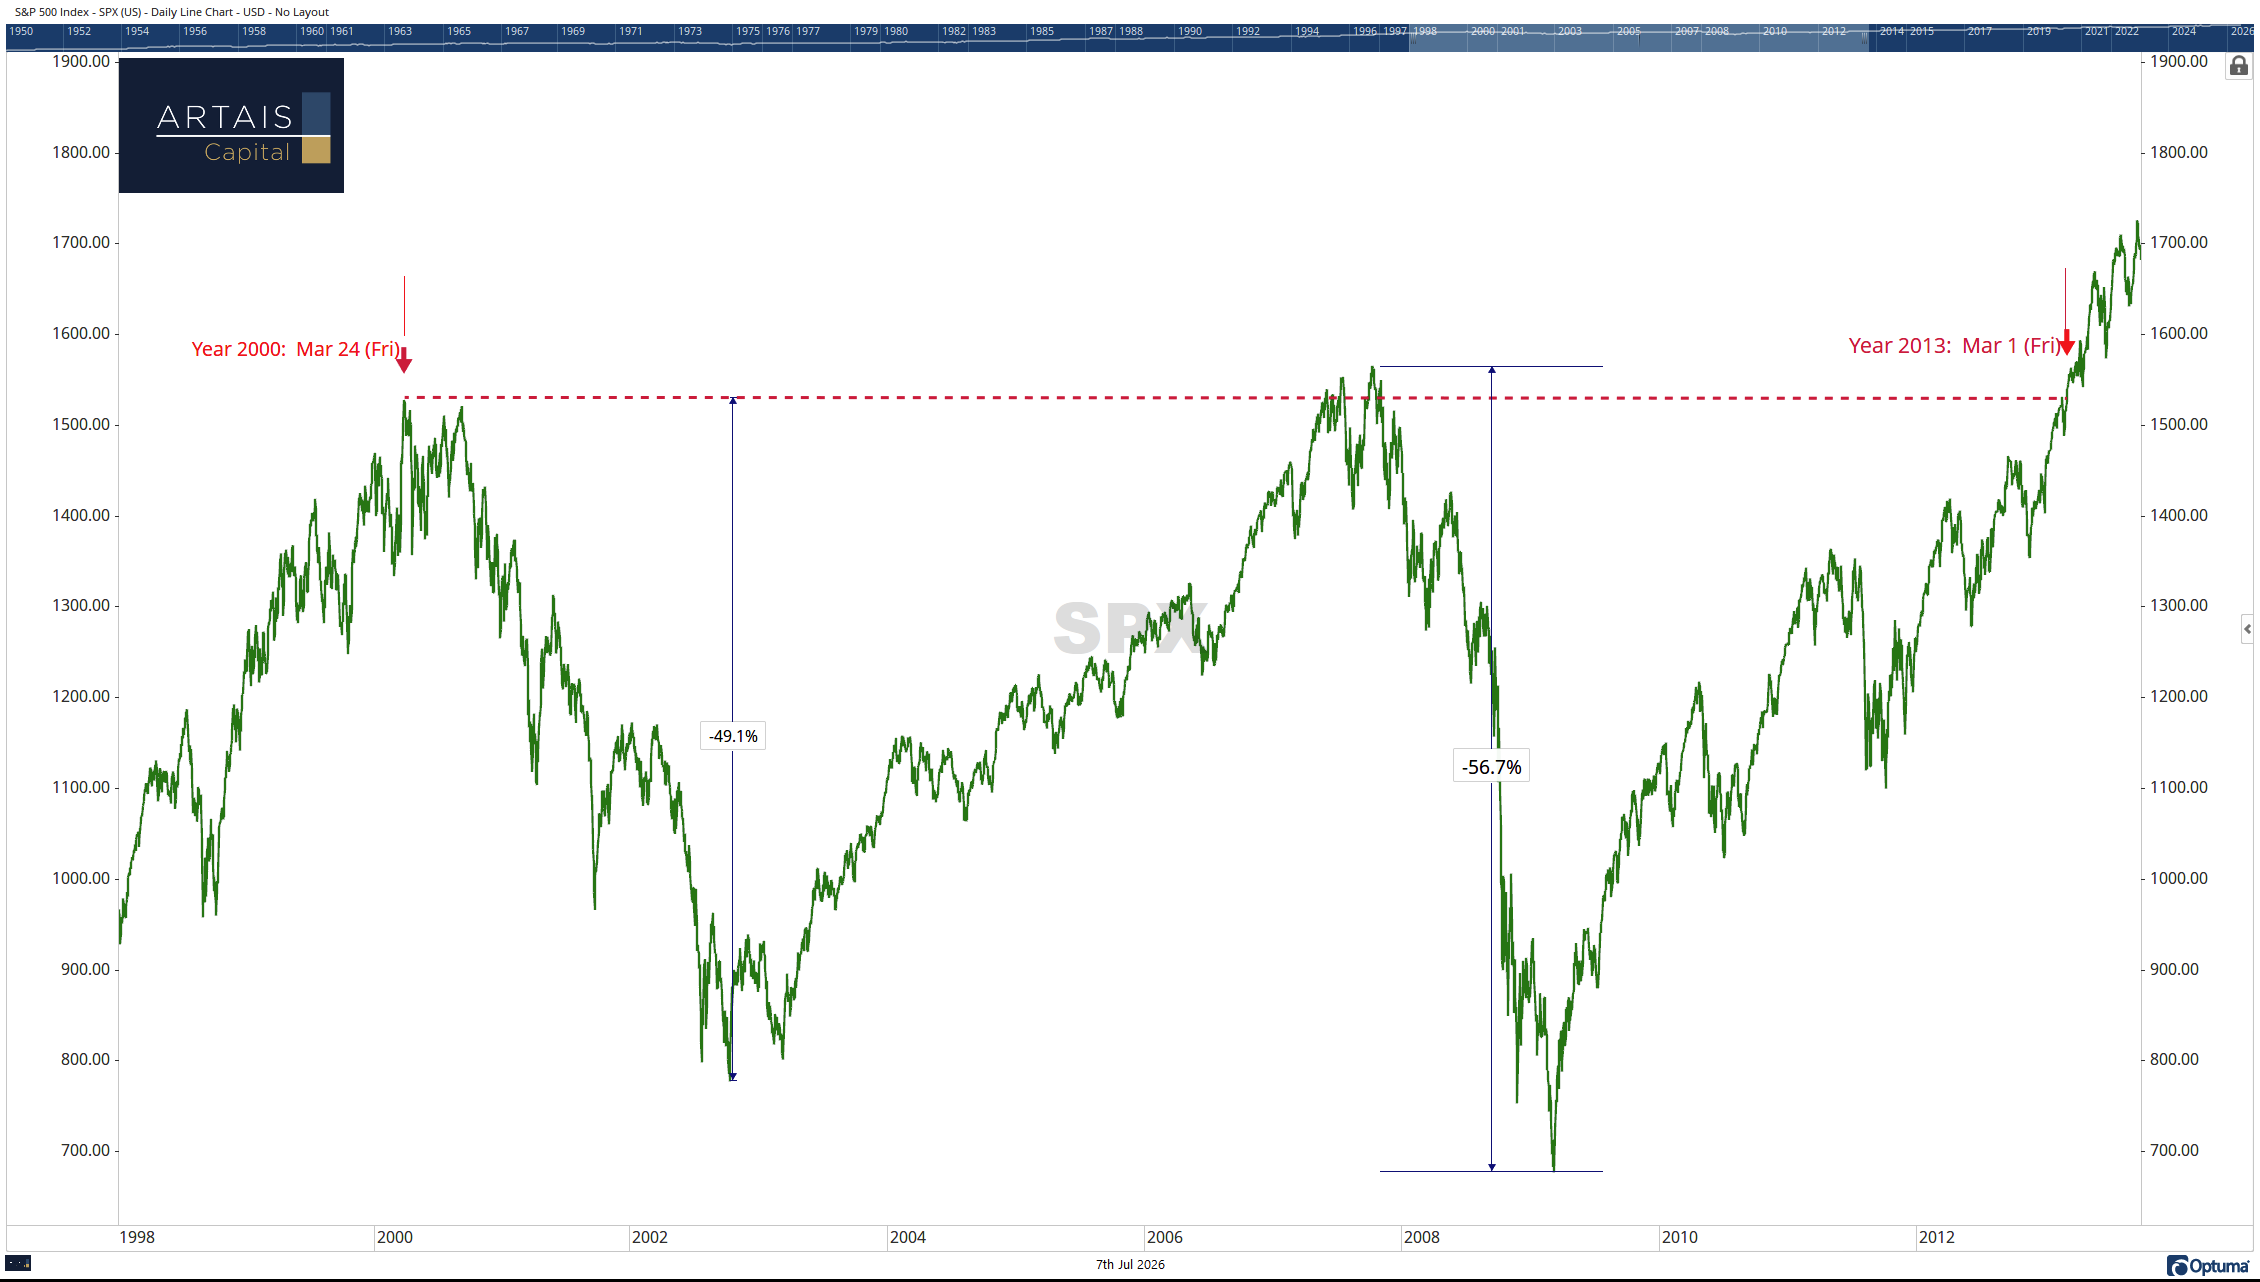
I heard a lot of these arguments in 1998, two years before NASDAQ peaked (which then took 15 years to recover). I think we are somewhere in this timeline now with AI tech.
(Current ARTAIS clients, please reach out to me for a free paid subscription)
However, timing the top is next to impossible since major market tops (and the crash that follows) are usually based on emotions and not logic.
Post Tech Boom: 2000-2013
After the tech boom, the period between 2000 and 2013 was a brutal sideways market that included 2 major declines of -49% and -56%.
EDIT: (apologies - for some reason Substack didn’t save my final version and instead published a draft. Below are the correct paragraphs):
Part of the reason for this period was simple math: the index spent over a decade working off the valuation extreme in its biggest names. In March 2000, large-cap tech traded at valuations that assumed a decade of perfect growth.
For the most part, the growth did show up. The stock returns didn’t, however, because the price had already been paid.
But here’s what a lot of people forget about those years. Underneath that sideways S&P 500, leadership rotated into the unloved parts of the market: Financials. Energy. Materials. Industrials.
The cheap, boring, cyclical stuff that had been priced for irrelevance in 1999. Technology’s weighting in the S&P 500 Index fell from roughly 38% at the 1999 peak to about 14% by the end of 2002, while Energy and Materials grew to a combined weight of roughly 20% by 2008.
One thing I want to be careful about, because I’ve seen this history told wrong: the internet infrastructure buildout was not where capital rotated to after the crash. It was the epicenter of the crash itself.
The fiber was laid during the mania — telecom capital spending peaked in 1999-2000 — and when the bubble broke, the infrastructure builders were the worst casualties.
WorldCom and Global Crossing went bankrupt. Cisco, the “picks-and-shovels” darling of that cycle, needed a quarter century to reclaim its March 2000 high — it finally did so in December 2025, and only because it found a second act selling AI infrastructure.
Yet, the internet kept growing; the companies that spent years building the infrastructure had already spent tomorrow’s demand on yesterday’s stock price. (Keep that thought — I’ll come back to why this cycle’s infrastructure may be different.)
Is the Rotation Away from Tech Starting?
I bring this up now, as there are some signs that the sector weightings in the S&P 500 are starting to move away from Tech.
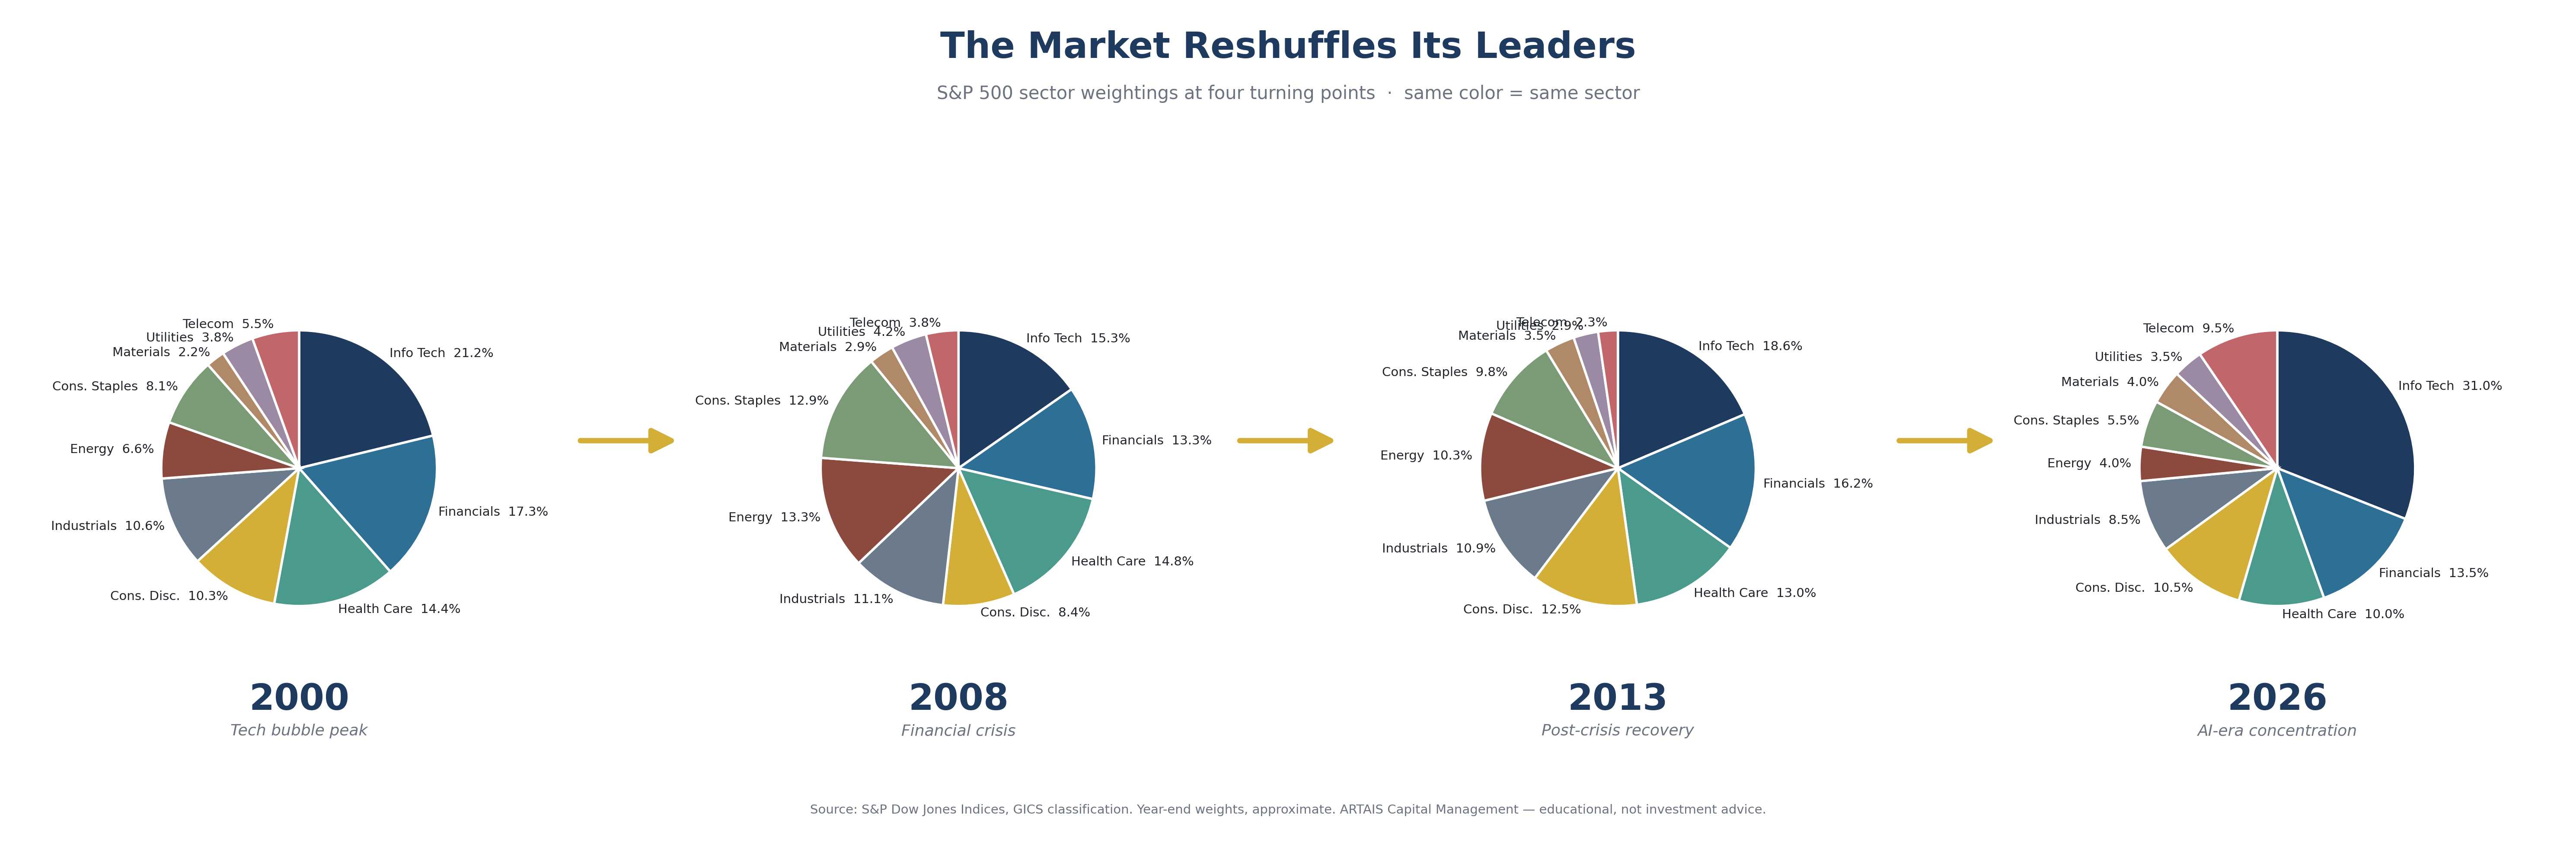
Value areas of the market have been outperforming their growth counterparts this year.
While one of the reasons (similar to 2000-2013) is simply because there are better and more realistic valuations in areas like Energy, Industrials, and Materials. But I believe the real driver is still AI growth.
So, while I believe we are in a bubble, I don’t believe we are about to pop the bubble. There is still the need for infrastructure to be built out to accommodate AI growth, as an industry.
Instead, it looks like the market is starting to broaden by rotating away from the names that have helped drive up the S&P 500 Index to its current levels:
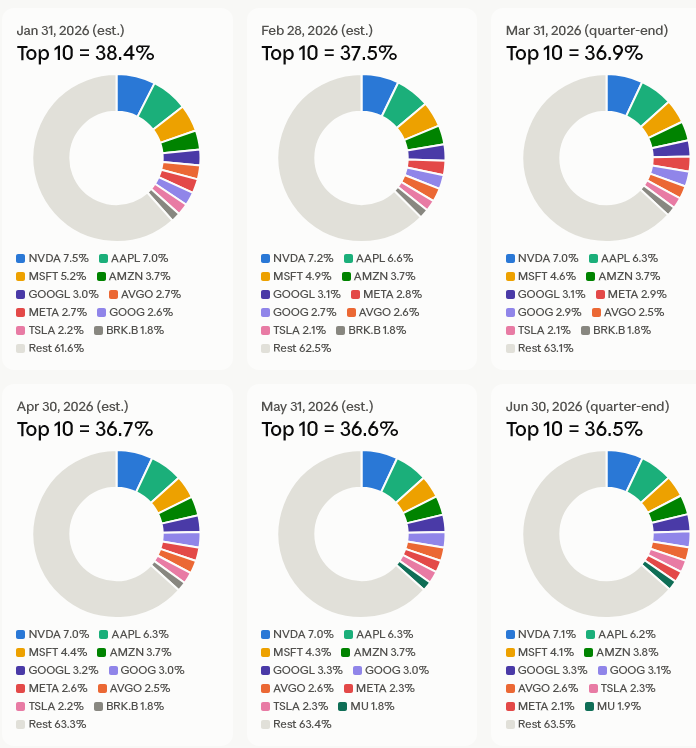
The largest 10 names (by weighting) in the S&P 500 are changing and are starting to lessen their impact on the index. Source: S&P Global, ARTAIS Capital
This rotation can be observed by looking at the Relative Rotation Graph of the individual sectors within the S&P 500 Index:
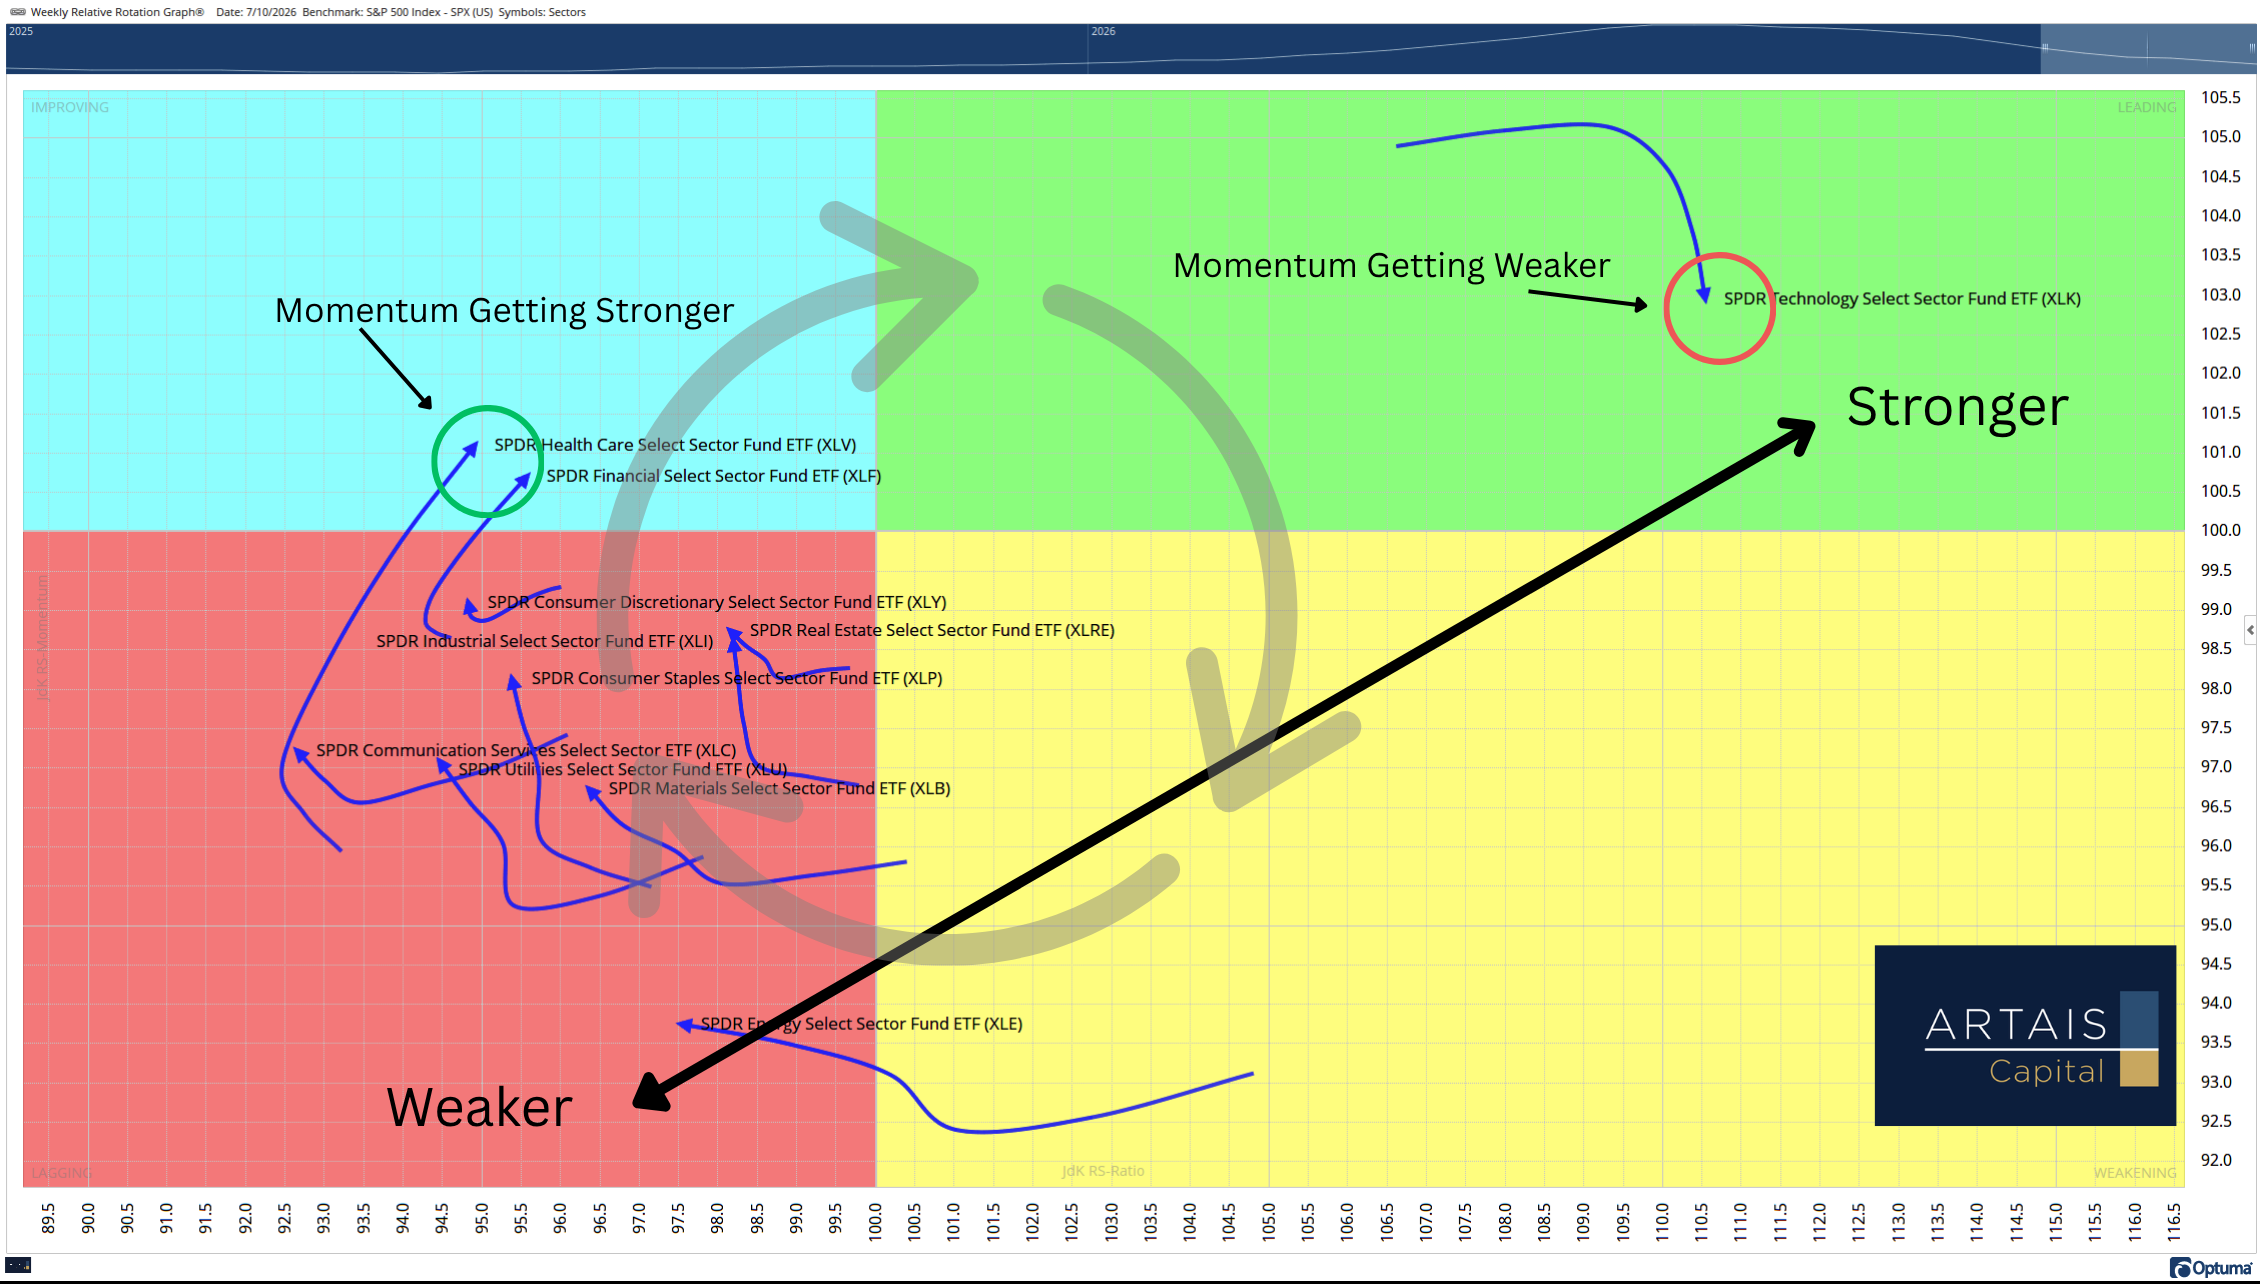
Relative Rotation Graphs tend to rotate in a clockwise manner. Technology is starting to lose positive momentum, while Health Care and Financials are improving.
The Next Opportunity for Investors
What this means to investors is that the easy money has been made.
Fans of “just buy the index and hold on” may be disappointed in the returns of the S&P 500 Index over the next decade, as sectors like Energy, Materials, and Utilities - key components of AI infrastructure and comprising only a small part of the index itself - outperform.
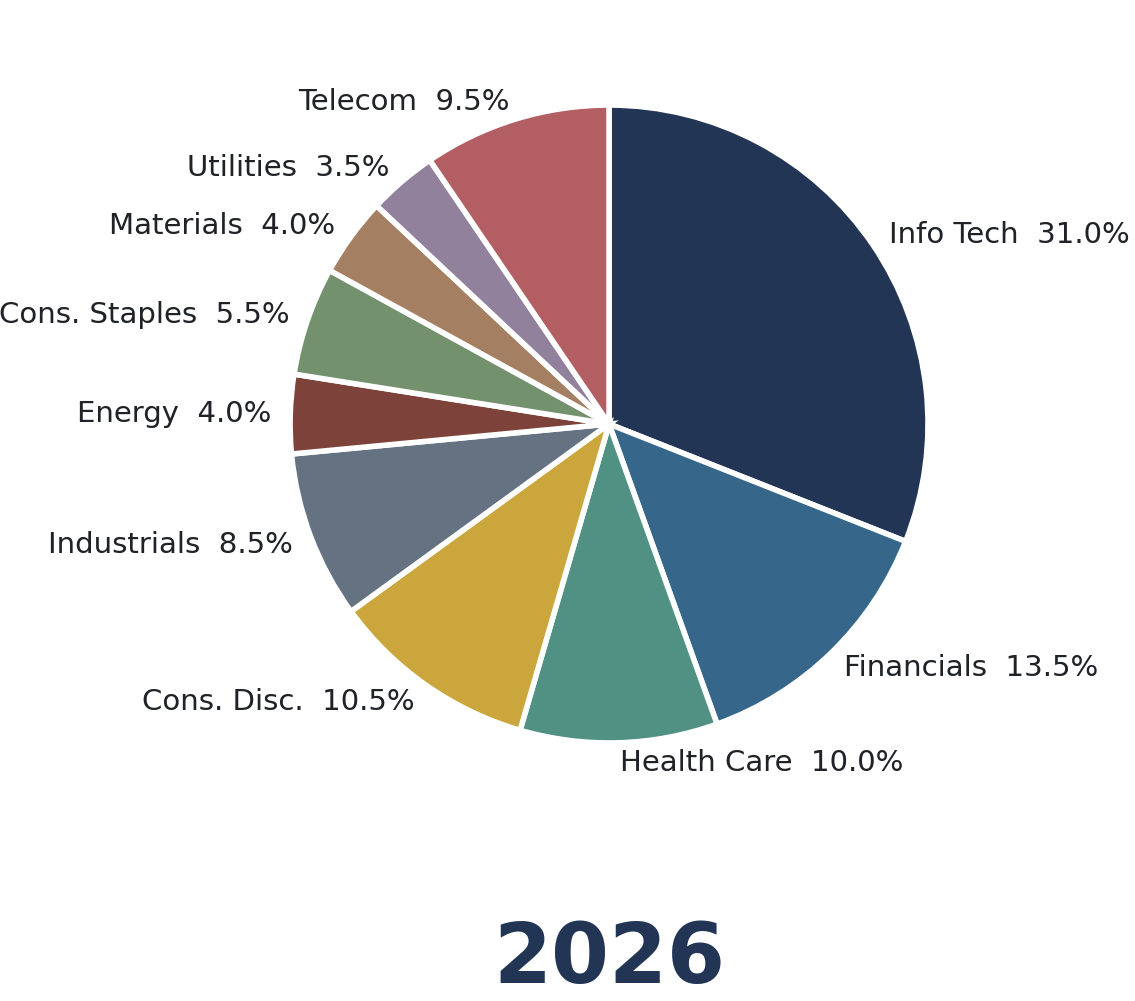
A move away from the crowded Tech sector into sectors that benefit from infrastructure growth may negatively impact the performance of the S&P 500 Index.
A second disappointment for the pure S&P 500 Index holders is that a lot of the companies that are becoming involved in the growth of AI infrastructure are not large-cap names, so they are not even represented in the index itself.
Plus, small and mid-caps as a factor have mostly been ignored. As a result, they don’t share the same extreme valuations as some of their large-cap counterparts.
During the period after the tech boom of the 90s, small and mid-caps outperformed large caps:
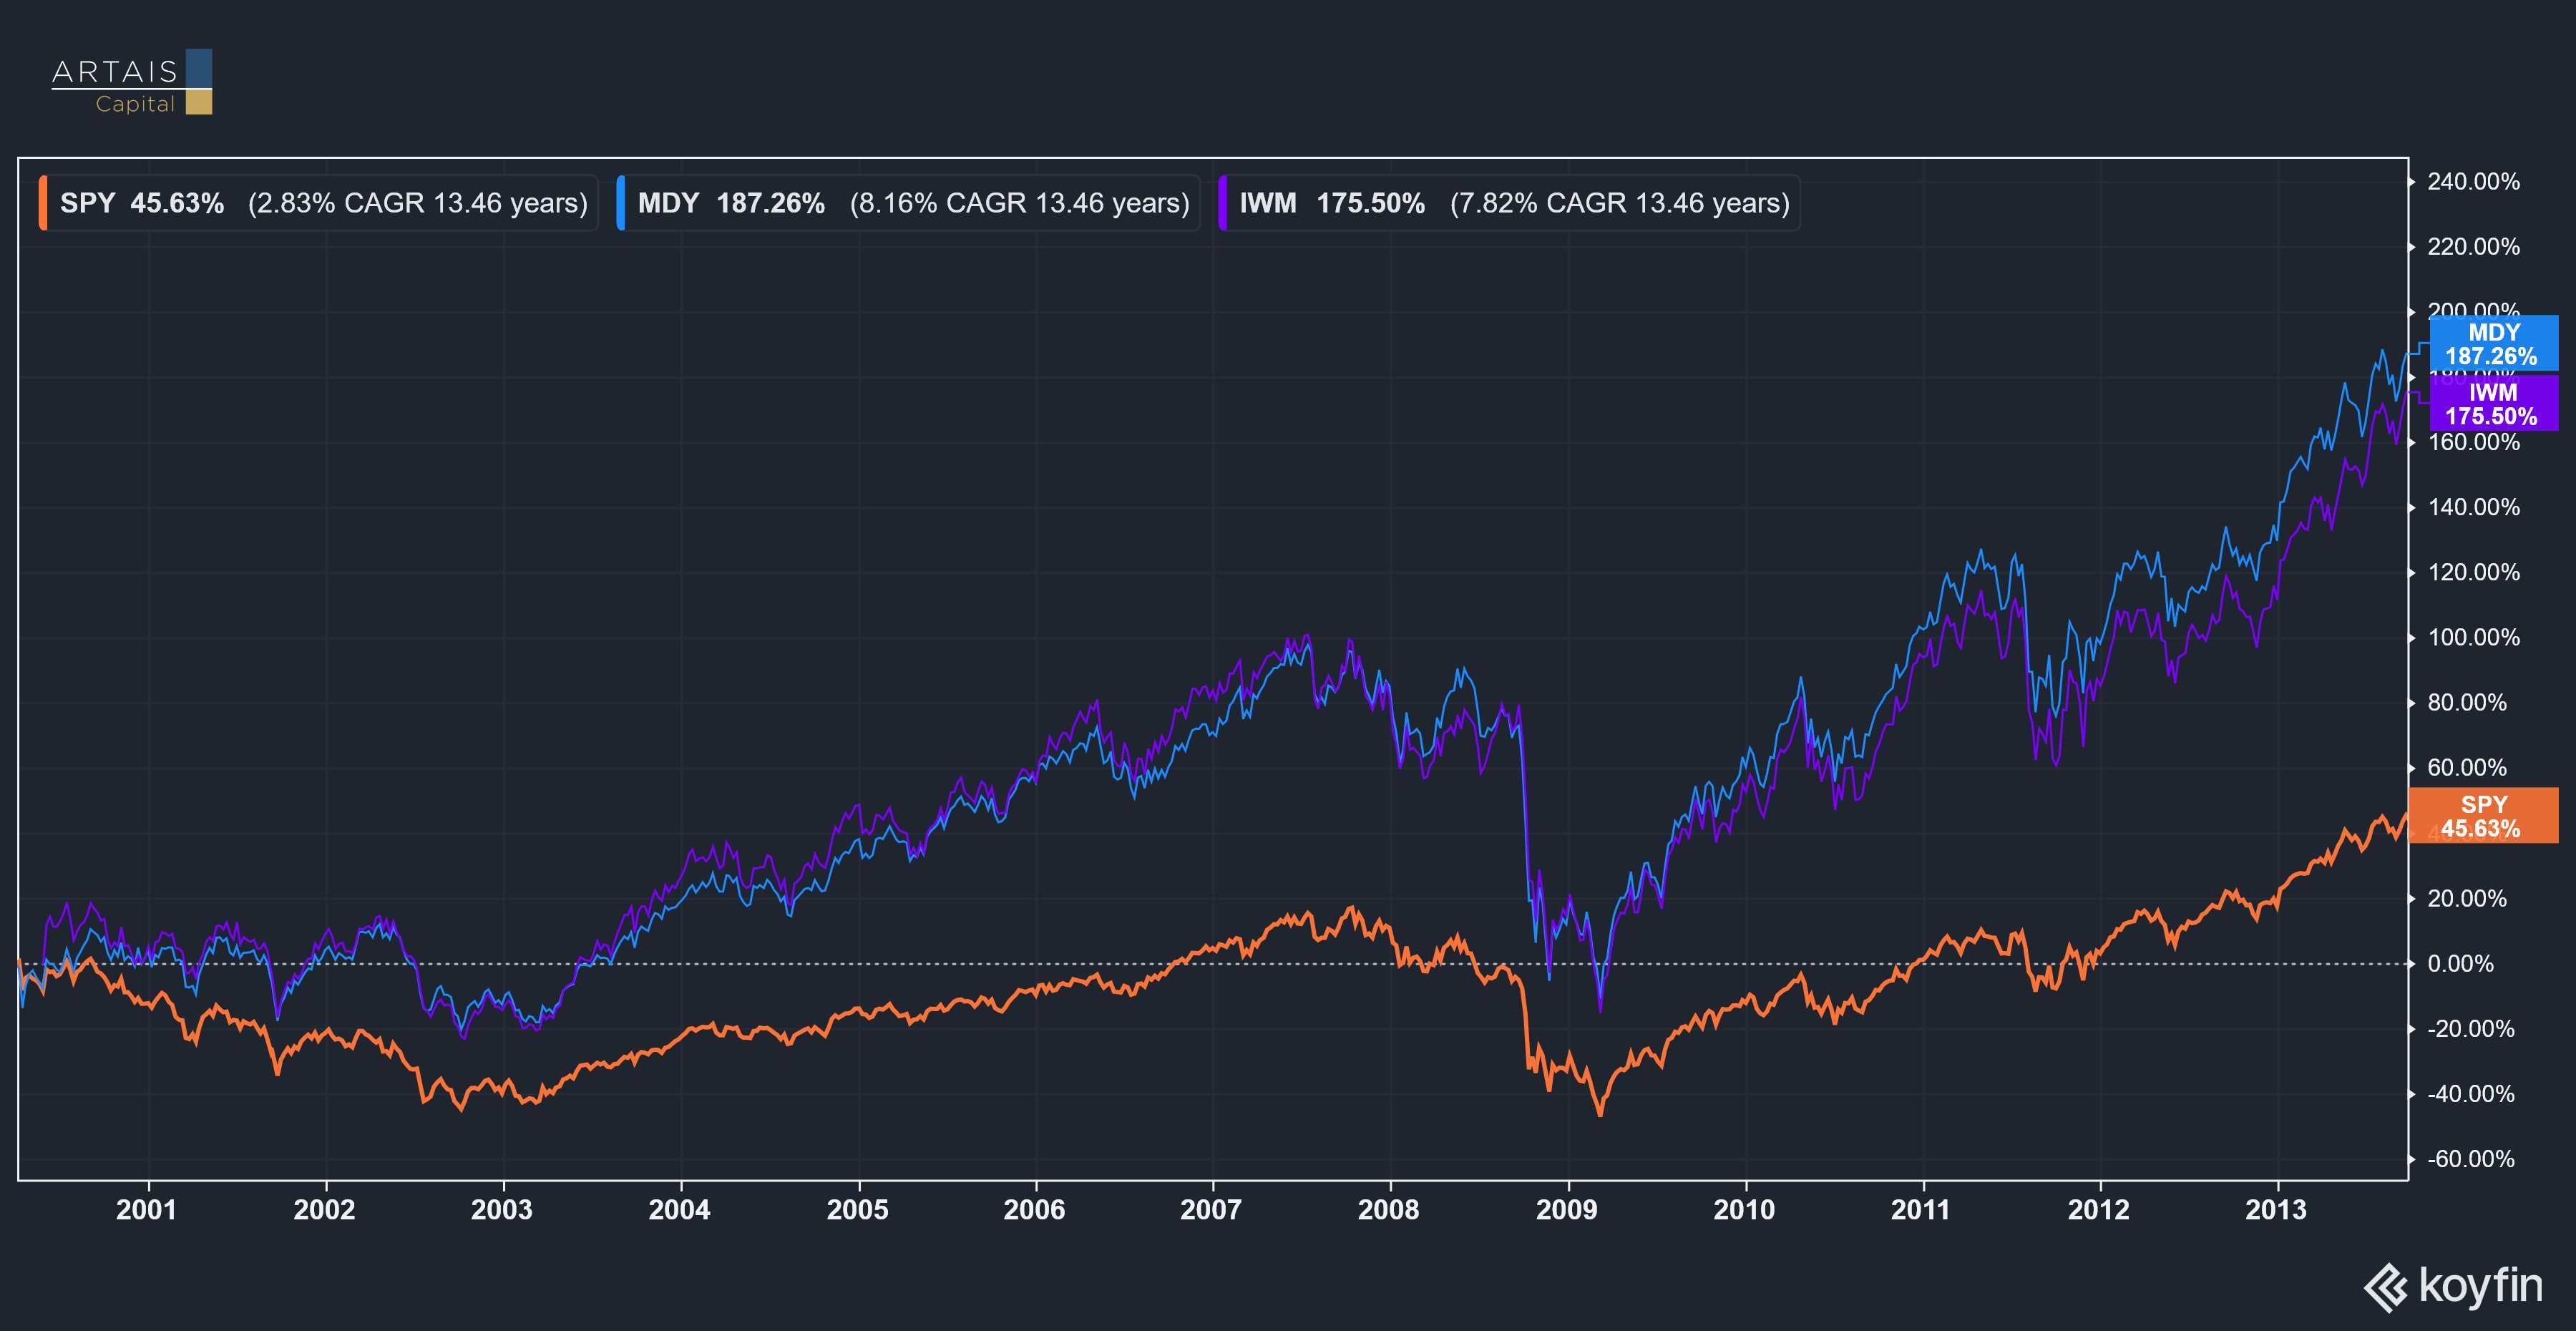
Many of the companies positioned for the physical buildout, like electrical equipment, grid components, specialty industrials, power producers, are small and mid-sized companies that aren't even in the S&P 500. During the last great rotation, that's exactly where the outperformance lived.
The takeaway from this is that investors who use actively managed strategies may have an opportunity for outperformance if the markets follow a similar pattern to what we saw post 2000.
The Next Space Race?
While the cost of AI is declining, the price of capacity is rising:
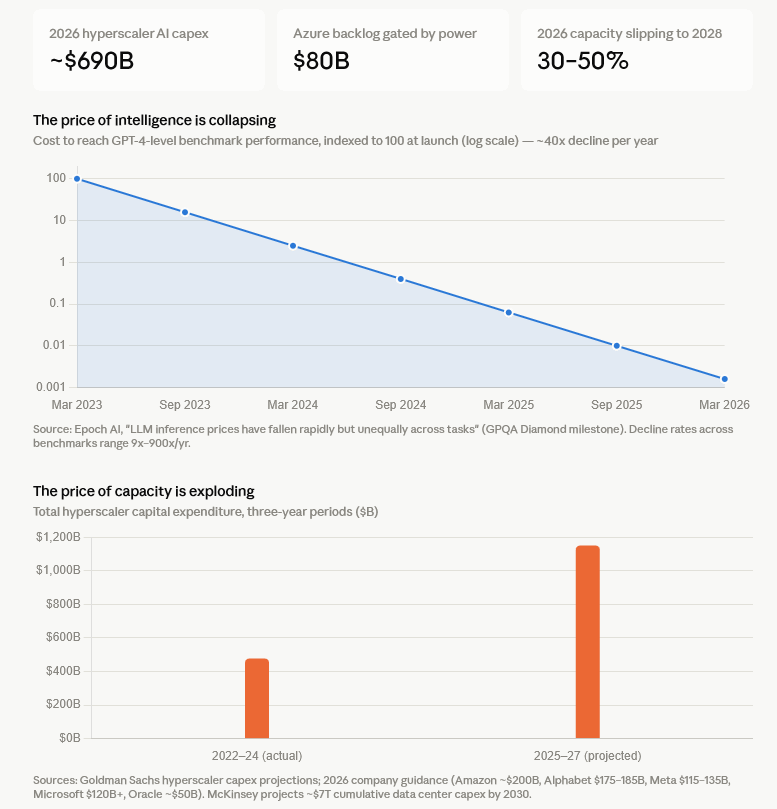
I see a big opportunity, especially if AI becomes the new “Space Race”.
Once the US government decides we need to win the AI race and begins to fast-track and aggressively fund infrastructure build-out, we may see conservative value companies in sectors like Utilities, Materials, and Industrials become fast-growing growth companies - and possibly tomorrow’s leadership names.
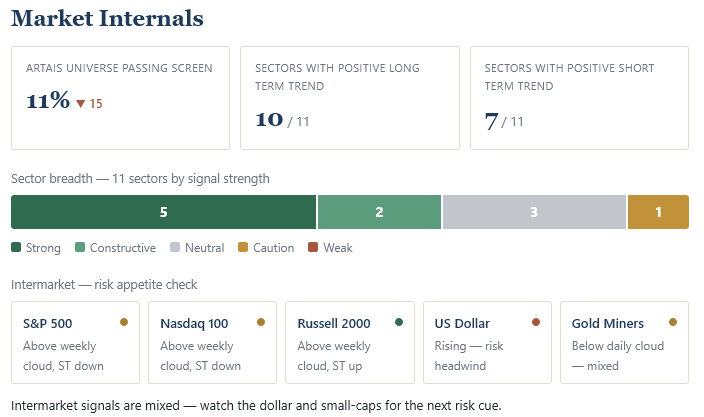
Under The Hood