

Yesterday, I mentioned on Substack and X that momentum in the Communications sector is improving:

If we zoom in on the chart, we can see that the Communications sector has been stuck in a sideways trading pattern since late September of last year.
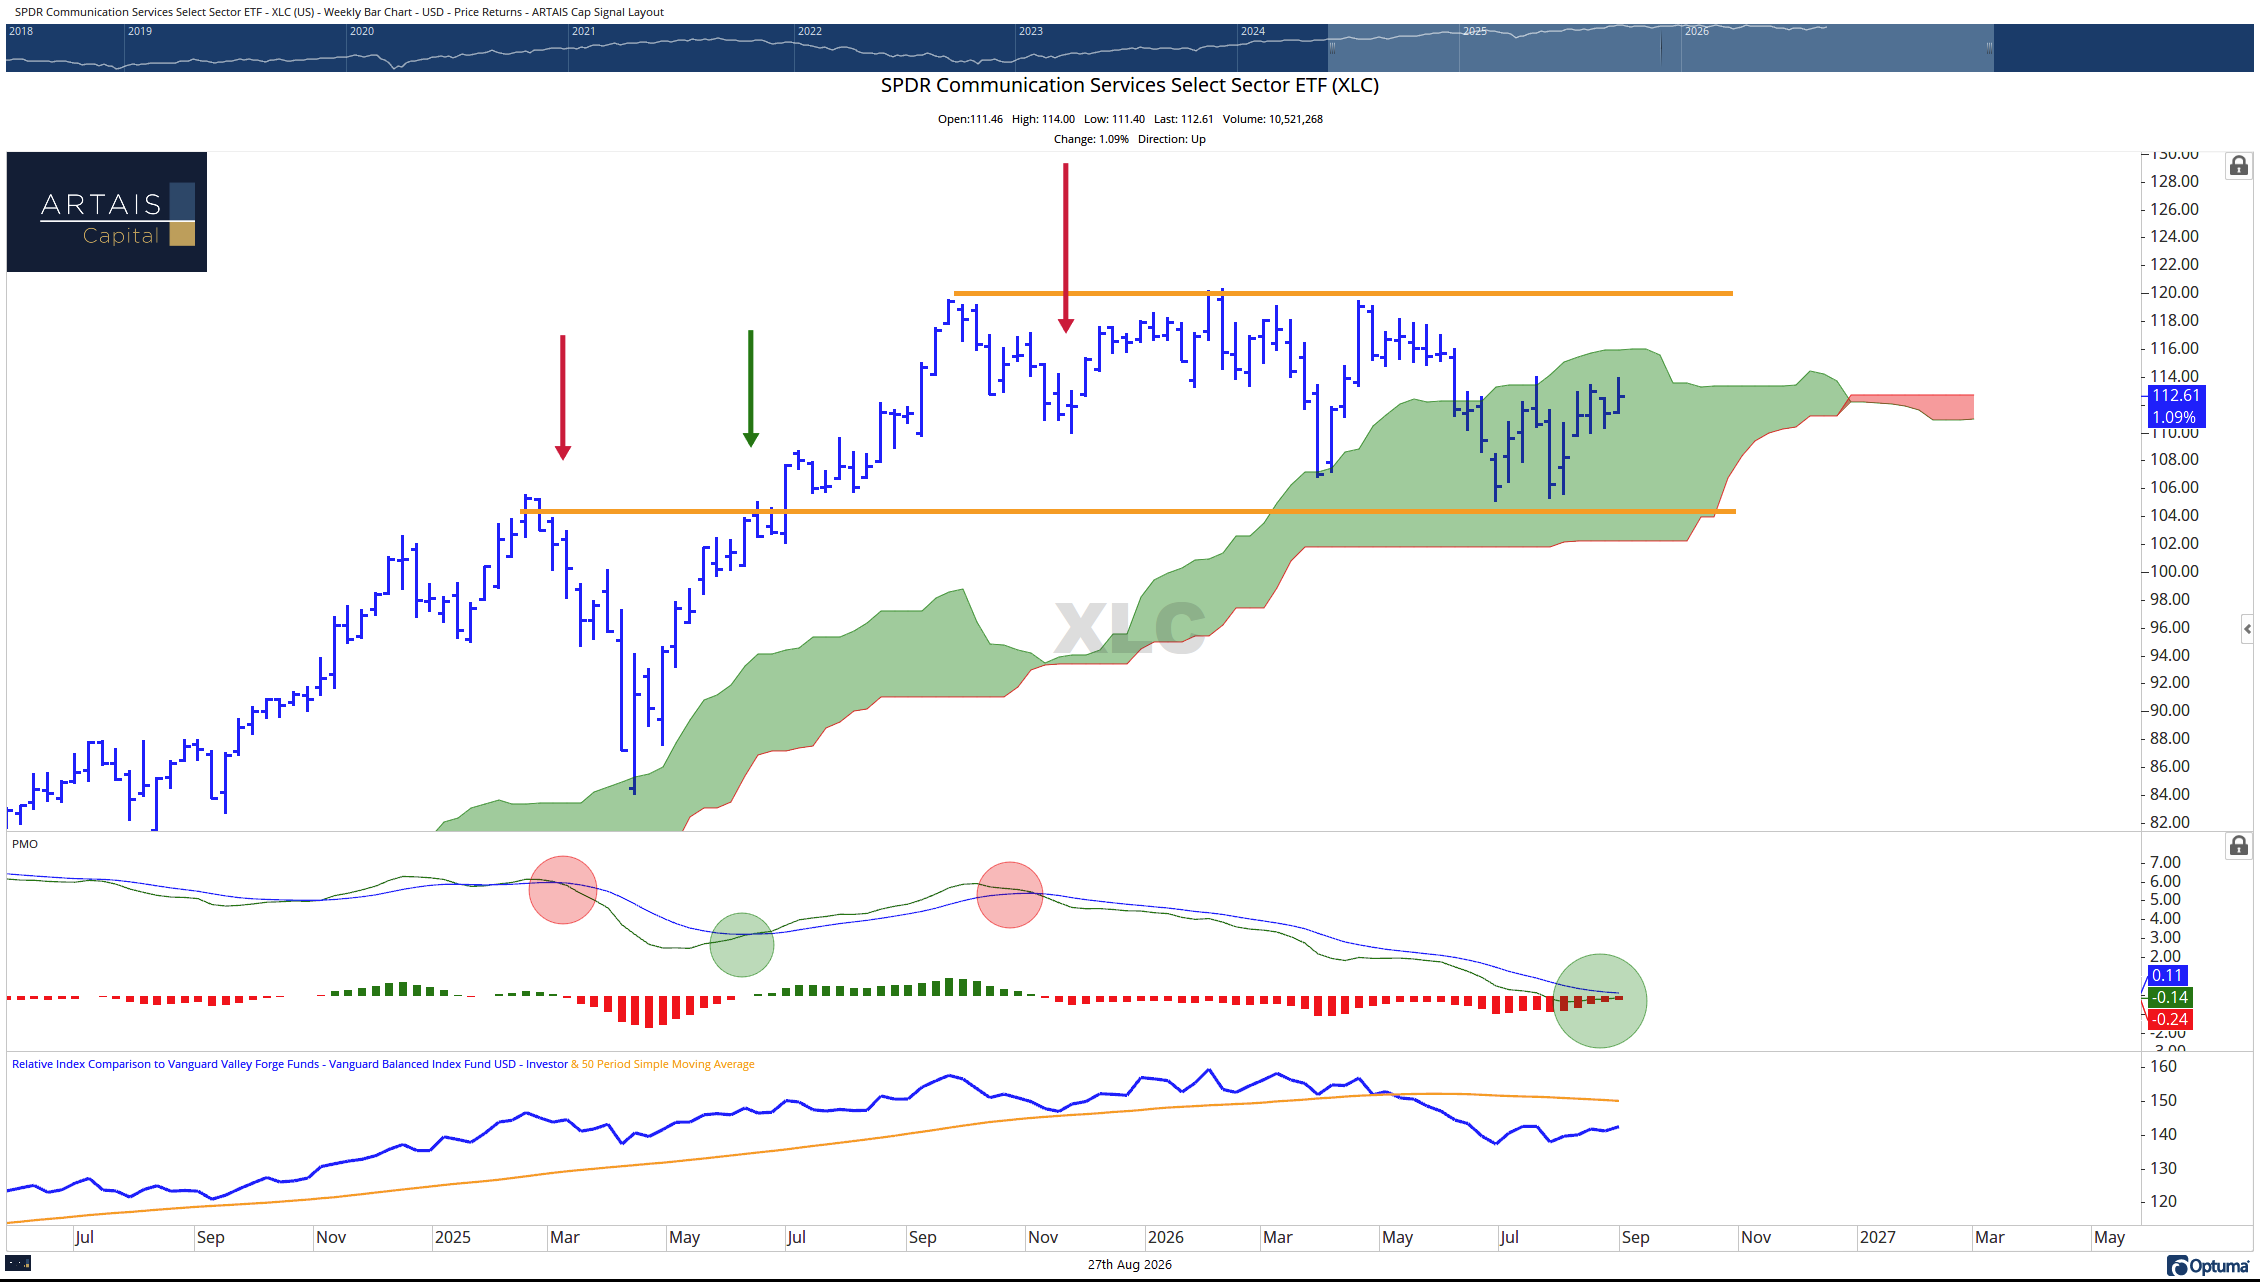
During this time, momentum declined, and the sector relatively underperformed VBINX (which I am using as a proxy for a 60/40 index).
Currently, the sector is still trading in this range bound, sideways pattern, but as momentum continues to improve, we may see the sector finally break out to new highs.
(Current ARTAIS clients, please reach out to me for a free paid subscription)
Under the Hood of the Communications Sector
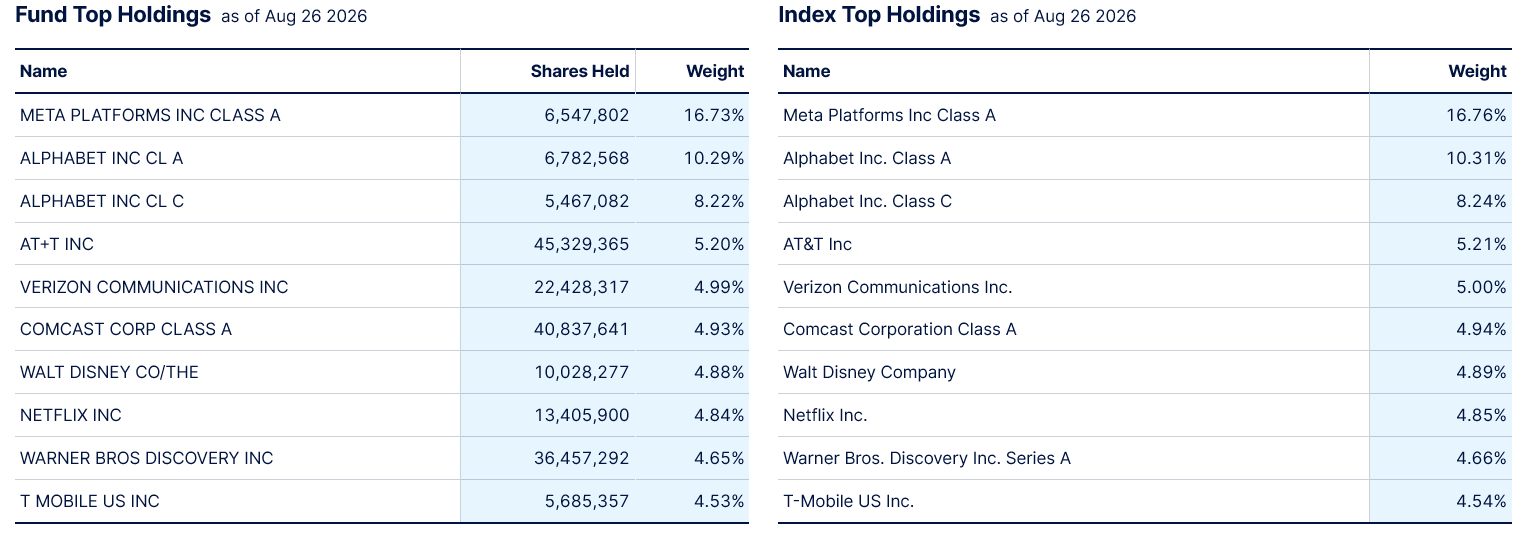
The XLC ETF is designed to mimic the Communications sector’s index. As of August 26th, the weighting of stocks within the ETF and the index are almost exactly the same.
This allows us to use XLC as a proxy for the sector and as a trading vehicle.
source: State Street Investment Management
Since last September, with the exception of Verizon, Warner Bros. Discovery, and Google (where it can be argued the price is rising due to the AI trade), the top 10 has underperformed the market.
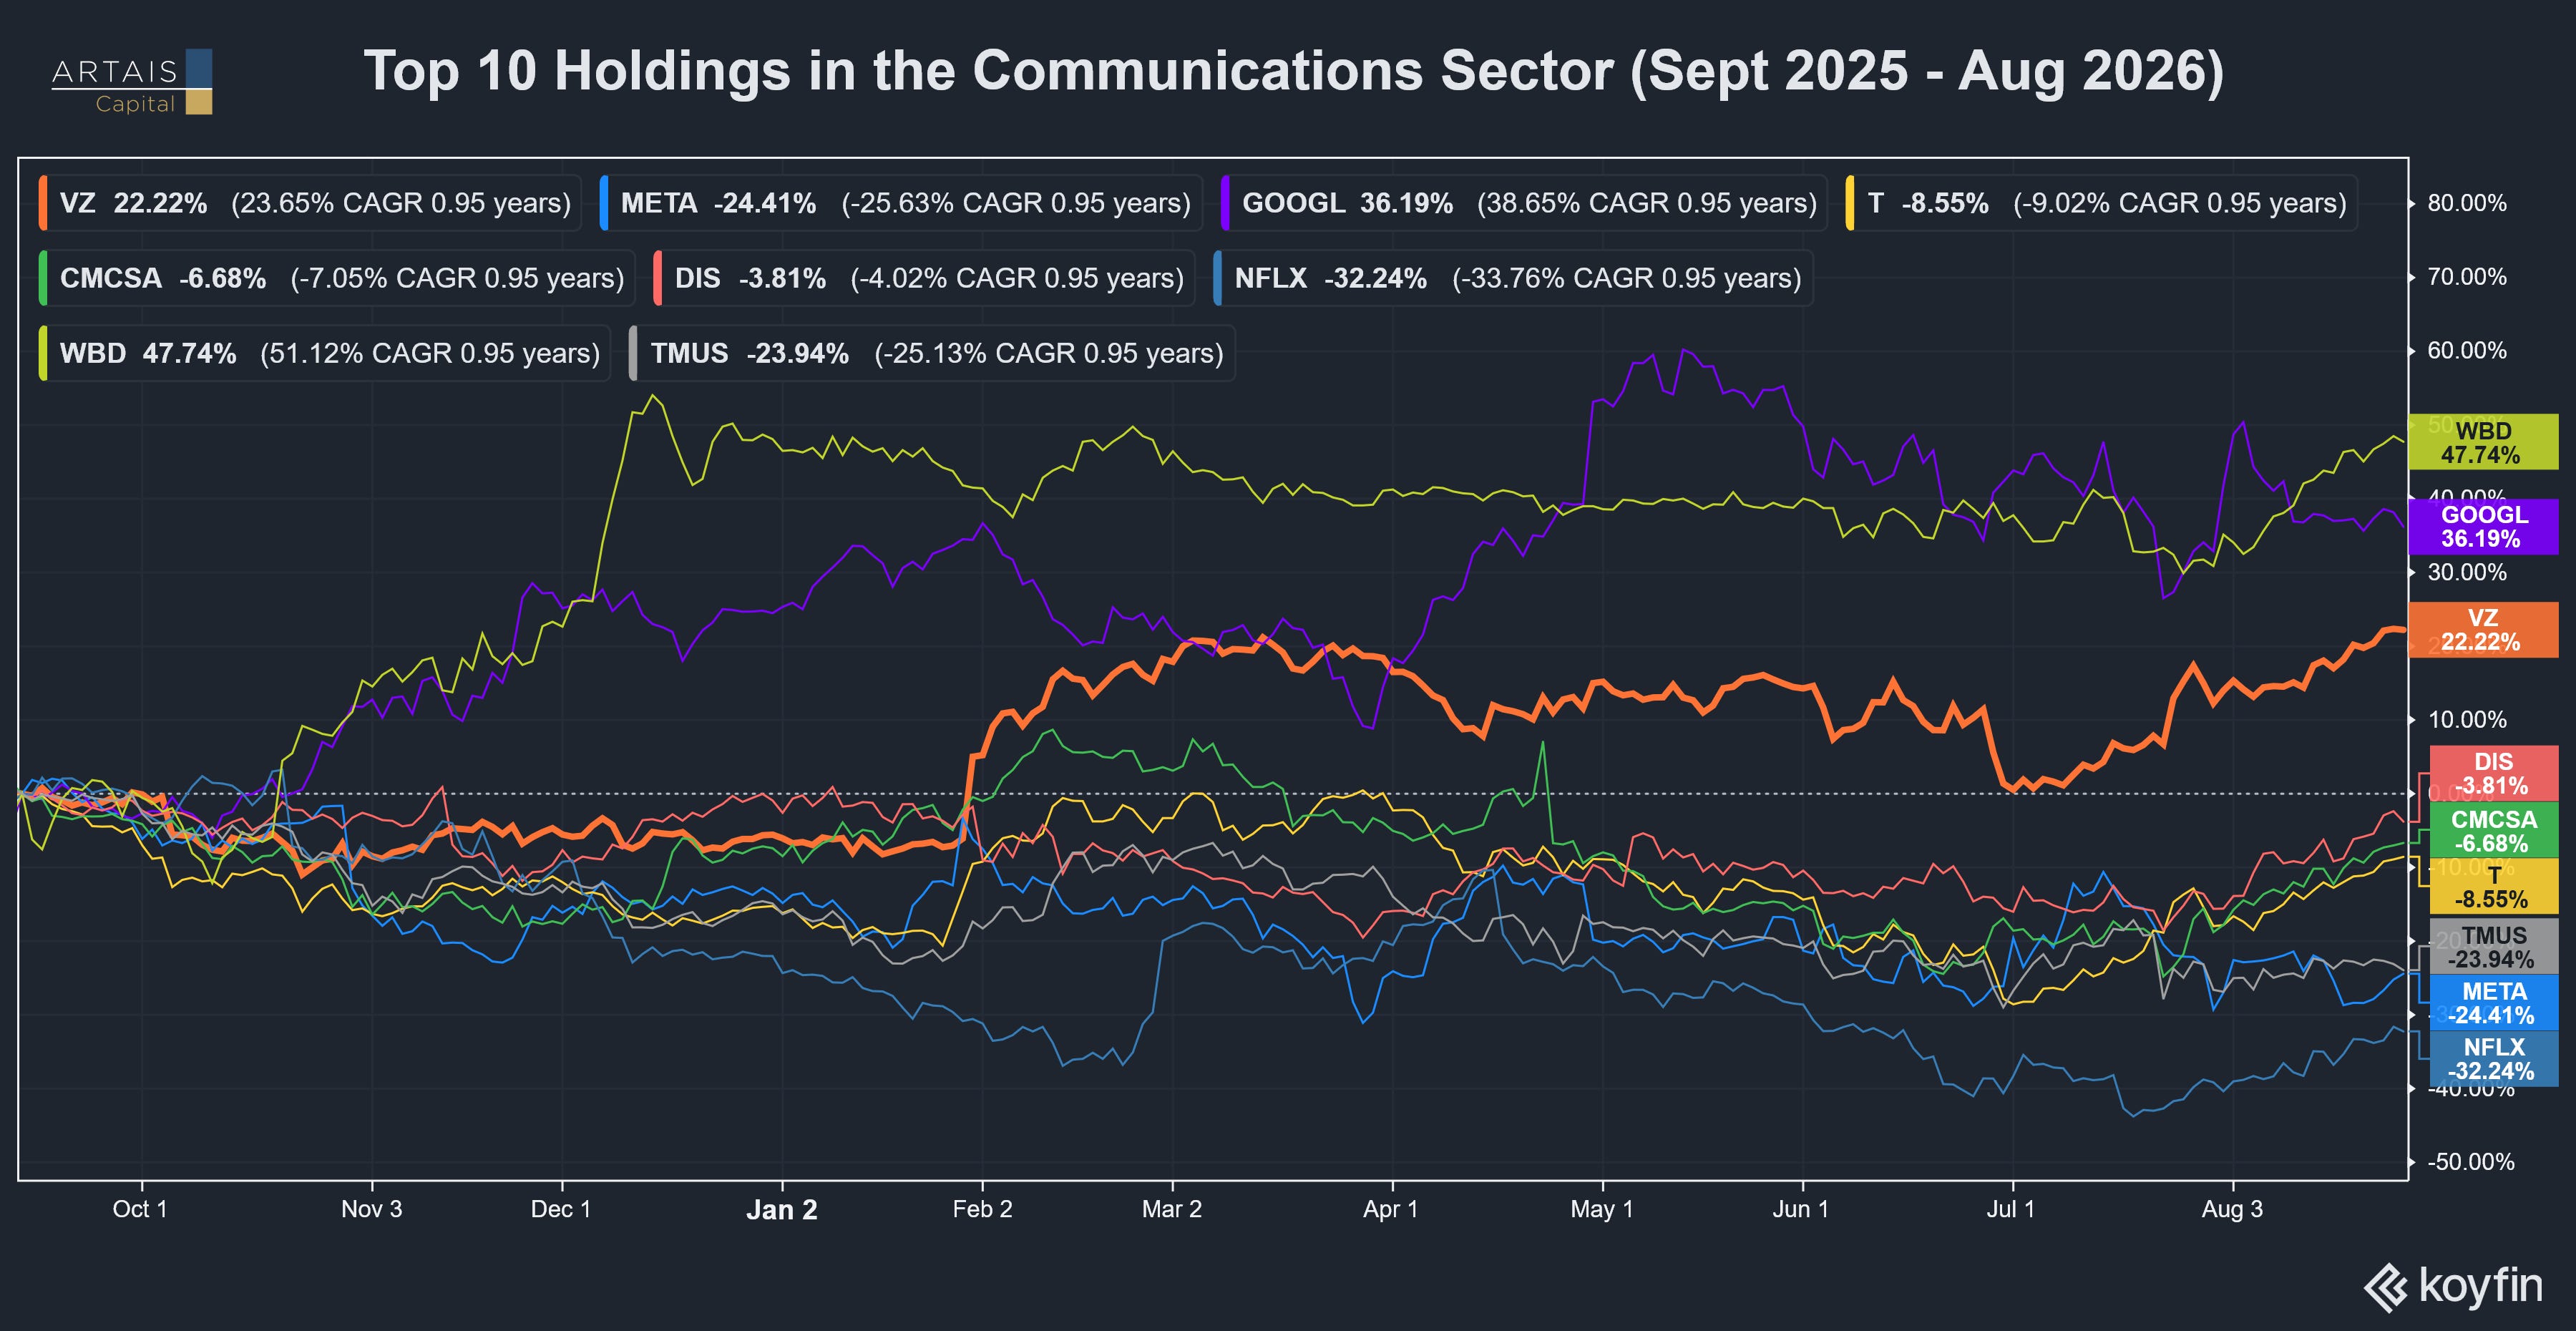
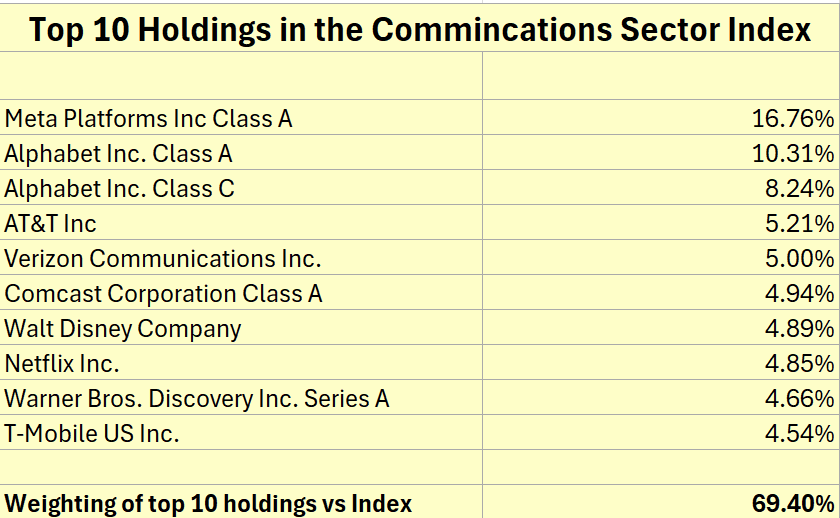
Since these 10 companies represent nearly 70% of the index, let’s take a closer look to see if we can gather more information about the recent changes in momentum.
Relative Rotation Graphs (RRG) for the Communications Sector
I am a big fan of Relative Rotation Graphs (RRG), as they help visualize the rotation between strength and weakness of the market, or in this case, a sector.
Currently, the majority of the top 10 is located in the bottom left hand quadrant. This is known as the “lagging” quadrant and is where we will find the weakest momentum and relative strength.
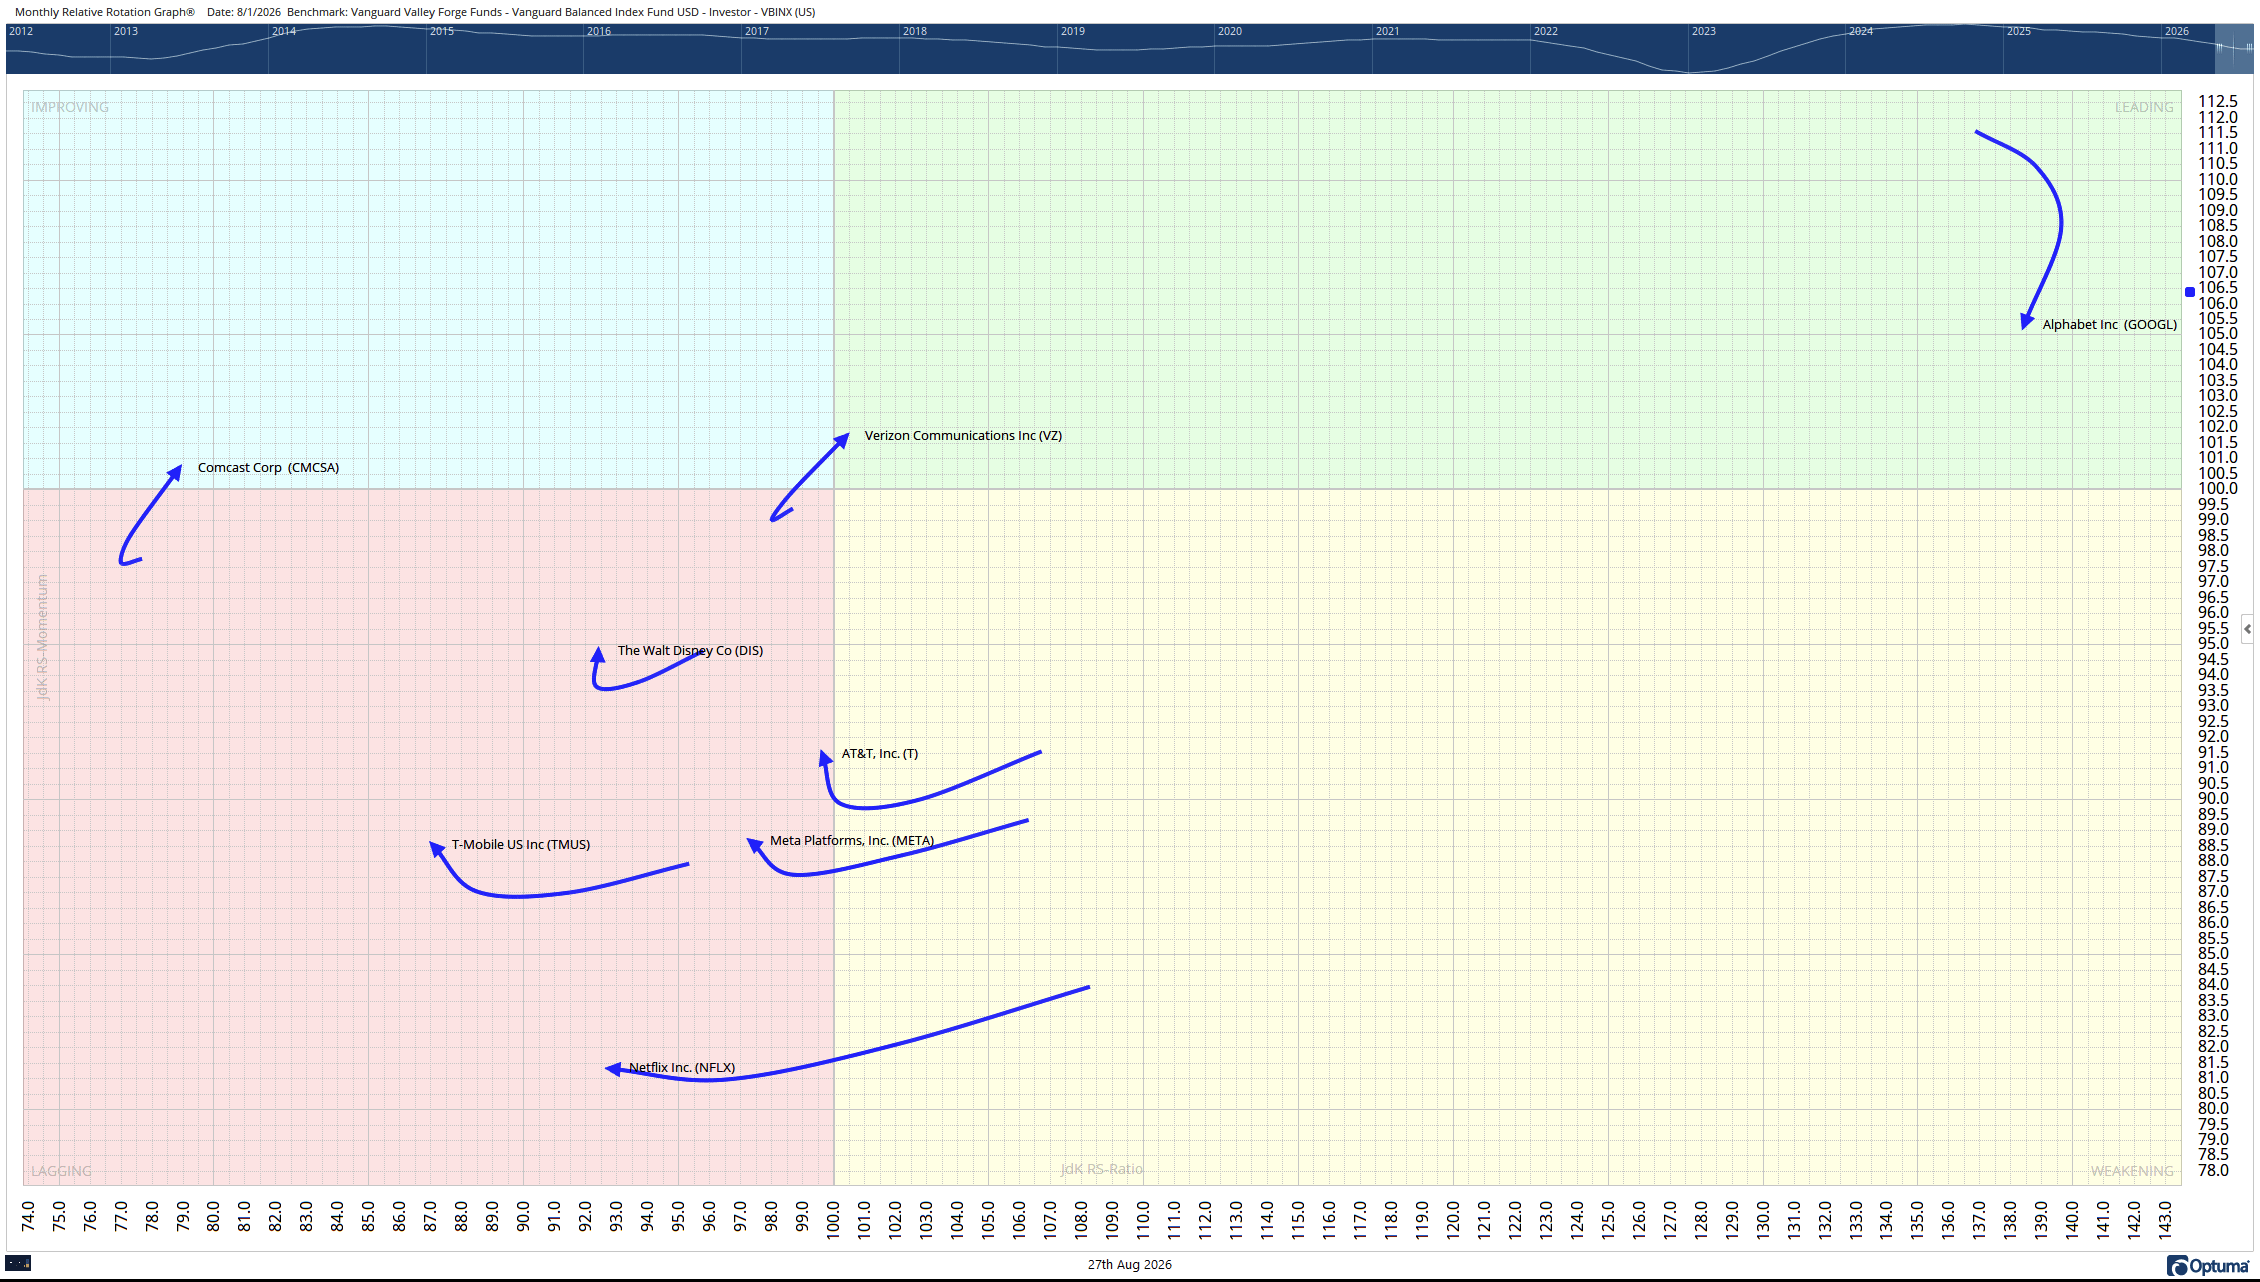
Naturally, we want to avoid anything in this quadrant, right?
Not necessarily. My own studies, as well as those done by others, have shown that since RRGs typically rotate in a clockwise fashion, the “lagging” quadrant may actually provide the opportunity to do what we have all been taught to do: “buy low, sell high.”
As I highlighted in this post: “Using Relative Rotation Graphs for Sector Selection”, Matthew Verdouw, CMT, CFTe, examined the probabilities of gain and the average annual return of each quadrant.
His research shows that the best performance comes from the lagging quadrant.
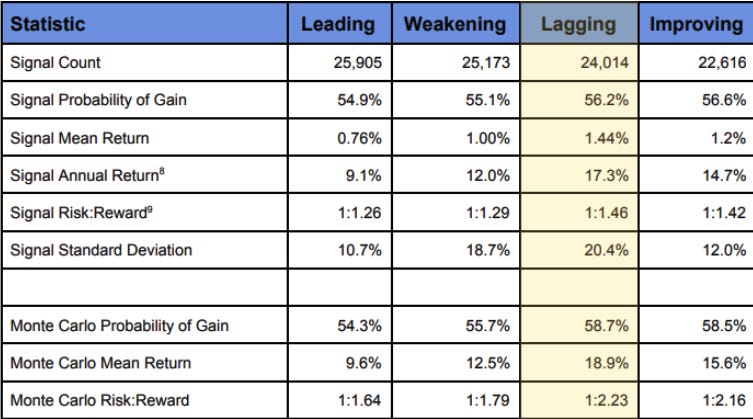
source: Buying Outperformers Is Too Late
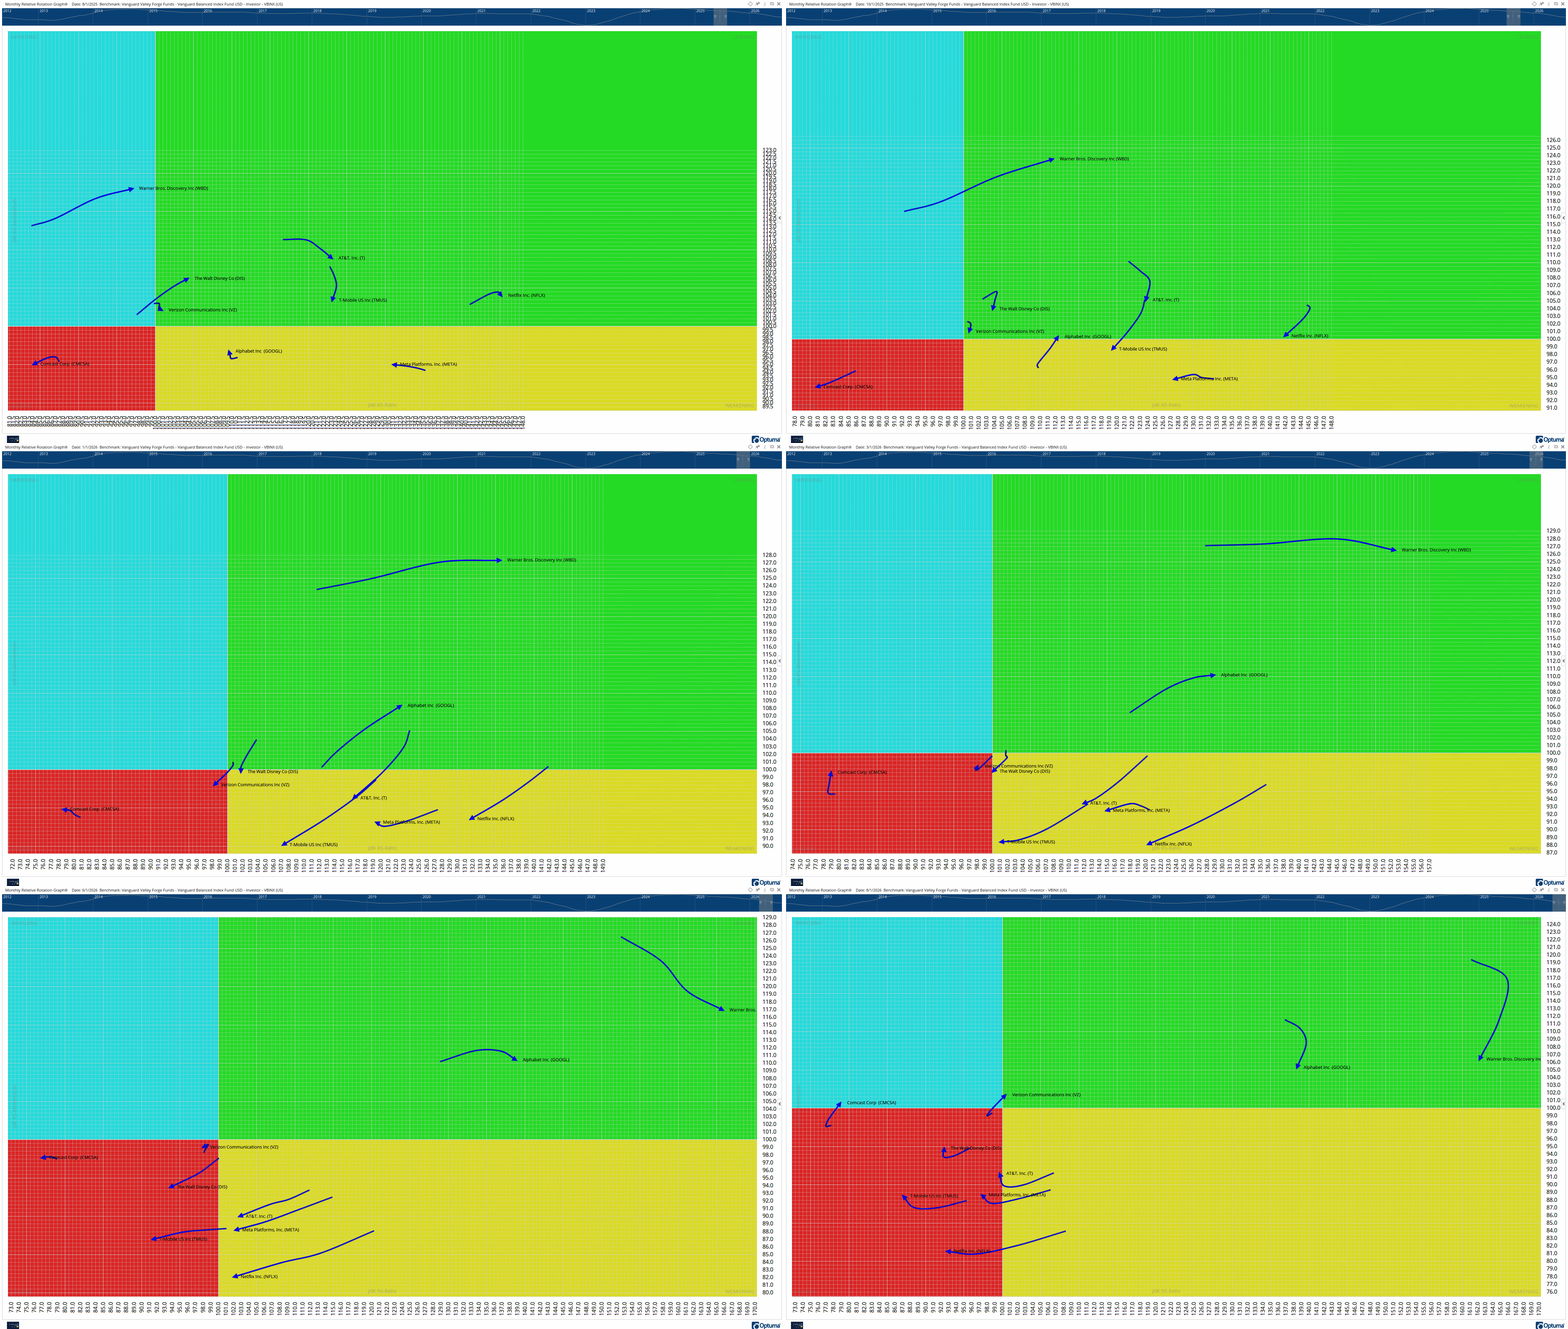
By animating the RRG during the period of negative momentum, you can see the rotation of the majority of the top ten holdings in the index move from strength to weakness:
So, Where Does this Leave Us?
The Communications sector is still stuck in the same trading range it has been in since last September, and the majority of its largest holdings are sitting in the lagging quadrant. On the surface, that is not a chart most investors would want to own.
But that is exactly the point.
Momentum tends to turn before price does, and RRGs tend to rotate in a clockwise fashion. If the top 10 holdings begin to rotate out of the lagging quadrant and into the improving quadrant, the “buy low” portion of the equation may already be in place.
From here, there are three things I am watching: continued improvement in momentum on the XLC chart, rotation of the top 10 holdings from the lagging quadrant into the improving quadrant, and a breakout above the sideways range that has contained the sector for almost a year.
Of course, none of this is guaranteed. Sectors can sit in the lagging quadrant longer than we expect, and breakouts can fail. But when momentum starts to improve while price is still range-bound, that is usually when I start paying closer attention, not less.
(Current ARTAIS clients, please reach out to me for a free paid subscription)
DISCLAIMER
This article is published by John Rothe, CMT, principal of ARTAIS Capital Management, LLC (“ARTAIS Capital”), a registered investment advisor offering advisory services in registered states and in other jurisdictions where exempt. Registration does not imply a certain level of skill or training.
The opinions expressed in this newsletter are for informational and educational purposes only and do not constitute investment advice, a recommendation to buy or sell any security, or an offer to provide investment advisory services. All investments involve risk, including the possible loss of principal.
Any references to past performance, market data, or historical patterns are not indicative of future results. Forward-looking statements reflect the author’s current analysis and are subject to change without notice.
ARTAIS Capital Management, its principal, and/or its clients may hold positions in securities or asset classes discussed in this publication.
For personalized investment advice, please consult a qualified financial professional who can assess your individual circumstances.
NATURE OF THIS PUBLICATION: This screen represents the complete output of a systematic, rules-based quantitative methodology. It is published for informational and educational purposes only. It is NOT a model portfolio, NOT a recommended holdings list, and NOT personalized investment advice.
CONFLICTS OF INTEREST: ARTAIS Capital Management, its principal, and/or its clients may hold, buy, or sell any security listed in this publication at any time, without notice, and without regard to the publication schedule. Some securities appearing on this screen may also appear in ARTAIS client portfolios. Client portfolio decisions are made independently based on each client’s investment objectives, risk tolerance, time horizon, tax situation, and overall portfolio context. The appearance of a security on this screen does not mean it is held in any specific client account, nor does it mean it is suitable for any particular investor.
SUBSCRIBERS VS. CLIENTS: Paid subscribers receive this research for informational and educational purposes. ARTAIS clients receive personalized portfolio management under a written investment advisory agreement. This publication is not a substitute for individualized investment advice. If you are not an ARTAIS client and wish to receive personalized advice, please consult a qualified financial professional who can assess your individual circumstances.
PERFORMANCE: No performance data for this screen is published, calculated, or implied. Past inclusion of a security on this screen is not indicative of future results. All investments involve risk, including the possible loss of principal.
NO OBLIGATION TO UPDATE: Securities may be added to or removed from this screen at any time based on the methodology’s criteria. ARTAIS has no obligation to notify subscribers of changes between scheduled publications.
LARGE-CAP FOCUS: This screen evaluates securities with market capitalizations generally above $8 billion. This does not imply that large-cap securities are less risky or more suitable than other investments.
Do not buy or sell any security solely based on its appearance on or removal from this screen.
© 2026 ARTAIS Capital Management, LLC. All rights reserved.
The consensus data bases on 69 asset managers TAA-reports on Communications Services mirrors your chart almost exactly, 28.6% overweight, 28.6% underweight, and a neutral plurality sitting on the fence at 42.9%.
That kind of even split usually means nobody has enough conviction to fight the range, which is exactly the setup where a momentum signal gets to move first.
If the top 10 rotate out of the lagging quadrant before that consensus tips one way, your RRG read will have called it before the fundamentals did.
I didn't know about Matthew Verdouw's research on the rotation graph, thanks for sharing