

Contents:
Changes to Research
Sector Rotation
Sector Bell Curve
Pass/Fail Screen for the 11 sectors of the S&P 500 index
Pass/Fail Screen for AI Universe
Changes to Research
I’ve decided to start publishing my research on a daily basis. Each day will have a specific focus:
Monday: The Week Ahead - Potential market-moving catalysts (news, earnings, data, etc).
Tuesday: Macro Watch - Macro themes that are driving the market.
Wednesday: Sector Watch - Sector rotation, leadership, and where the next opportunities may emerge.
Thursday: AI Model Update - An update on my AI themed model.
Friday: The 30,000 Foot View - An opinion/observation piece on the themes driving the market/economy.
Each day I will also be including the names within my AI Universe (these are the companies that are involved in the AI theme) that pass or fail my screen. These are not just technology companies, but companies across various sectors that are benefiting from the growth in AI.
Sector Rotation
In yesterday’s Macro report, I discussed the narrowing breadth of the market.
As the S&P 500 index is rising, the number of stocks within the index that are trading below their 21, 50 and 200 day moving averages has been rising:
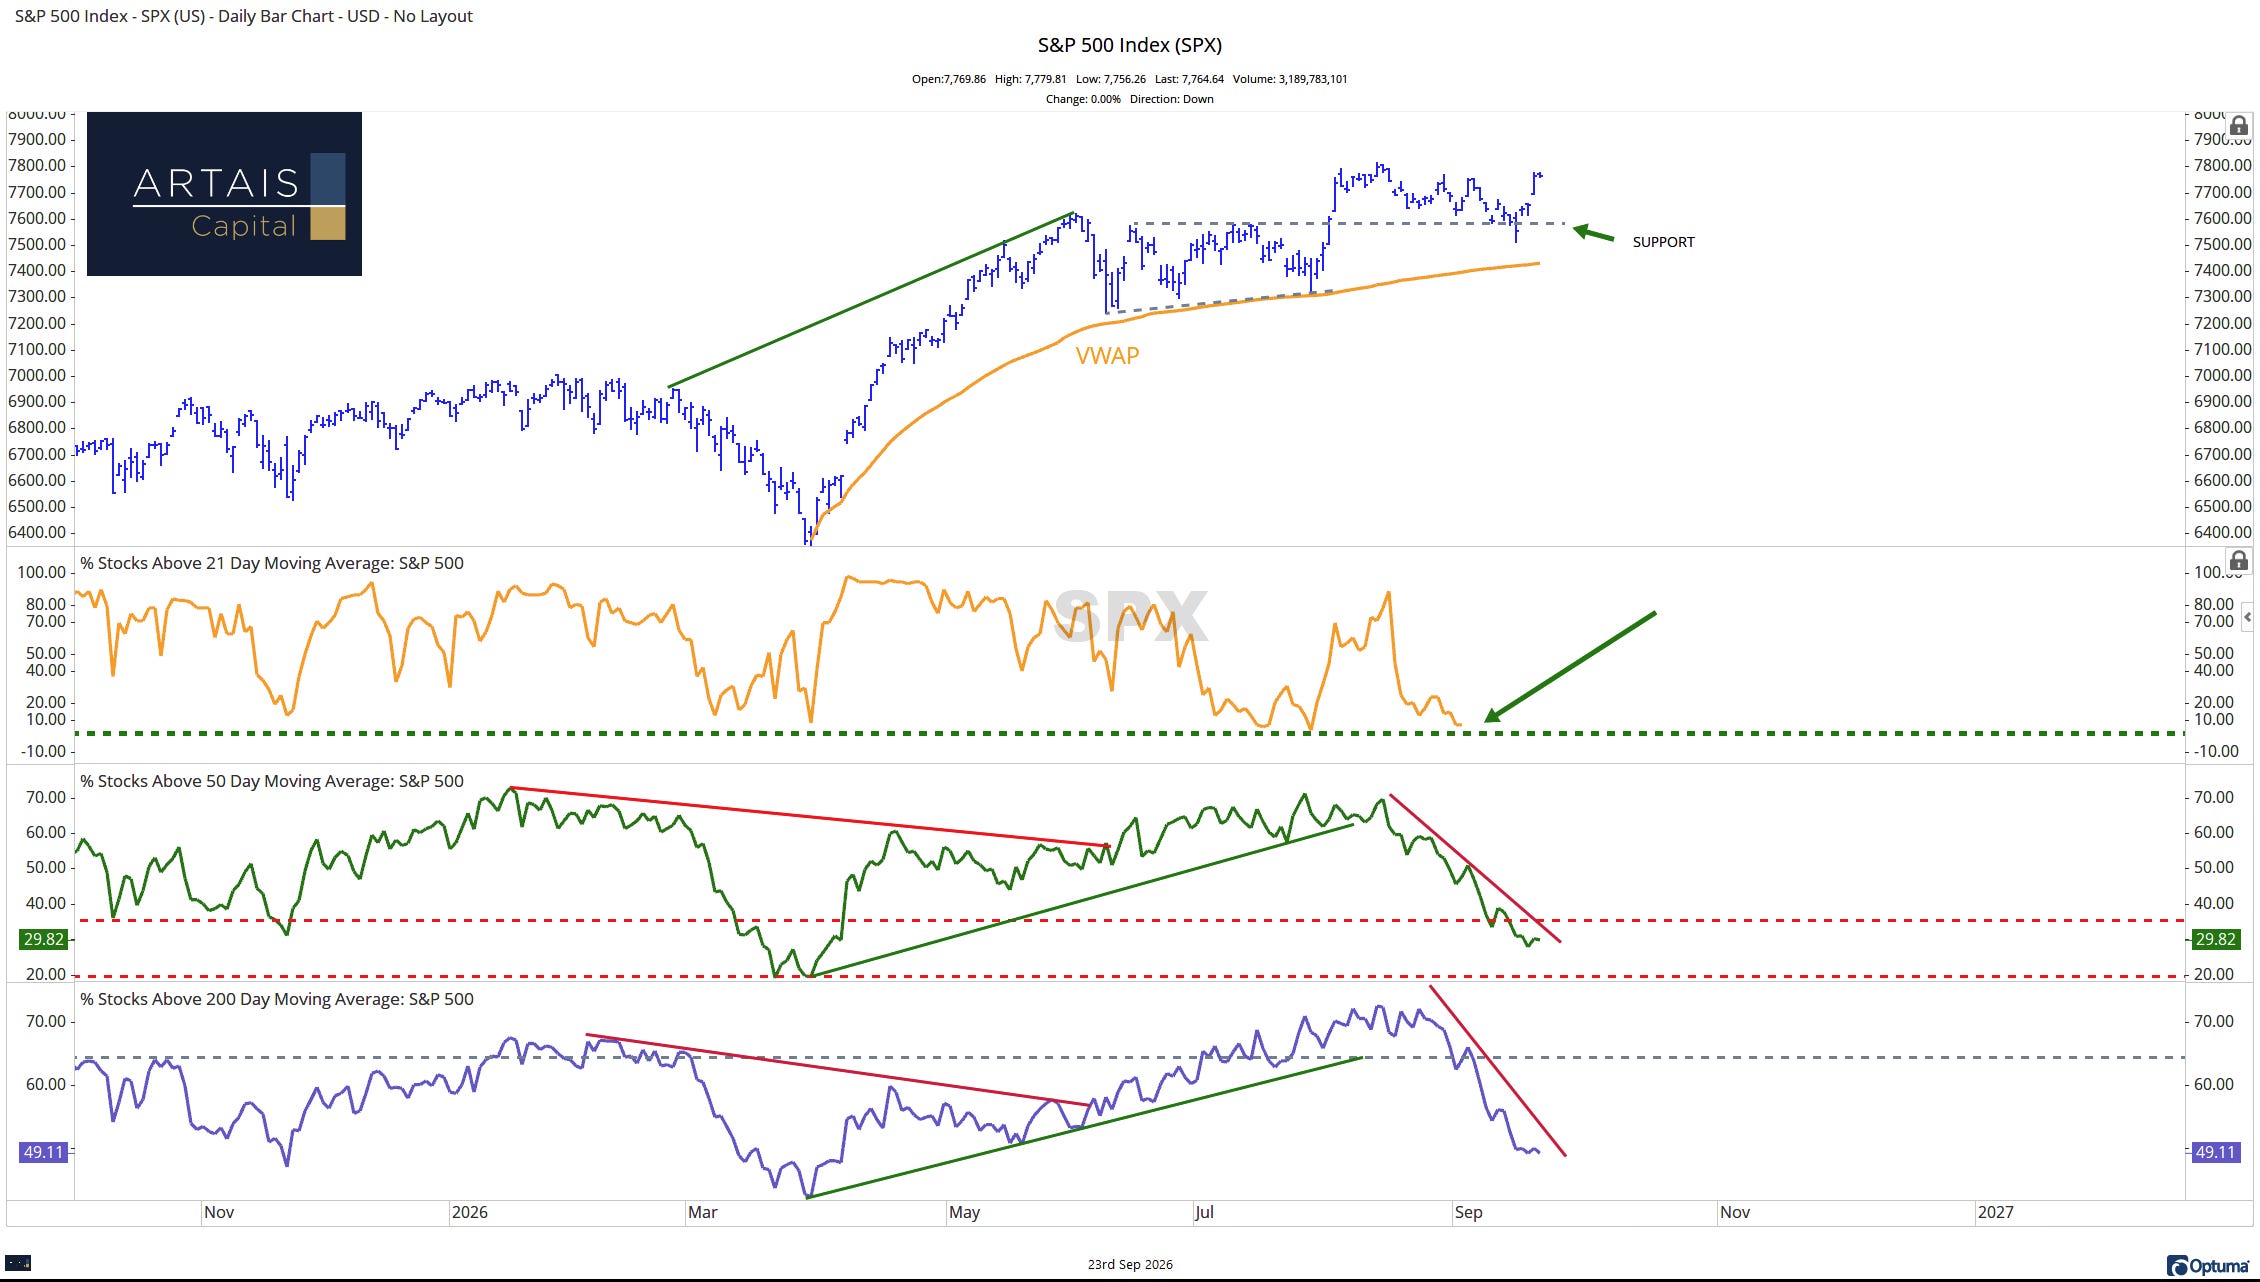
S&P 500 Breadth is showing an increasing number of stocks trading below their respective 21, 50, and 200 day moving averages
This is occurring due to the rotation back into tech stocks, which represent the largest weighting within the S&P 500.
So, even though more and more stocks are declining, the tech sector is so large that it has allowed the index to rise.
Below is a Relative Rotation Graph (RRG) of the 11 sectors that make up the S&P 500 index:
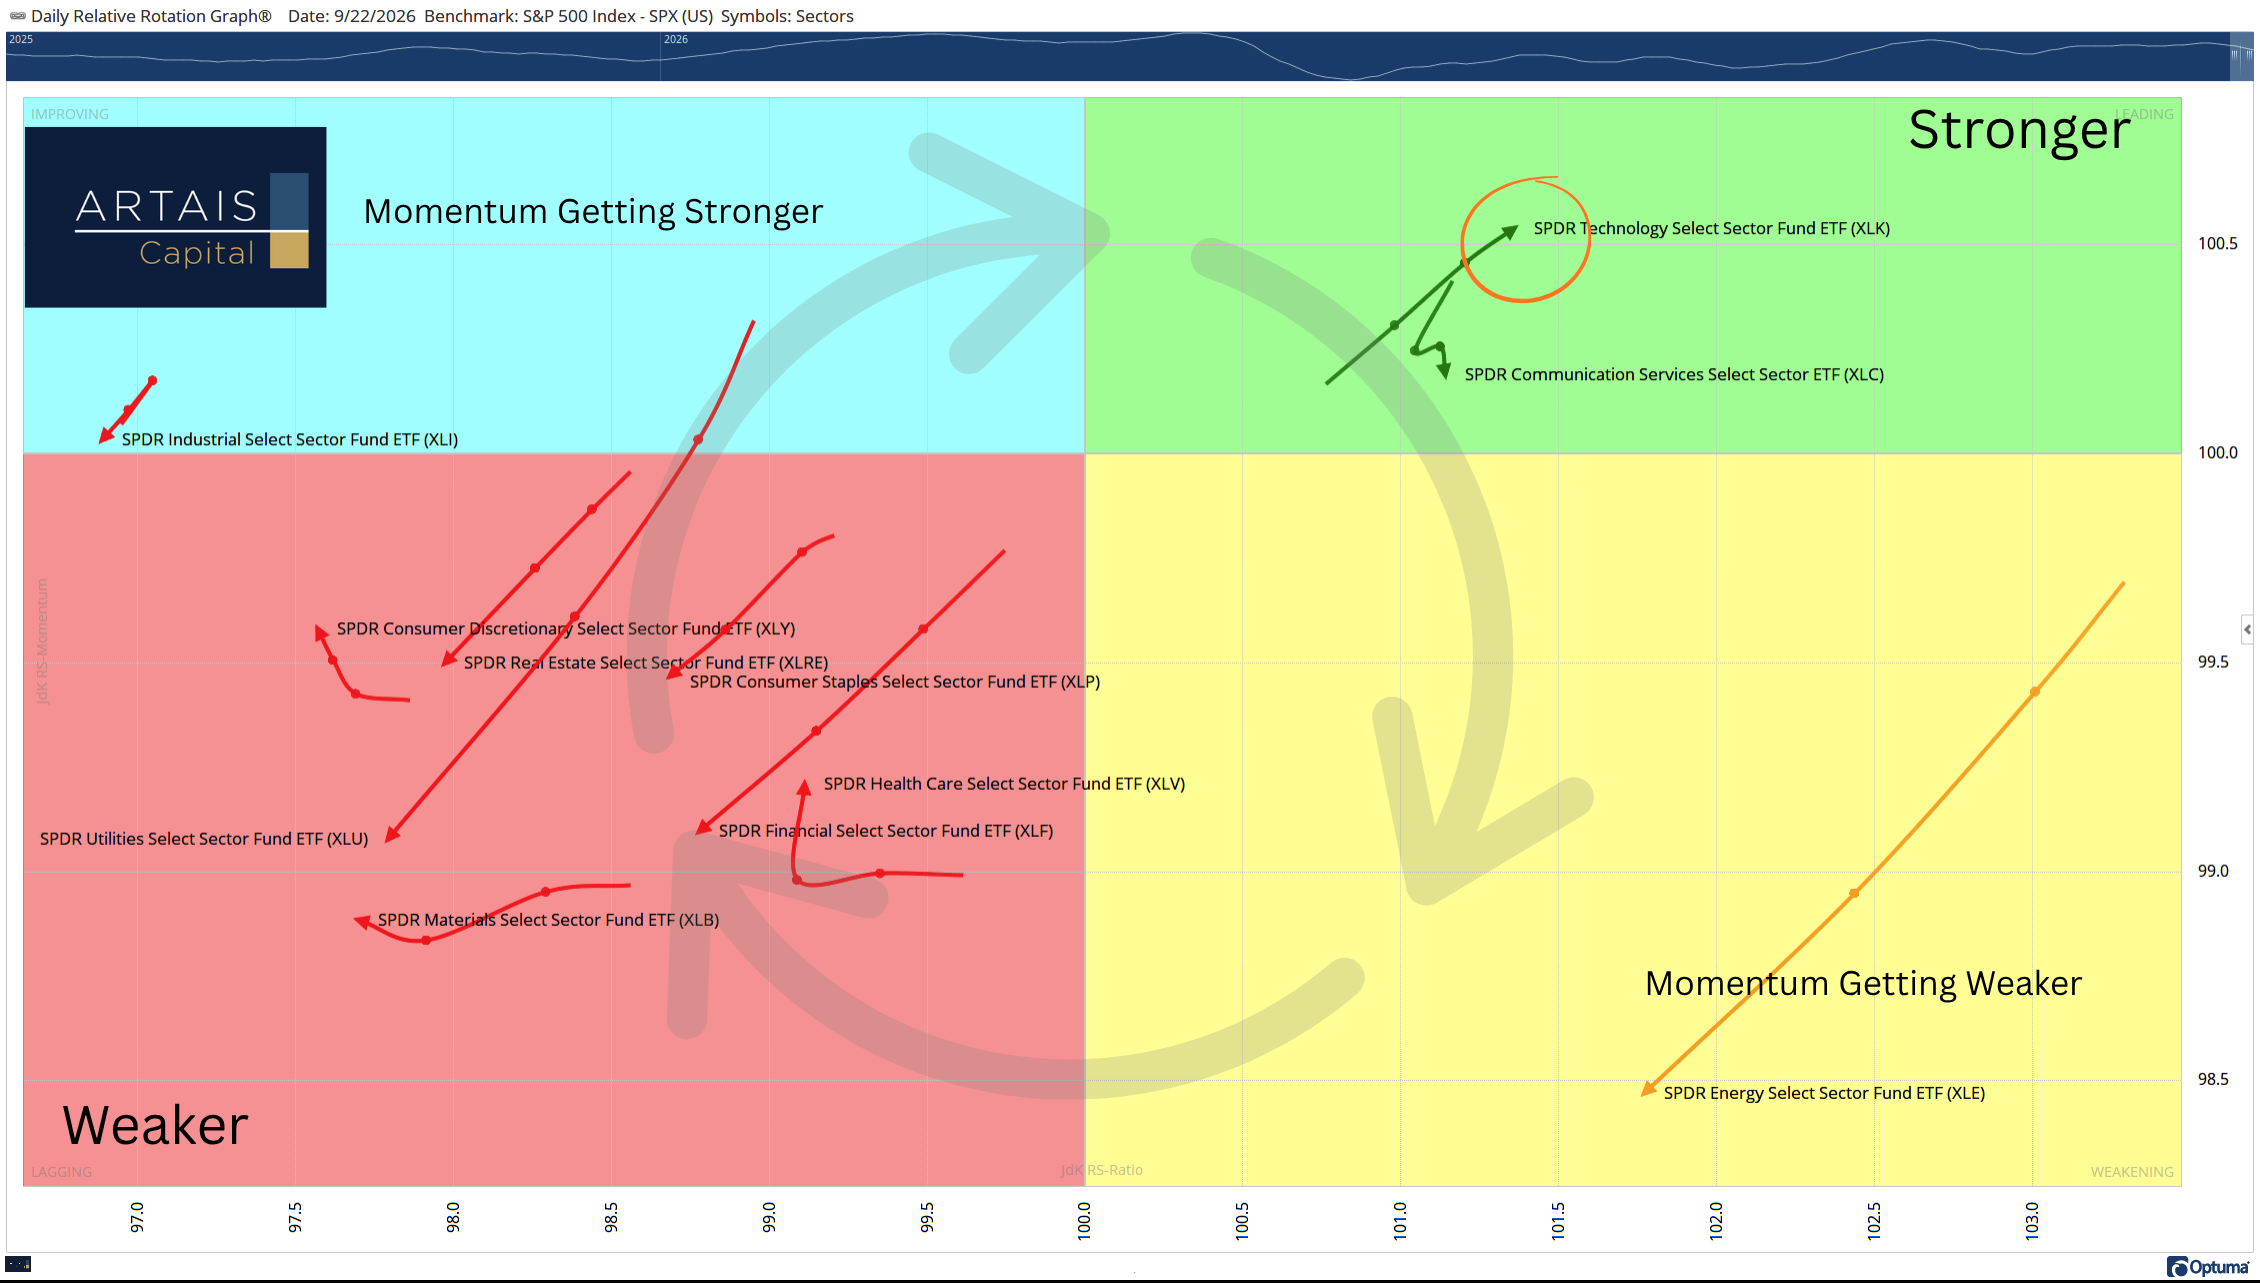
Typically, RRGs rotate in a clockwise fashion. The green, upper right quadrant represents sectors that have the strongest positive momentum and relative strength vs the index itself.
Currently, the two strongest sectors are Communications and Technology, with Technology showing the strongest positive momentum. These two sectors represent over 40% of the index, which is why we are still seeing the S&P 500 rising higher.
Can tech keep pushing higher?