


Issue No. 15 · Wednesday · September 9, 2026
What’s Inside:
At a Glance - A “weight of the evidence” look at the current market environment, as well as my Regime map.
The Call - A deeper dive into what I am seeing.
Under the Hood - Current market internals, sector breadth, and intermarket analysis.
Sector Watch - Which sectors pass/fail the screening process.
Current Screen - Which stocks pass the screening process.
What I Am Watching - Stocks I am watching that are approaching a passing grade in the screening process. Plus, what changed from last week.
(Current ARTAIS clients, please reach out to me for a free paid subscription)
At a Glance:
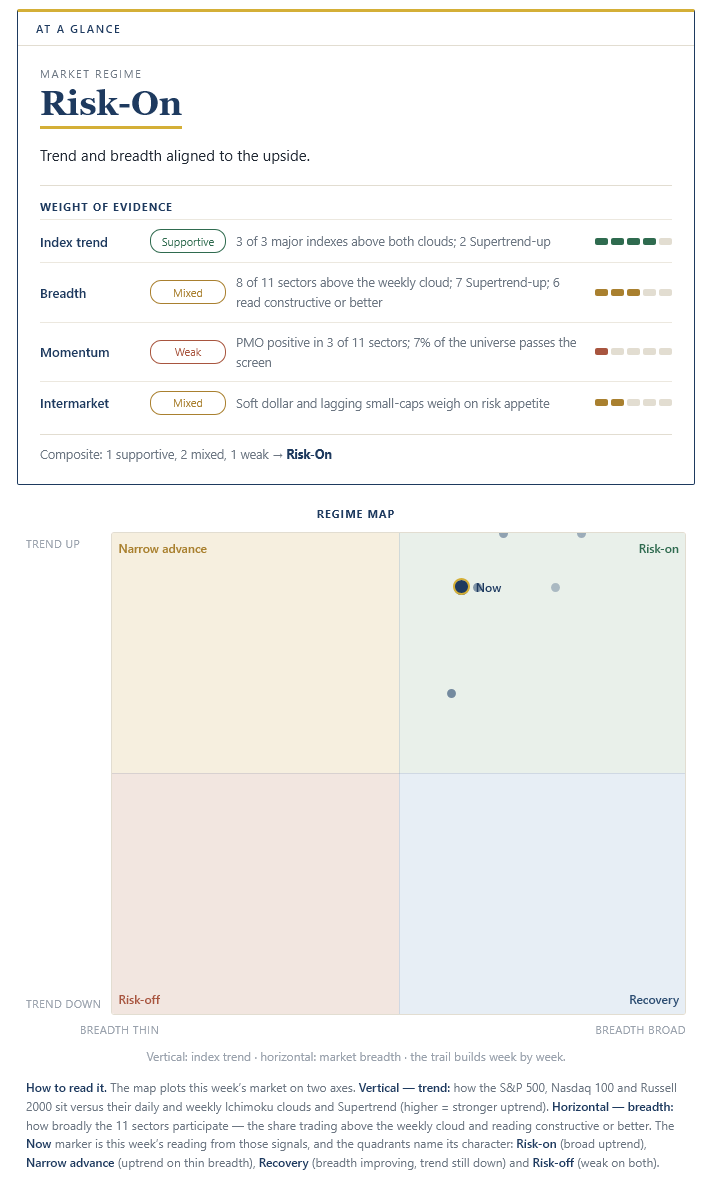
Market regime: Risk On
The Call - Pay Attention to Market Rotation:
In last week’s Signal & Noise report, I discussed the rotation I was seeing within the AI theme.
This rotation is becoming more visible as the market rotates away from the “oil” story to the “AI growth” story.
S&P 500 Index: Market Breadth and Sector Weighting
Breadth for the S&P 500 index continues to drop, meaning the number of stocks within the index that are trading above their respected 50 day and 200 day moving averages is declining.
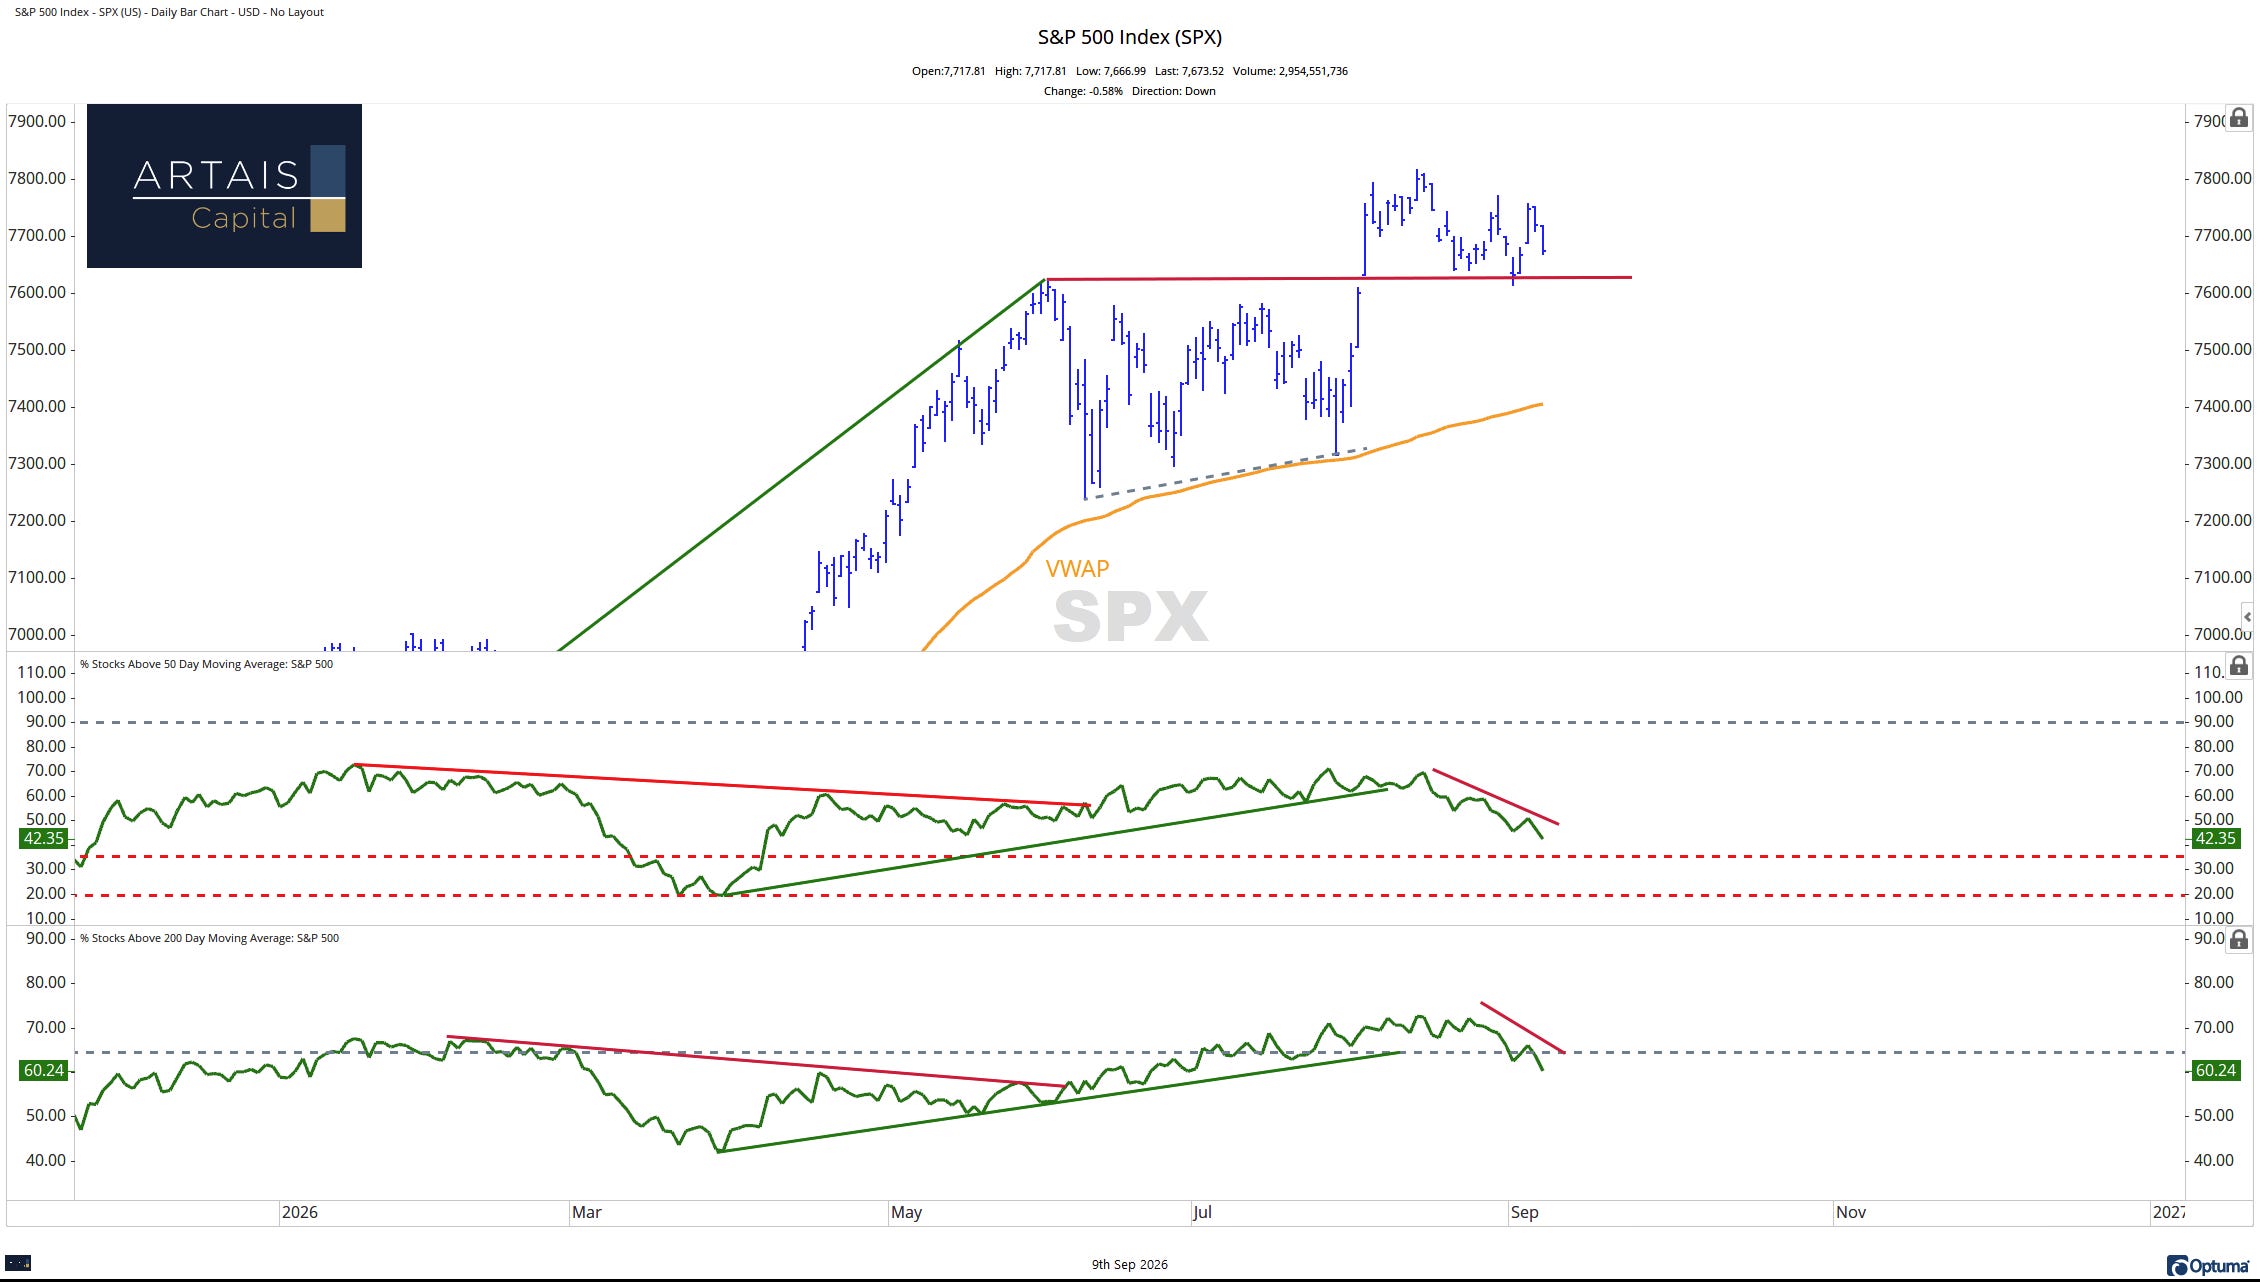
A decline in market breadth doesn’t always mean that the market is dropping.
As I’ve mentioned before, the S&P 500 index is weighted by market capitalization, meaning: (number of shares traded x current stock price) = market capitalization. The larger the capitalization, the larger the weighting it has within the index.
NVIDA vs Valero Energy
For example, as of September 2026, NVIDIA (NVDA) has 24,286,000,000 shares of stock outstanding (available for trading). If the price of the stock is $225.73 per share, the market cap of NVDA is $5.450 trillion.
Now compare NVDA to Valero Energy (VLO):
Shares available: 298,000,000 (a significantly smaller amount than NVDA)
Stock Price: $382.85
Market Cap: $110.23 billion
Within the S&P 500 index, NVDA gets a larger weighting than VLO.
Why does this matter? Well, because of this methodology, more popular companies can issue more shares and not have their price negatively impacted (think supply vs demand).
As a result, the index is more influenced by sectors that have a larger market cap, like the technology sector:
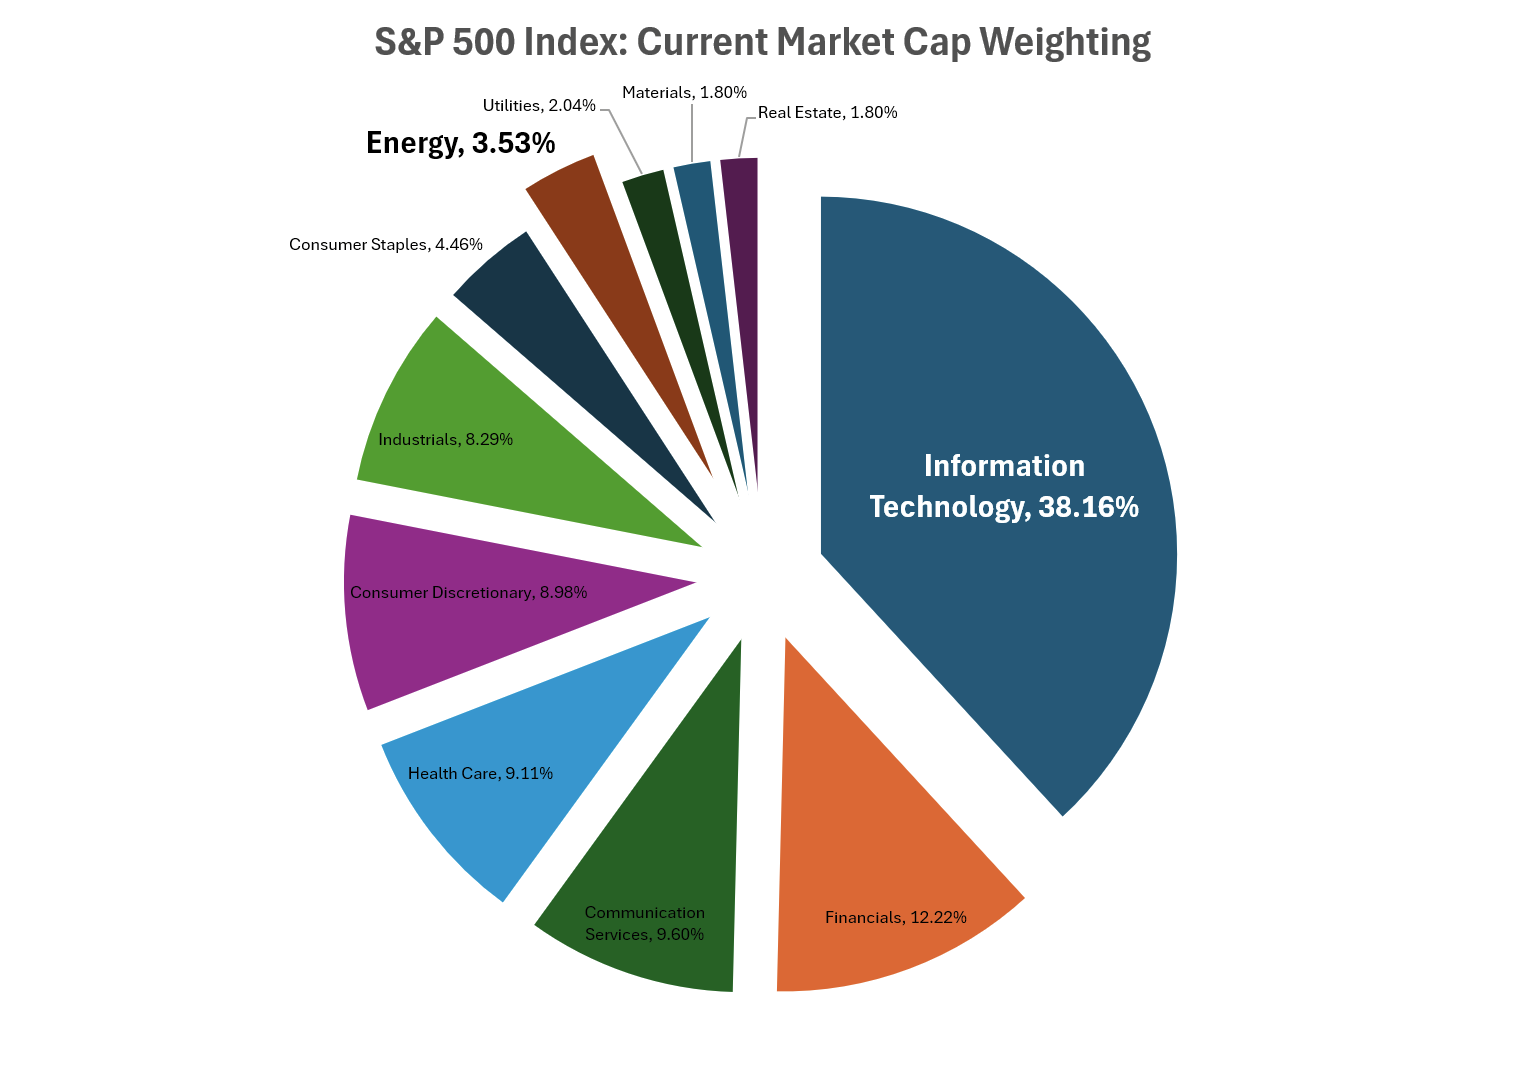
Note the difference: Technology represents approximately 38% of the index, while energy represents 3.5%.
So for a company like Valero, whose stock has risen over 130% year to date (NVDA is up 21%), the impact on the index is extremely small due to Valero’s small representation within the index.
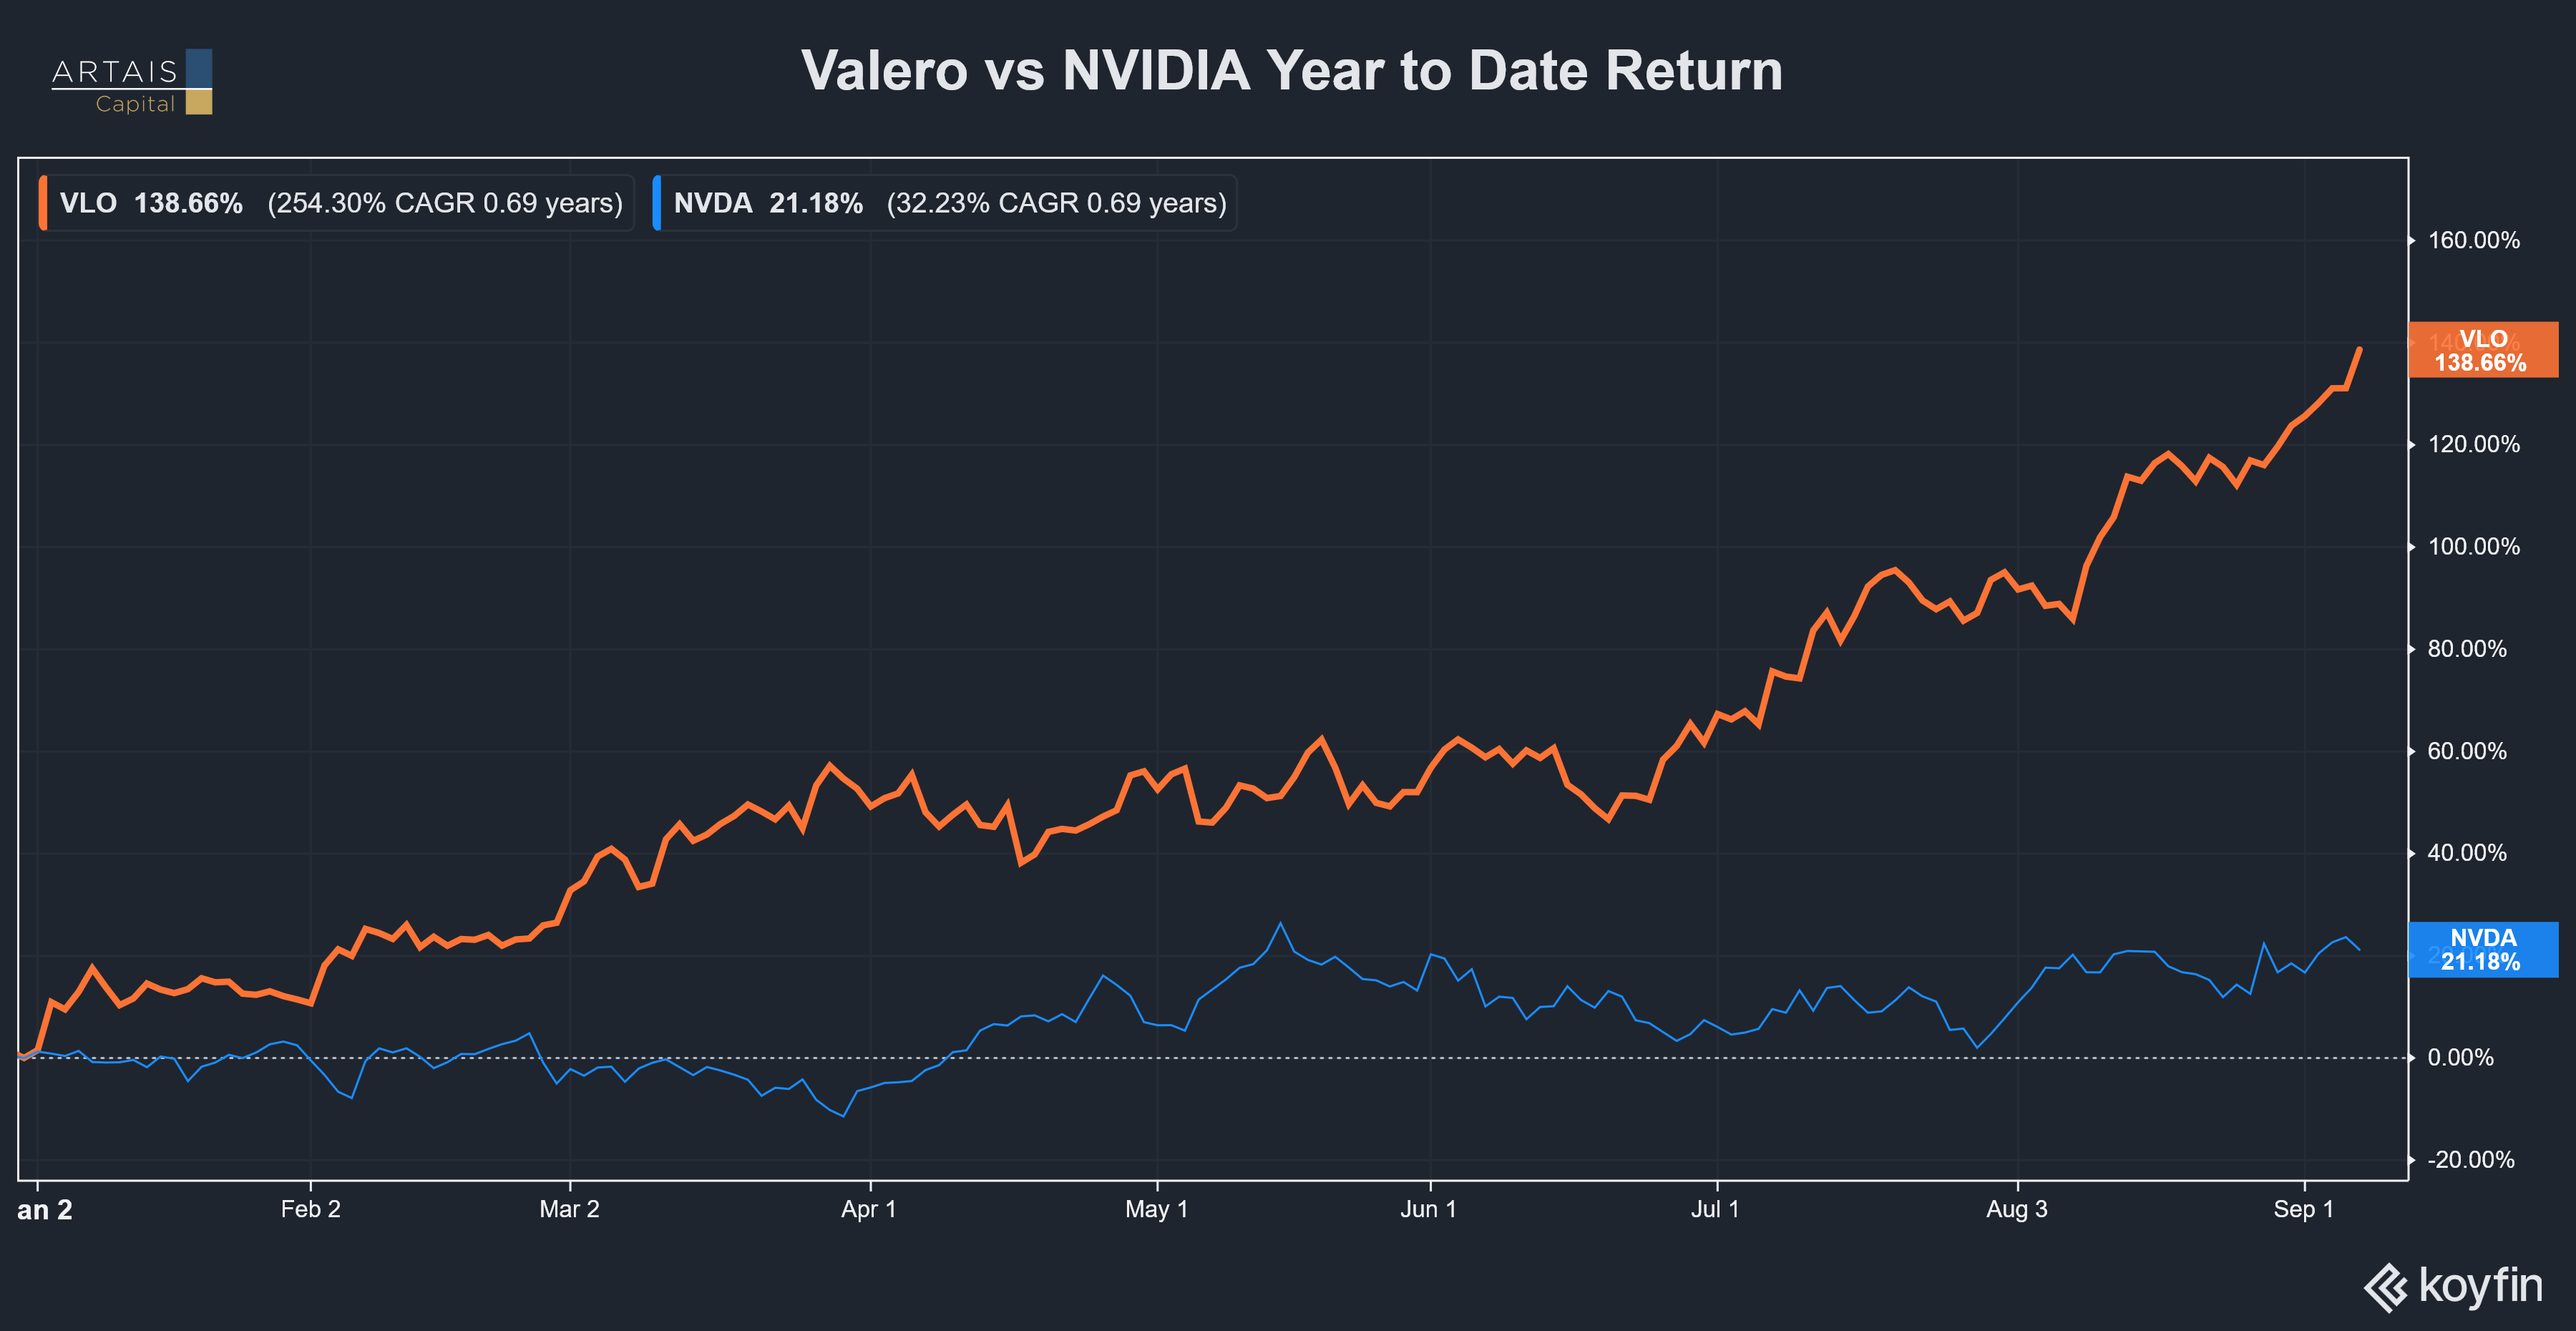
The methodology of the weighting of the index is why the S&P 500 index has not significantly declined. Despite more and more stocks within the index declining, the technology sector is keeping the index from declining.
Rotation Back to Tech?
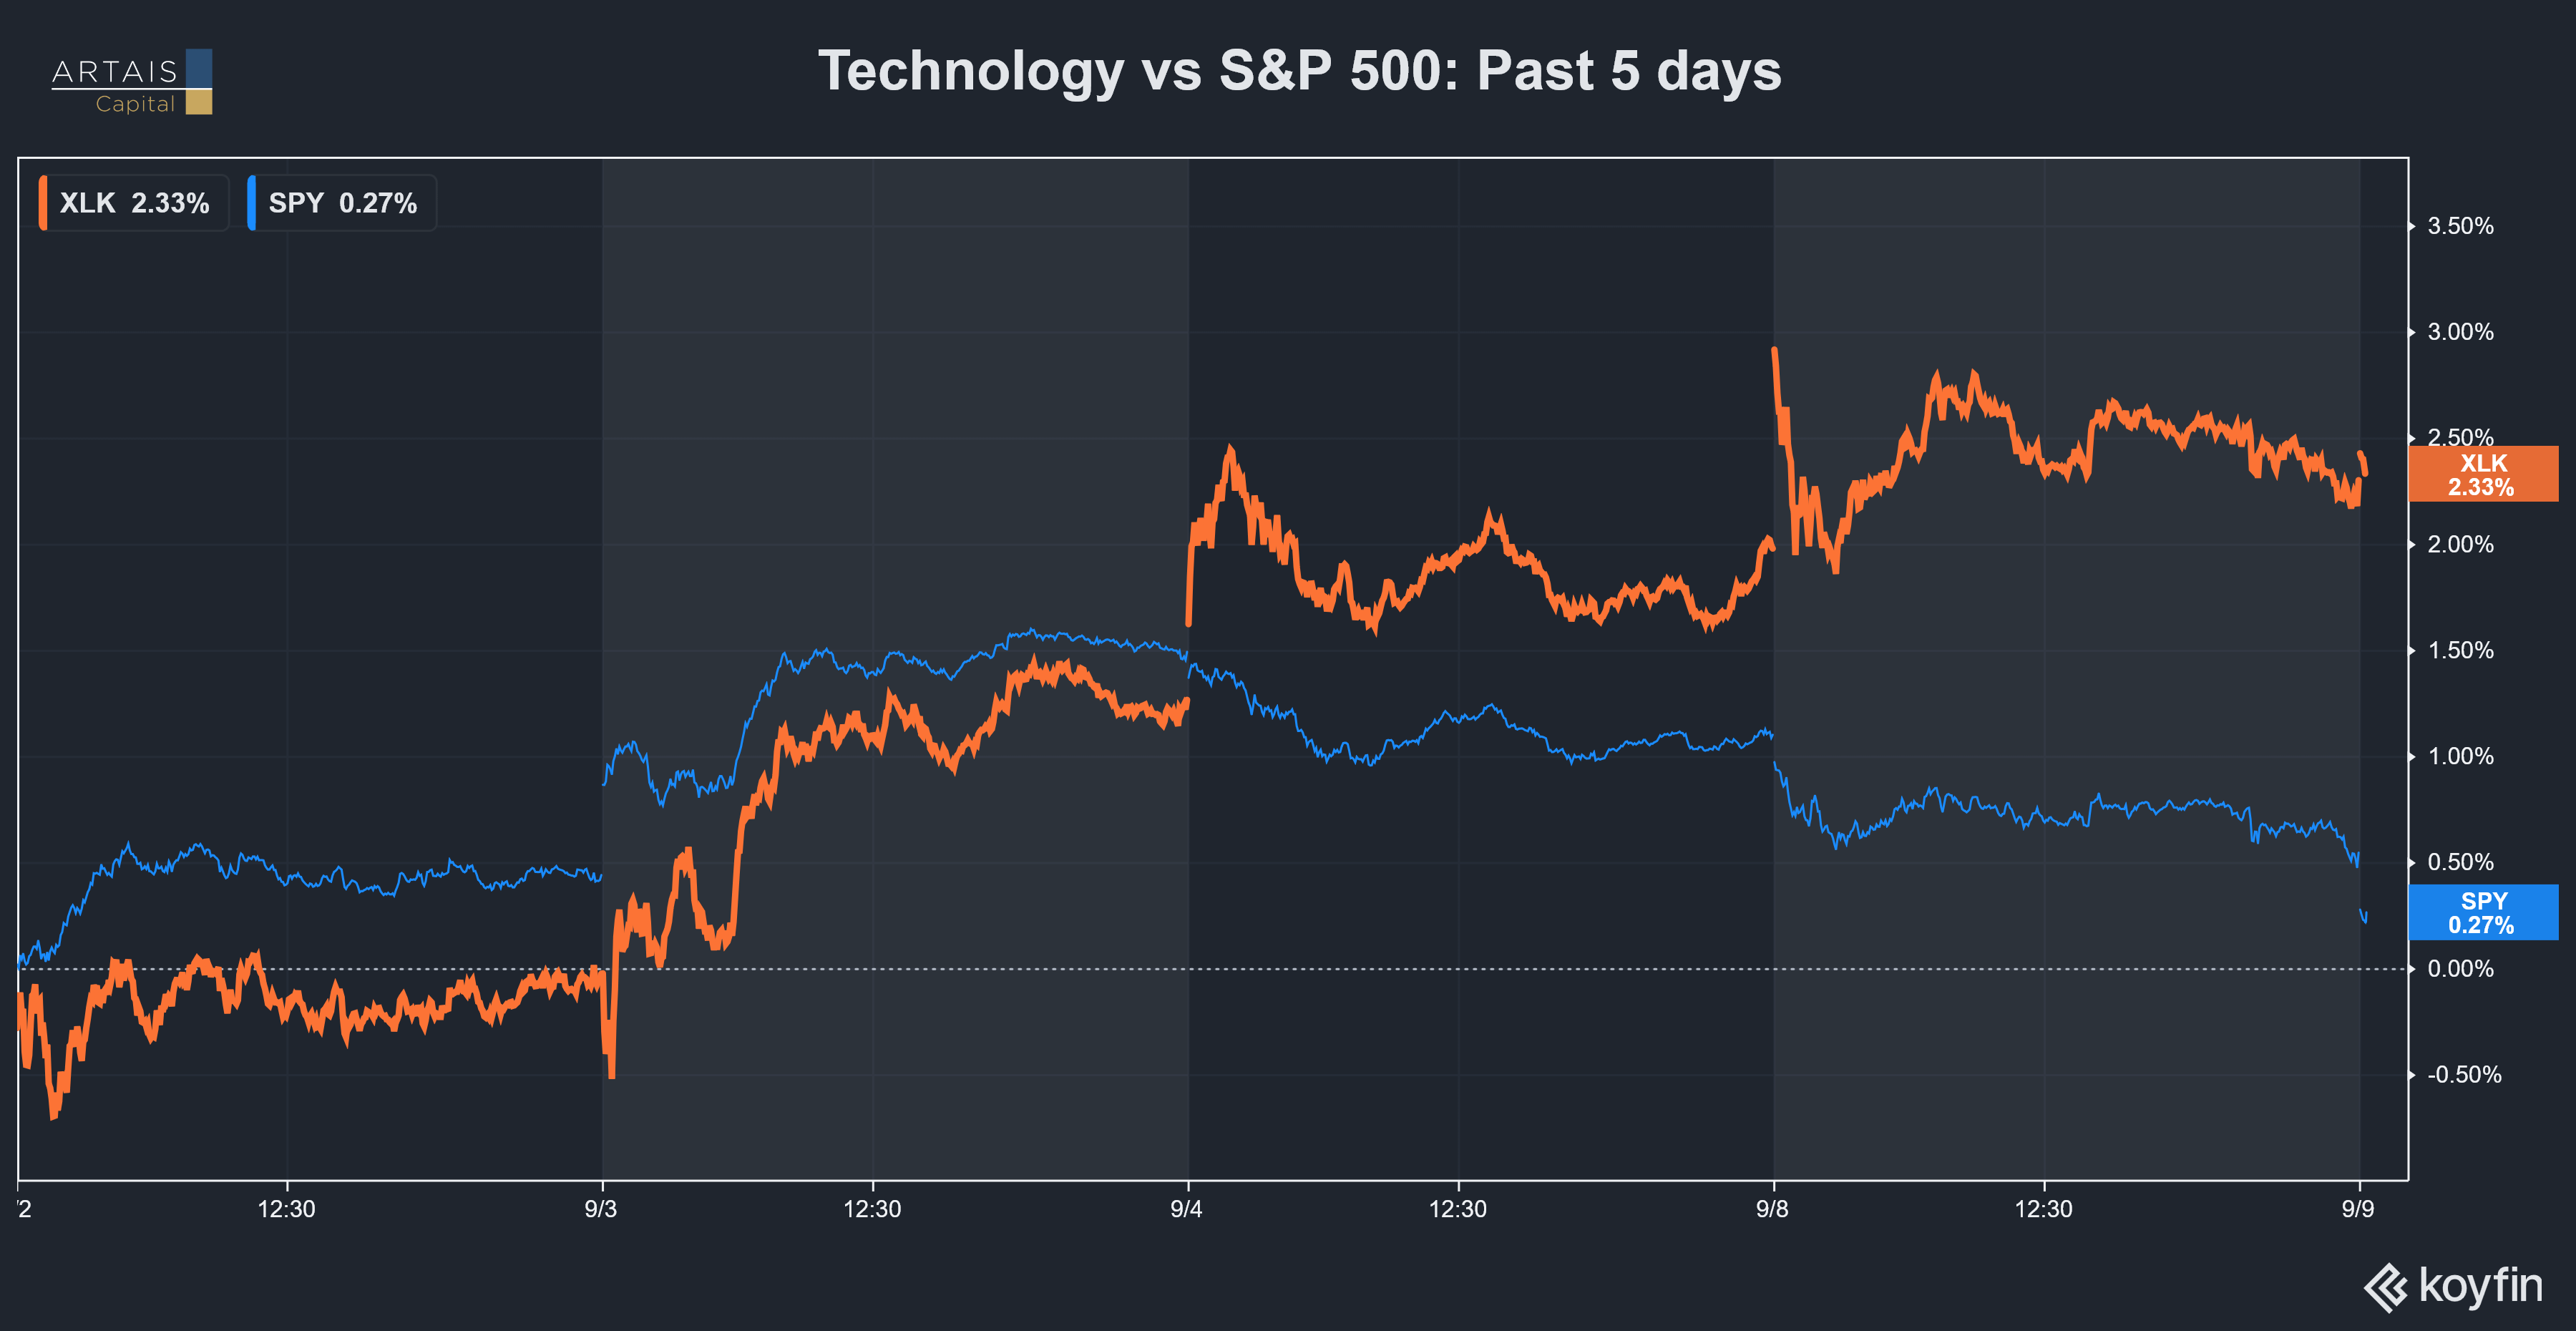
Tech is starting to outperform the S&P 500 index again
For example, looking at the Relative Rotation Graph (RRG) of the sectors that make up the index (I added SOXX and SMH to represent the semiconductor sub-sector), we can see a rotation back into the more aggressive/higher beta tech sector and away from lower beta value names.
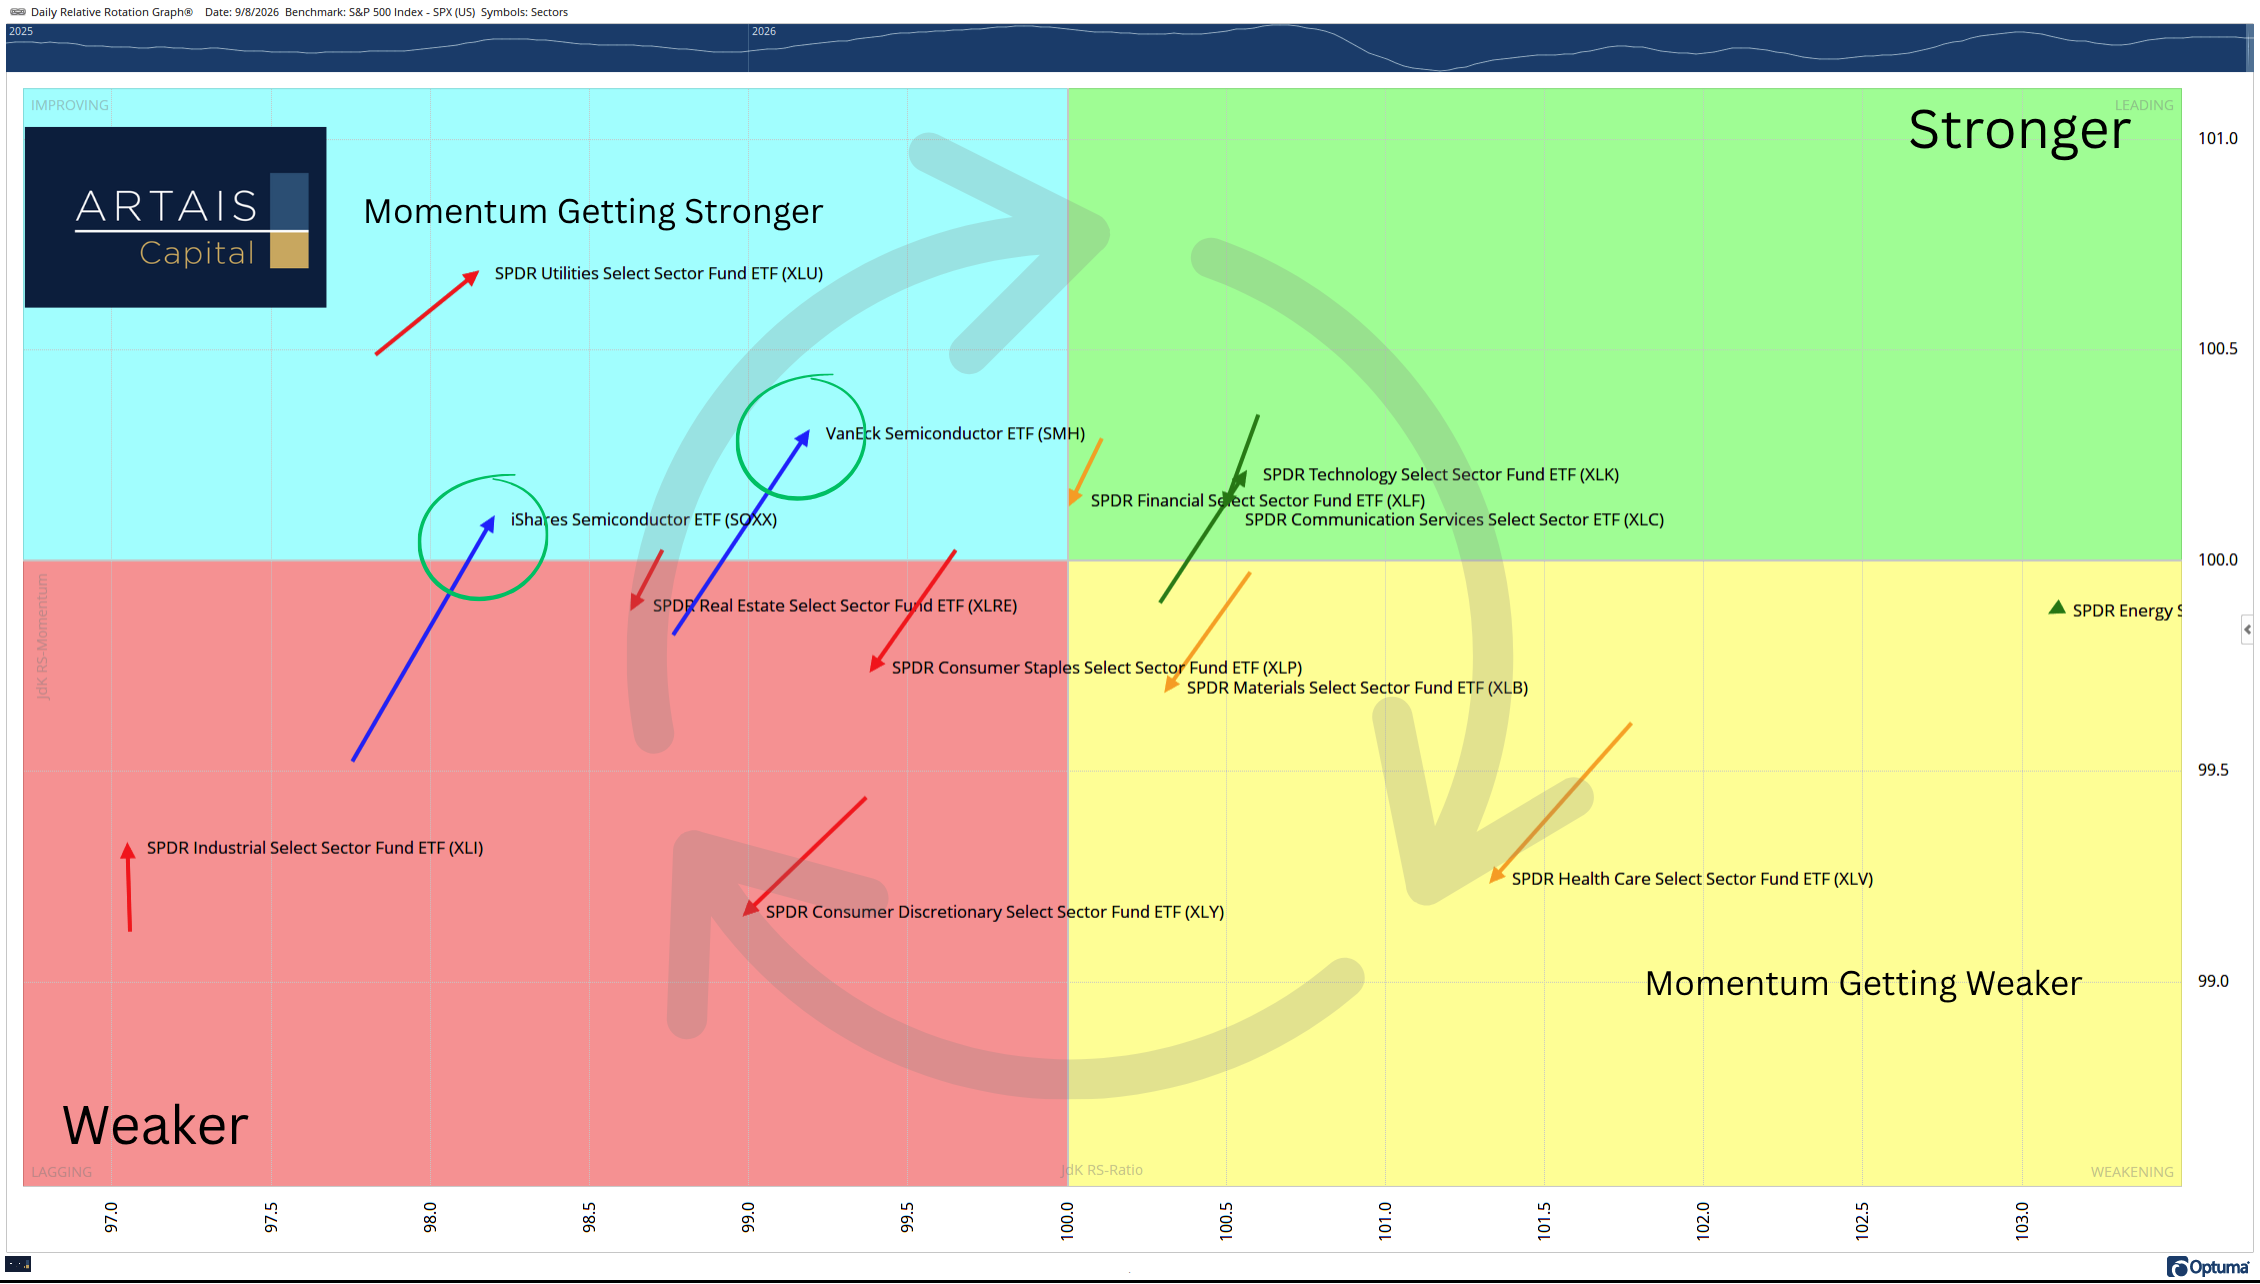
So the concern is not about the breadth of the market, but whether tech will be able to support the market.
Currently, the tech sector (I’m using the XLK ETF as a proxy) is stuck in a triangle pattern (this is the “fancy” name we technical analysts like to use):
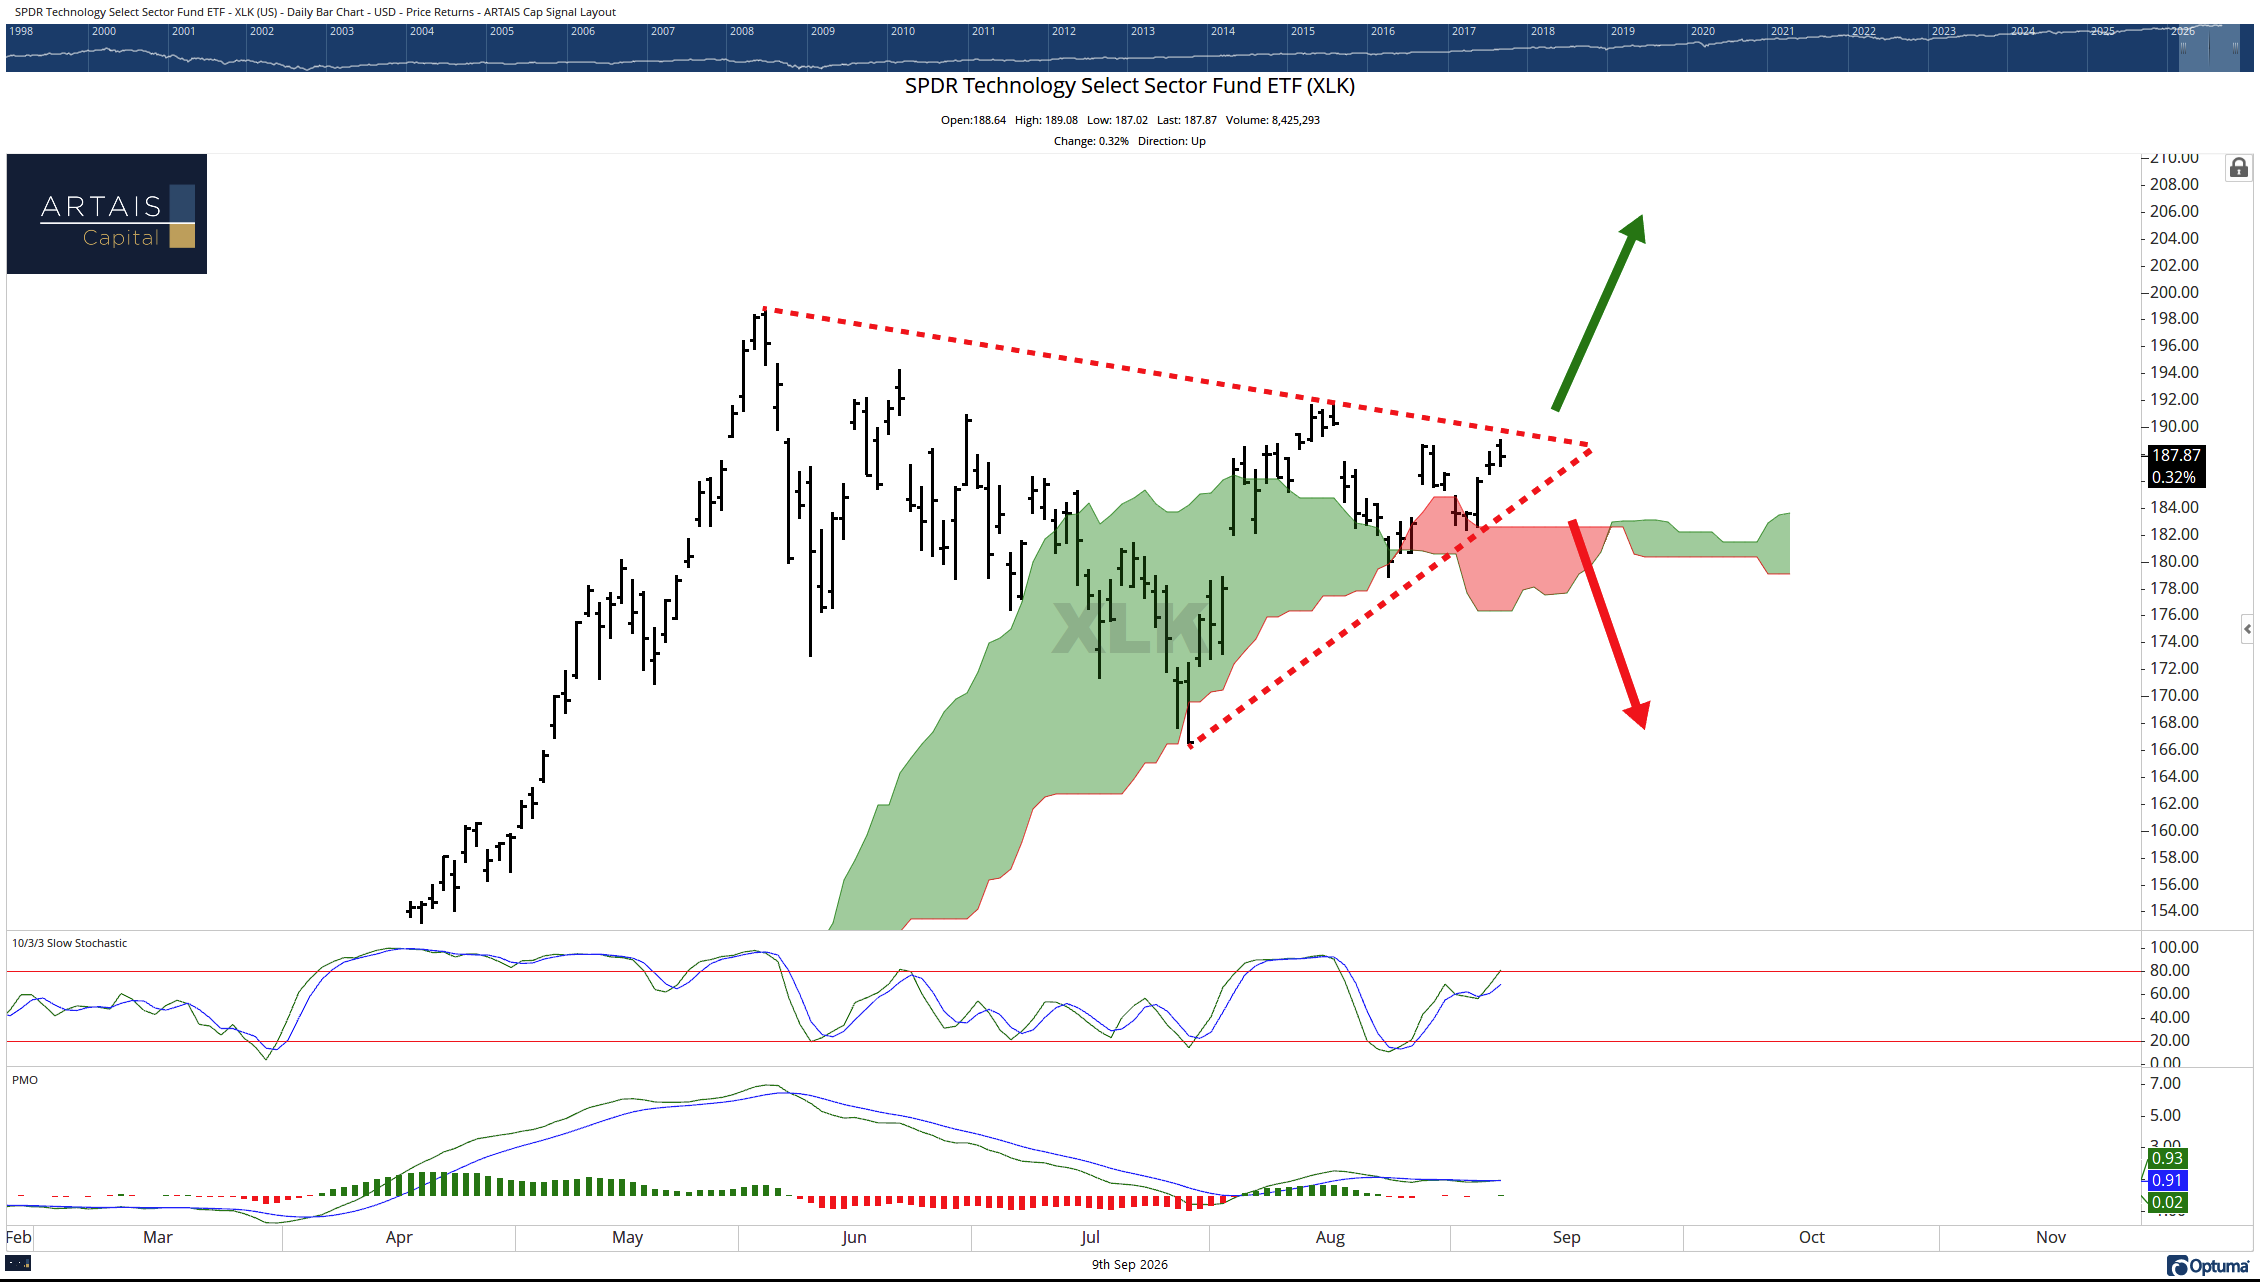
This pattern indicates indecisiveness by traders. As a result, traders will position themselves on both sides, waiting for a breakout or a breakdown.
The side that is wrong will need to unwind their trade, which pushes the price higher/lower even faster and more aggressively.
Here is an example of how this typically works: If a trader believes the pattern will lead to lower prices, they may decide to short the tech sector.
Short selling is a trading strategy in which a trader aims to profit from a decline in a security’s price by borrowing shares and selling them in the hopes that the stock price will eventually fall, enabling them to buy the shares back for less money.
-Investopedia
If they are wrong, they will want to limit their loss by closing their trade. To do this, they will need to buy the stock back.
This adds more buyers (remember supply vs demand) and pushes the price even higher.
For now, keep an eye on tech stocks to watch for a breakout or breakdown.
The section below is for paid subscribers:
Under the Hood - Current market internals, sector breadth, and intermarket analysis.
Sector Watch - Which sectors pass/fail the screening process.
Current Screen - Which stocks pass the screening process.
What I Am Watching - Stocks I am watching that are approaching a passing grade in the screening process. Plus, what changed from last week.
