
Signal vs. Noise: A Technical Look at High-Yield Spreads
Inflation and trade wars are dominating the 24-hour news cycle, but the BofA High-Yield Spread remains below the cloud. What this means for the S&P 500 in 2026.

If you’ve been watching the news, you might feel like the economy is walking a tightrope.
Between headlines about a new Fed Chief, sticky 3% inflation, and the ongoing debate over the impact of new trade tariffs, (and everything else filling the news cycle), there is no shortage of things to worry about.
Yet, if you look at the credit markets, you’ll see a very different story.
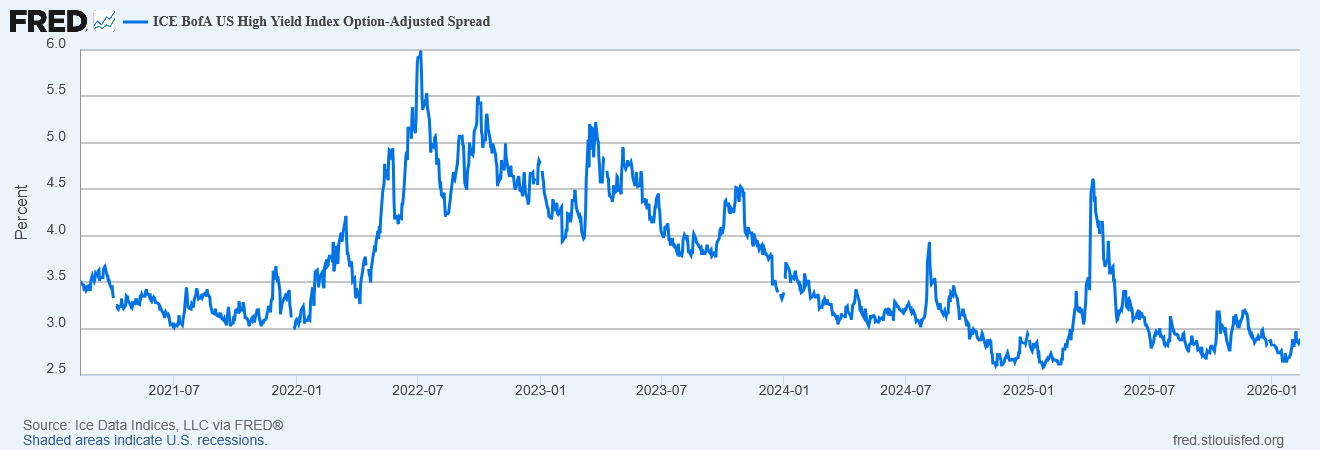
The BofA Merrill Lynch High-Yield Spread—the extra yield investors demand to hold “junk” bonds over safe government debt— remains within historical norms.
What is a High-Yield Spread?
To put it into perspective, the spread represents the “risk premium” investors want over safe-haven asset classes, like U.S. Treasury bonds.
For example:
If a 10-year U.S. Treasury bond yields 4%...
And a high-yield bond yields 8%...
The spread is 400 basis points (or 4 percentage points).
This gap compensates investors for taking on credit risk—the chance that a company might default.
When spreads are tightening (falling), it means investors are hungry for risk and confident in the economy.
When spreads are rising, investors are nervous about the economy and the ability of these high-yield bonds to avoid default.
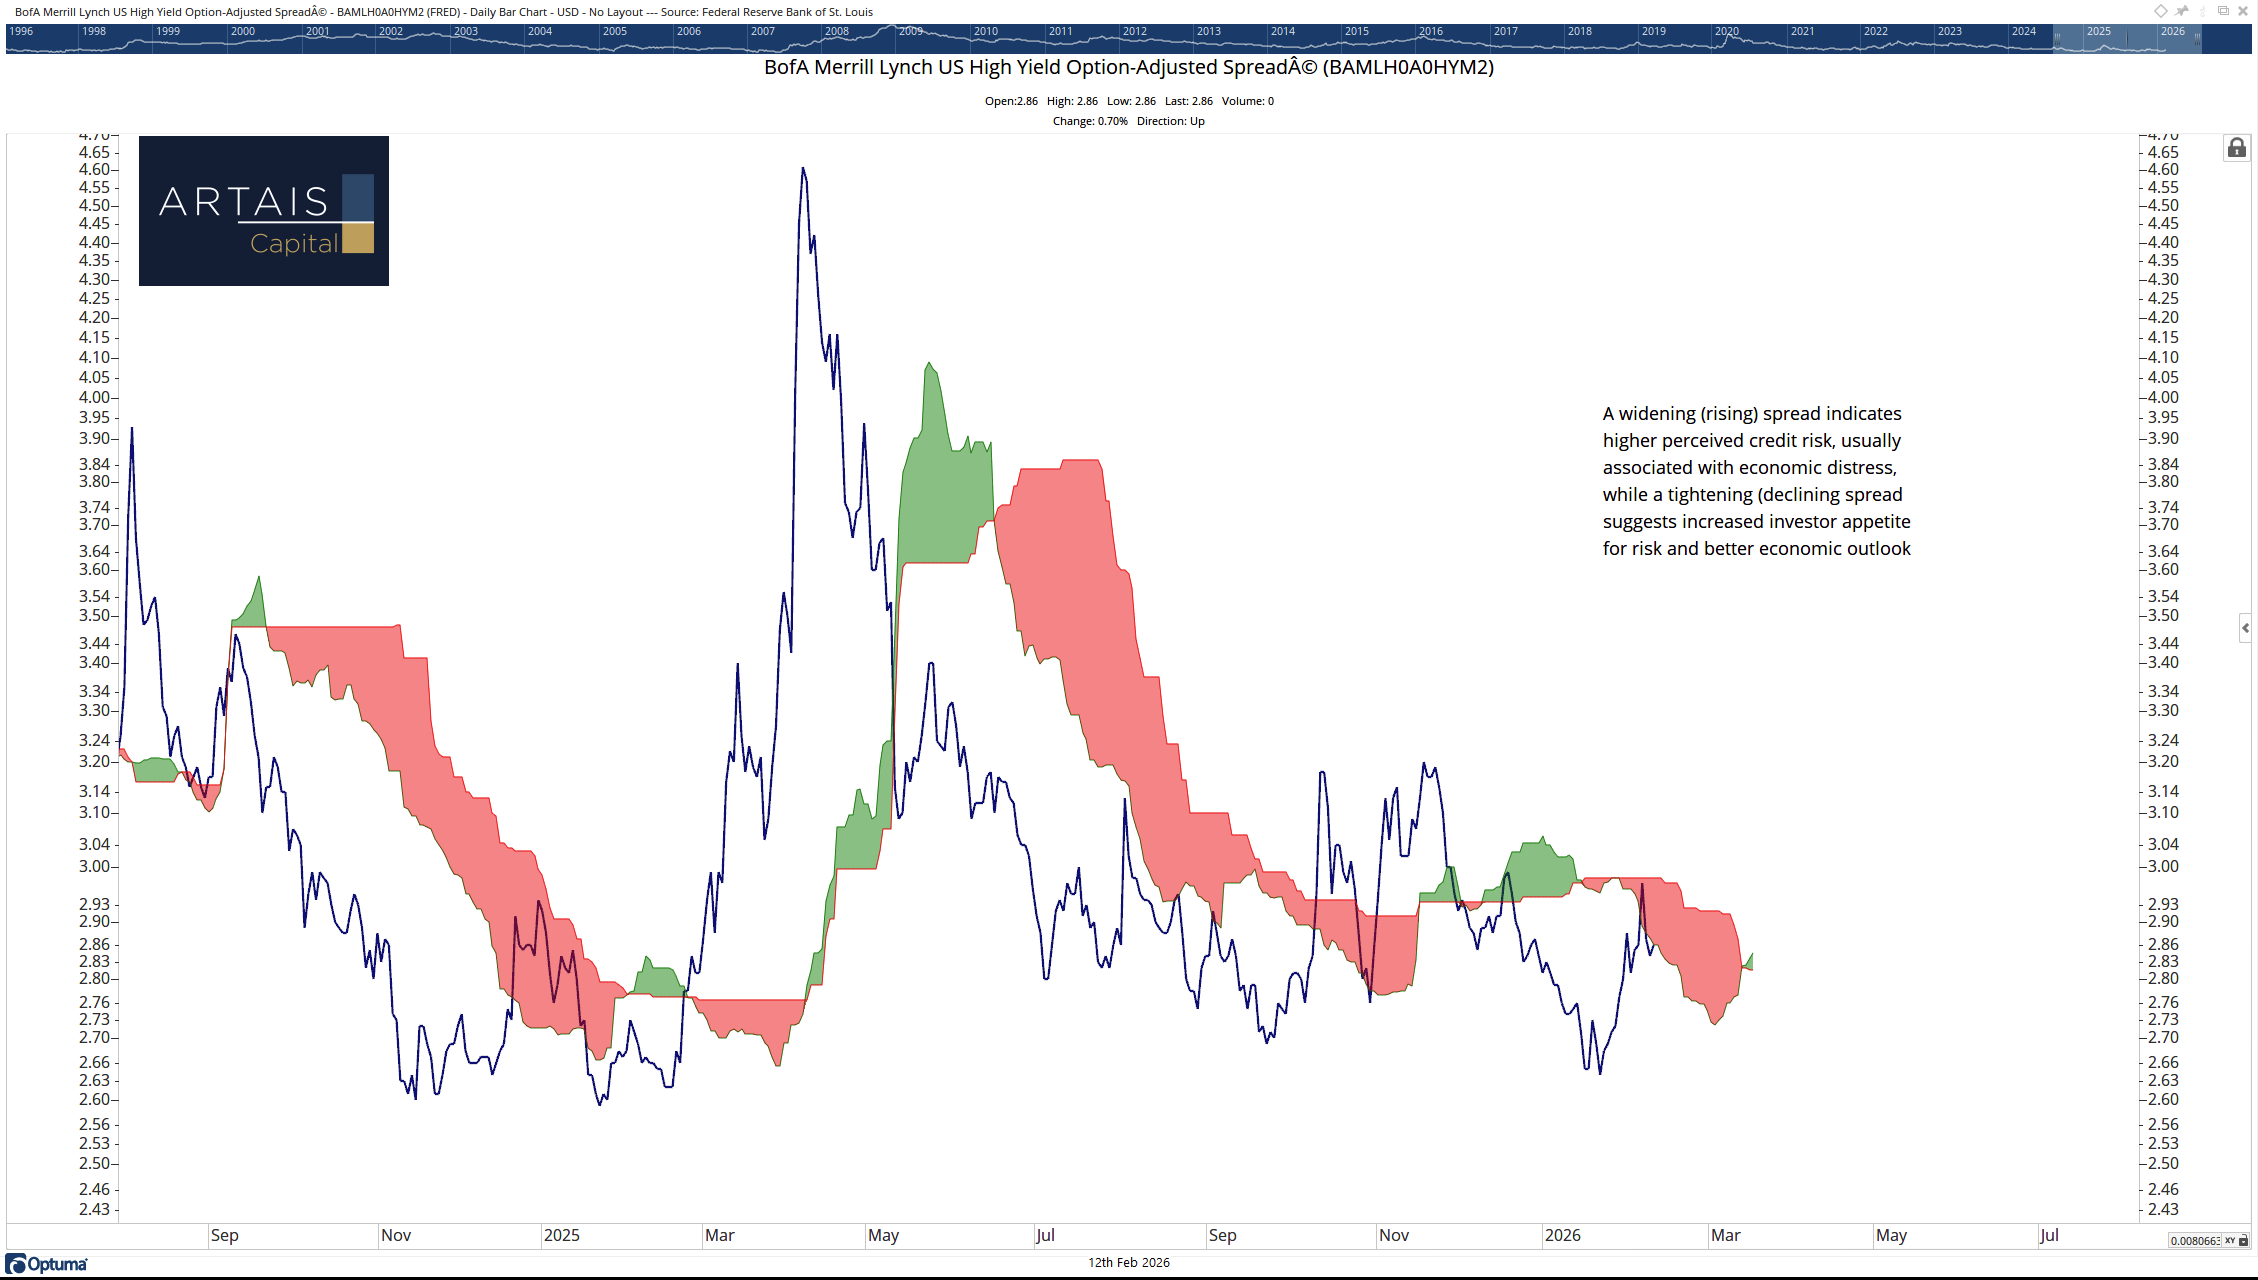
Finding Clarity in the Ichimoku Cloud
To filter out the daily noise of the 24-hour news cycle, we use the Ichimoku Cloud. It’s a technical model that helps us visualize the trend:
Above the Cloud: A rising trend. In this context, that would mean investors are starting to panic about the economy.
Below the Cloud: A declining or stable trend. This indicates a healthy, “risk-on” environment.
Currently, the high-yield spread is trading comfortably below the cloud:
What Does This Mean for Equity Investors?
Credit markets often act as a "leading indicator" for stocks. Below is an overlay of the S&P 500 index (shaded in red during periods when the spread traded above the cloud):
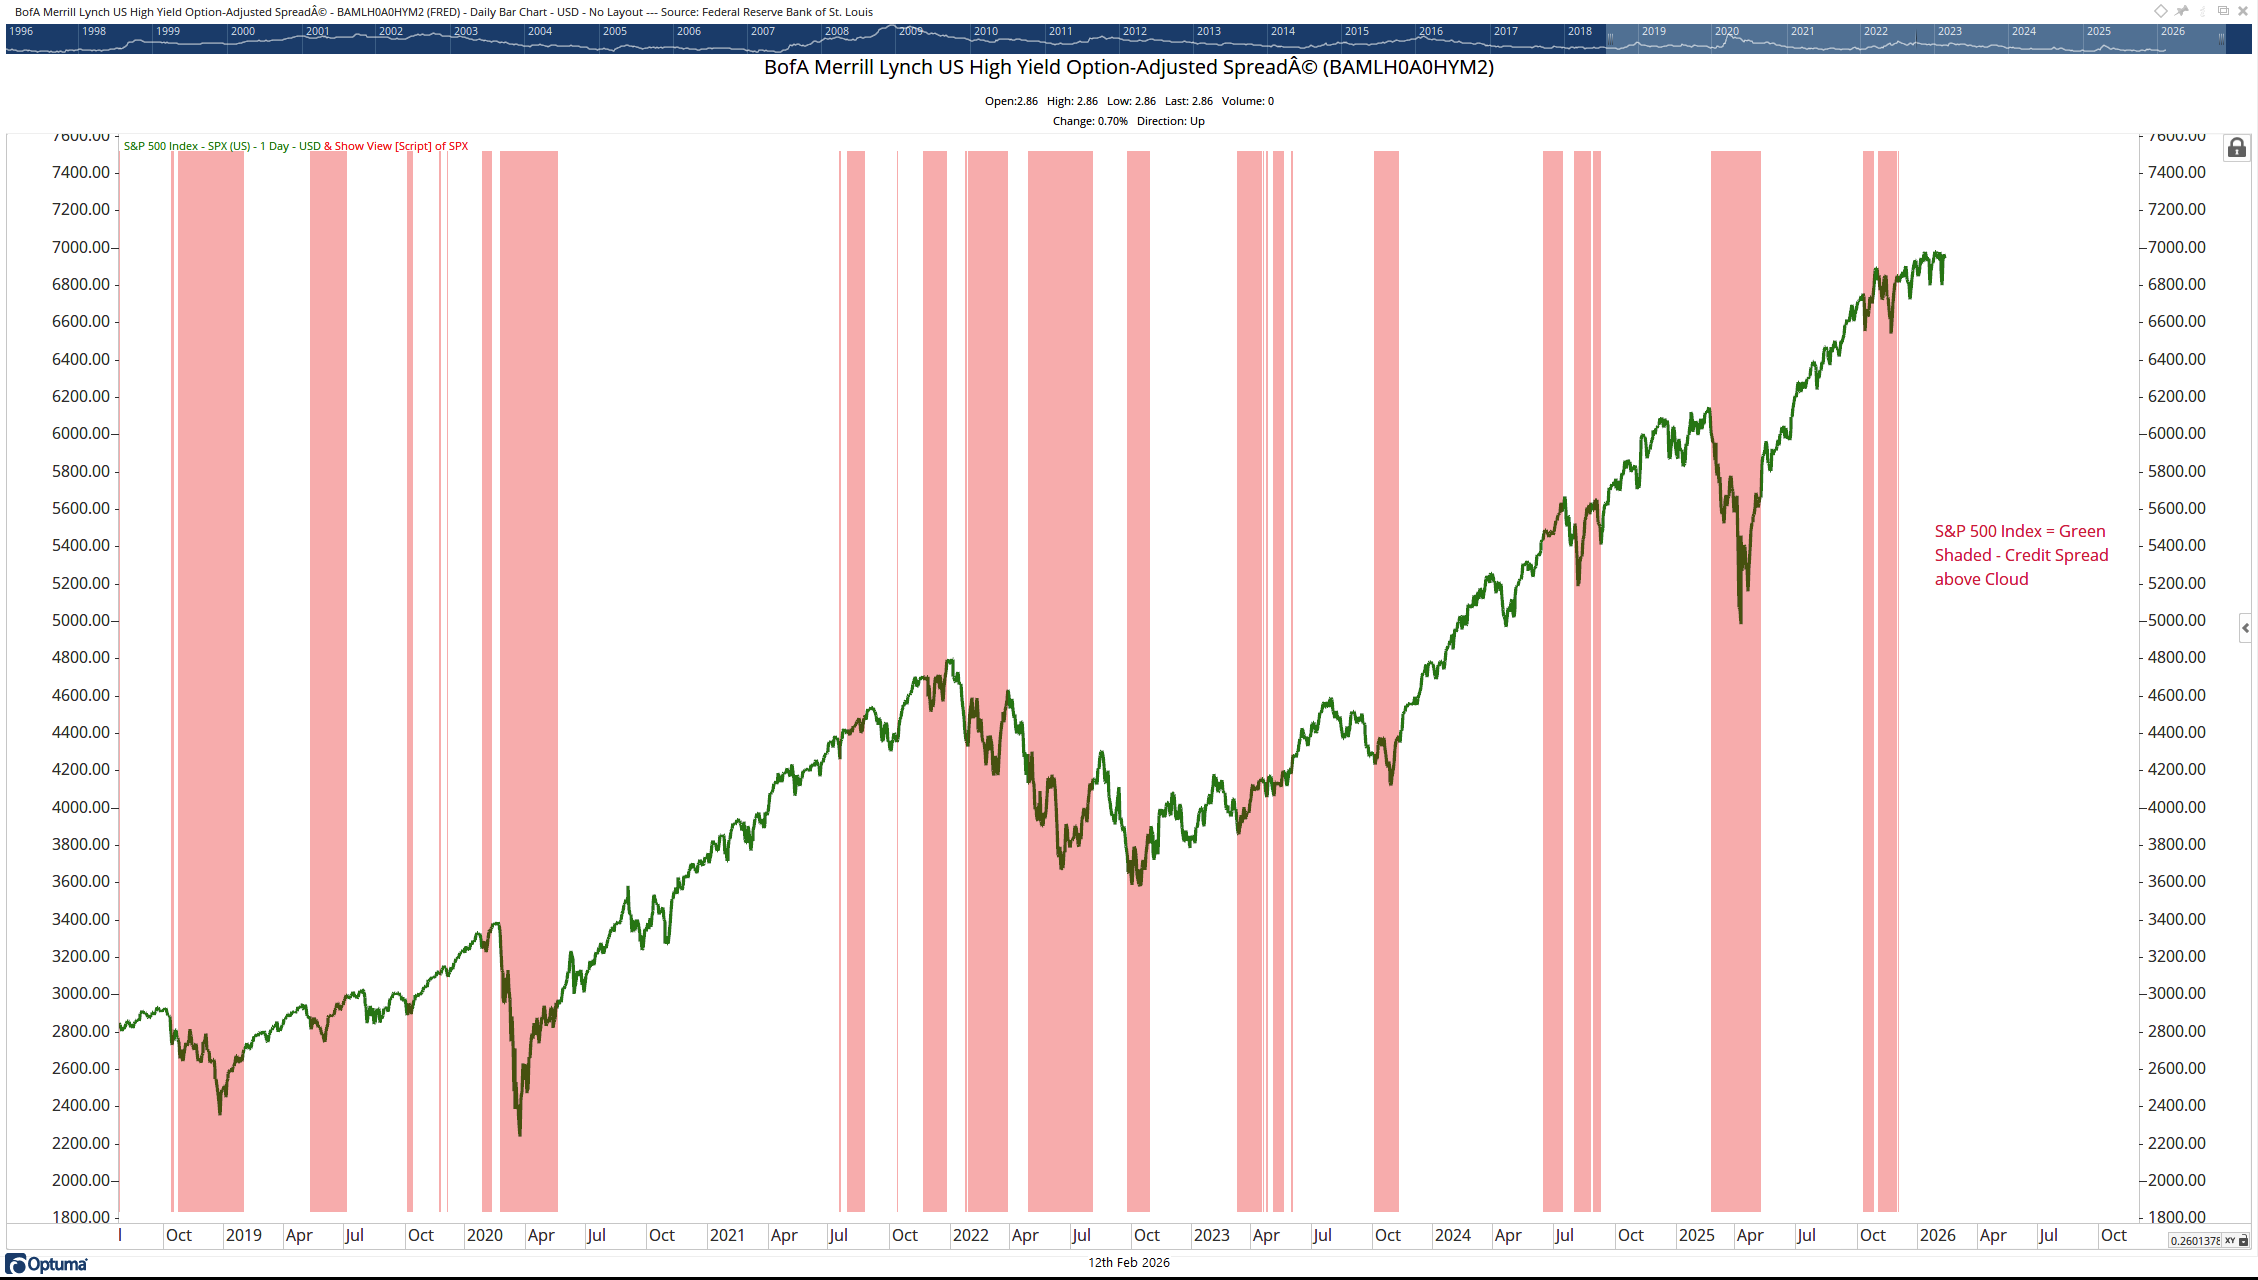
As the chart illustrates, periods where spreads rise above the cloud have often coincided with equity market downturns. While no single technical indicator is perfectly accurate or should be used in isolation, the current trend suggests that the underlying credit market foundation remains firmer than the headlines might imply.
Note: Investors should remain aware that exceptionally low spreads can also signal market complacency, leaving little room for error if economic conditions shift.
John Rothe
Founder, Portfolio Manager
ARTAIS Capital
2/12/26
—————-
Disclosure: This post is for informational purposes only and does not constitute investment advice. Past performance is not indicative of future results. Technical analysis is one of many tools used in market evaluation and should not be the sole basis for investment decisions.