
The Midterm Cycle: What to Expect from the Market Between Now and November
A look at the catalysts, cycles, and risks that will shape the US stock market into the 2026 midterm elections.

We’re at the July 4 turn of a midterm election year, and the market is telling a more interesting story than what the S&P 500 index is telling us.
As of the July 1 close, the S&P 500 was up 9.3% on the year. That’s a respectable first half. But it also badly undersells what’s happening beneath the surface:
Small caps are up 21.4%.
Value is beating growth by twelve percentage points.
The equal-weight S&P 500 is outrunning the cap-weighted version of the index.
International and emerging markets are keeping pace or better.
This isn’t the narrow, MAG7-stocks-carry-everything market of 2023 and 2024. Leadership is broadening, and that changes the outlook for what the next four months can deliver.
With the index near record highs, a Fed that’s leaning hawkish, and a midterm election looming, is this the moment to reach for the exits?
My answer, as always, is that we don’t guess. We analyze the data and let the rules decide. So let’s look at the data.
The Election Cycle: How Midterm Years Have Historically Performed
So let’s start with the election calendar, because it has a well-documented pattern. Since 1950, the midterm year has been the weakest of the four-year presidential cycle.
The Dow has averaged under 5% in these years, versus roughly 10% in pre-election years.
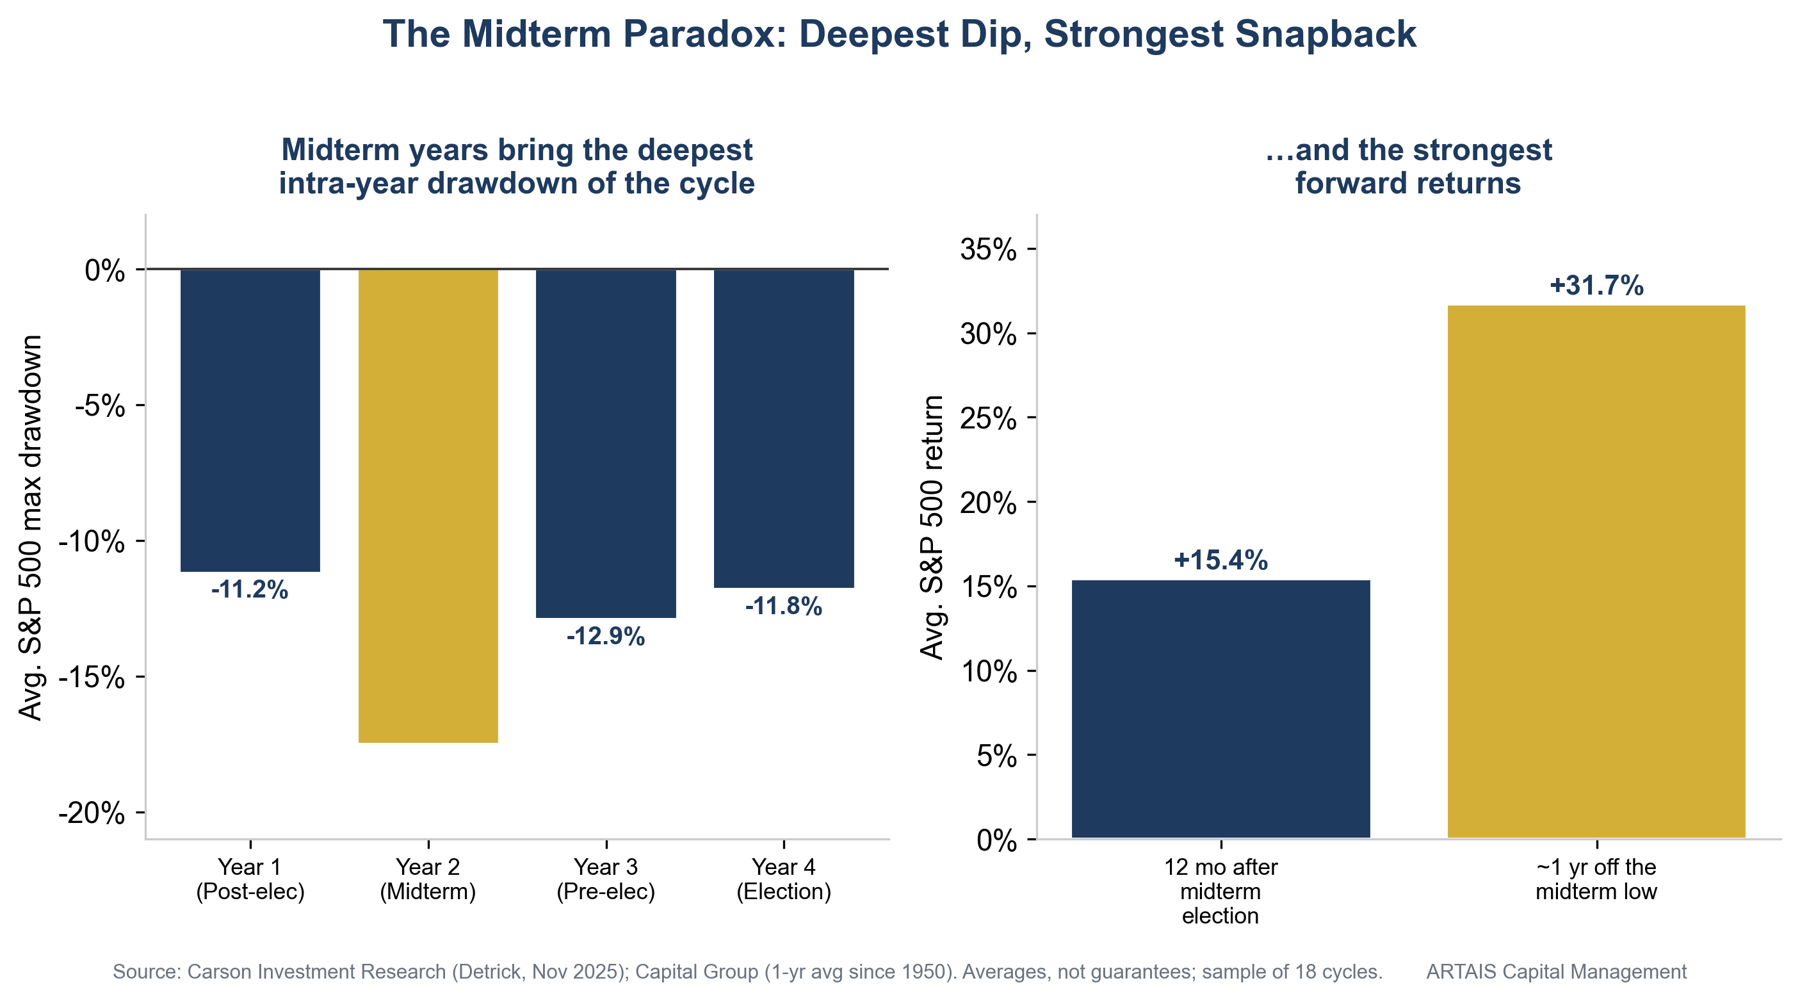
More important for anyone deploying capital right now: the midterm year also carries the deepest average intra-year drawdown of the entire cycle, about 17.5%, versus 11 to 13% in the other three years.
“Intra-year drawdown” means the peak-to-trough drop inside a single year, and 17.5% is an average across cycles, not a forecast.
The under-performance also tends to cluster in exactly the window we’re entering. The second- and third-quarter stretch is historically the soft spot, with the S&P averaging roughly −1.5%.
Midterm-year lows have arrived late: the average bottom lands around August 18 and the median around September 29.
Here’s the part that I think matters the most: The midterm low has, historically, set up the strongest run in the election cycle.
The stretch from the fourth quarter of the midterm year through the following spring, what the Stock Trader’s Almanac calls the “sweet spot,” has averaged about +20% for the S&P 500.
One year removed from the midterm-year low, stocks have never been lower, and have gained roughly 32% on average.
And in the twelve months following the midterm election itself, the S&P has averaged +15.4% AND was positive in all 18 cycles since 1950.
The Positive Catalysts: What Could Carry the Markets Higher
Seasonality is a tendency, not a mechanism. What actually moves markets is earnings, liquidity, and positioning, and with that in mind, I find the fundamental backdrop does the real work.
1. Earnings are still growing, and fast. Analysts expect S&P 500 earnings to grow about 23% year over year in the second quarter. Estimates were revised up during the quarter, not down. Q2 reporting season kicks off July 14 with the big banks, and that will be the first hard read on whether the fundamentals are keeping pace with the price.
2. The AI capital-spending cycle is enormous, and still accelerating. The major hyperscalers are on track to spend roughly $725 billion on capital expenditures in 2026, up about 77% from 2025. That spending is the revenue line for a long chain of semiconductor, equipment, and power companies, which is why chip and semi-equipment names dominate this year’s small-cap leaderboard. It’s a genuine tailwind. As I’ll argue in the Skeptic’s Corner, it’s also the market’s single largest concentration risk.
3. The economy isn’t rolling over. First-quarter 2026 real GDP came in at +2.1%, revised higher, with business investment up more than 10%. Unemployment was 4.3% in May. However, this isn’t a boom. Today’s weaker jobs report is starting to change the market’s narrative.
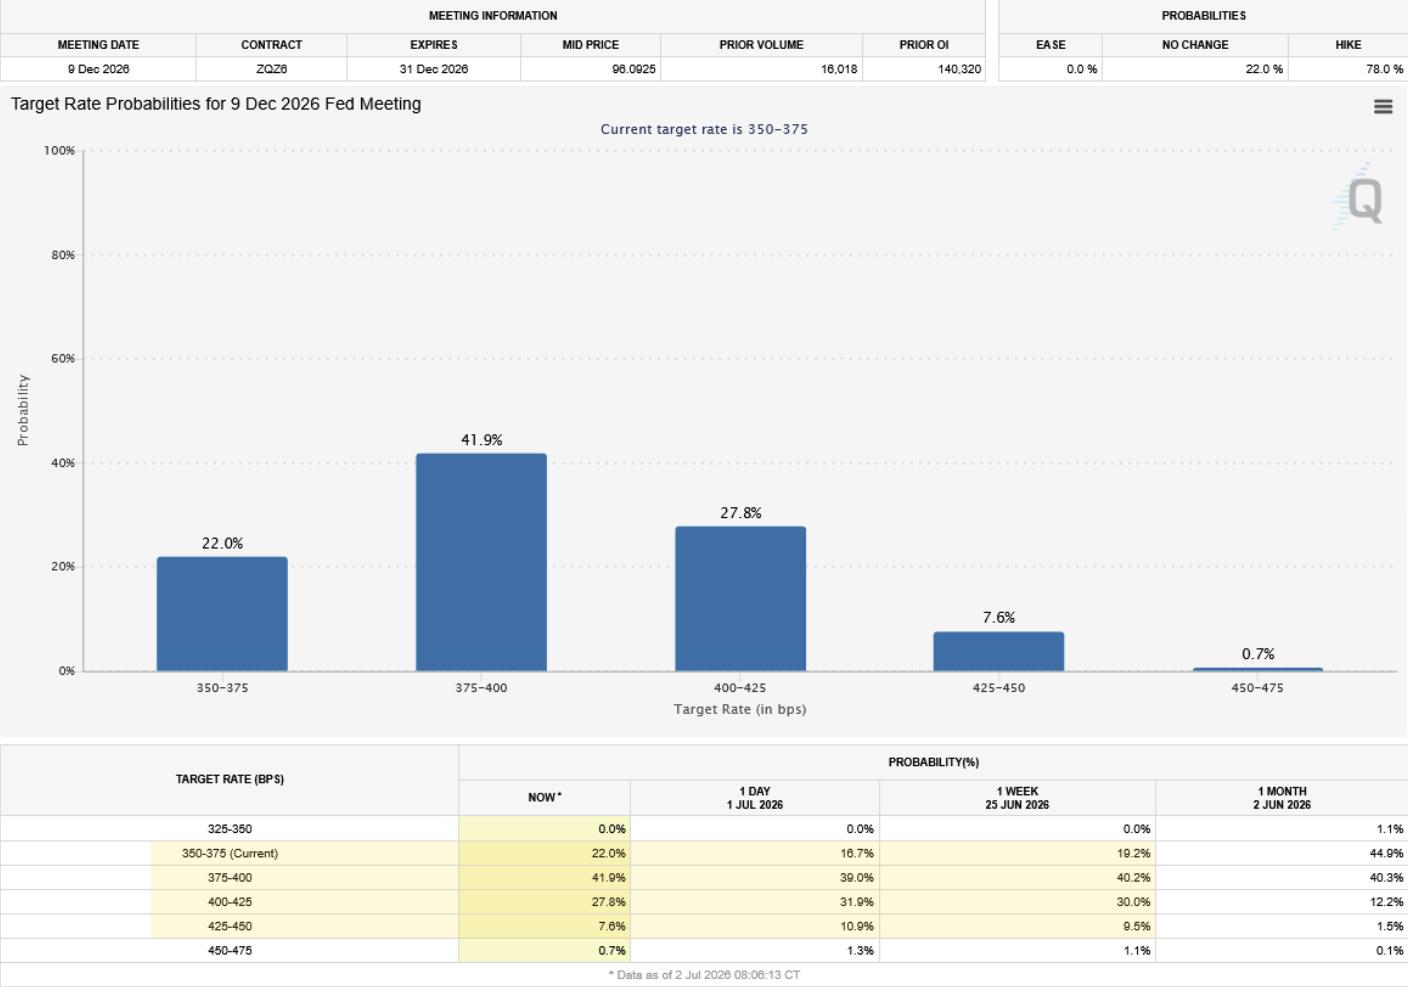
The Fed wants lower inflation. For the past few weeks, the markets have been pricing in higher interest rates. After this morning’s jobs report, the probabilities of 1, or even 2, rate hikes this year are starting to fall. This is bullish for stocks.
4. The seasonal and political calendar turns friendly this fall. As noted above, the historically strongest window of the four-year cycle opens in the fourth quarter of the midterm year. Layer on the familiar “gridlock” theme, where divided government has historically coincided with solid equity returns, and the post-election period has often brought relief rather than risk.
Headwinds: Negative Catalysts to Watch For
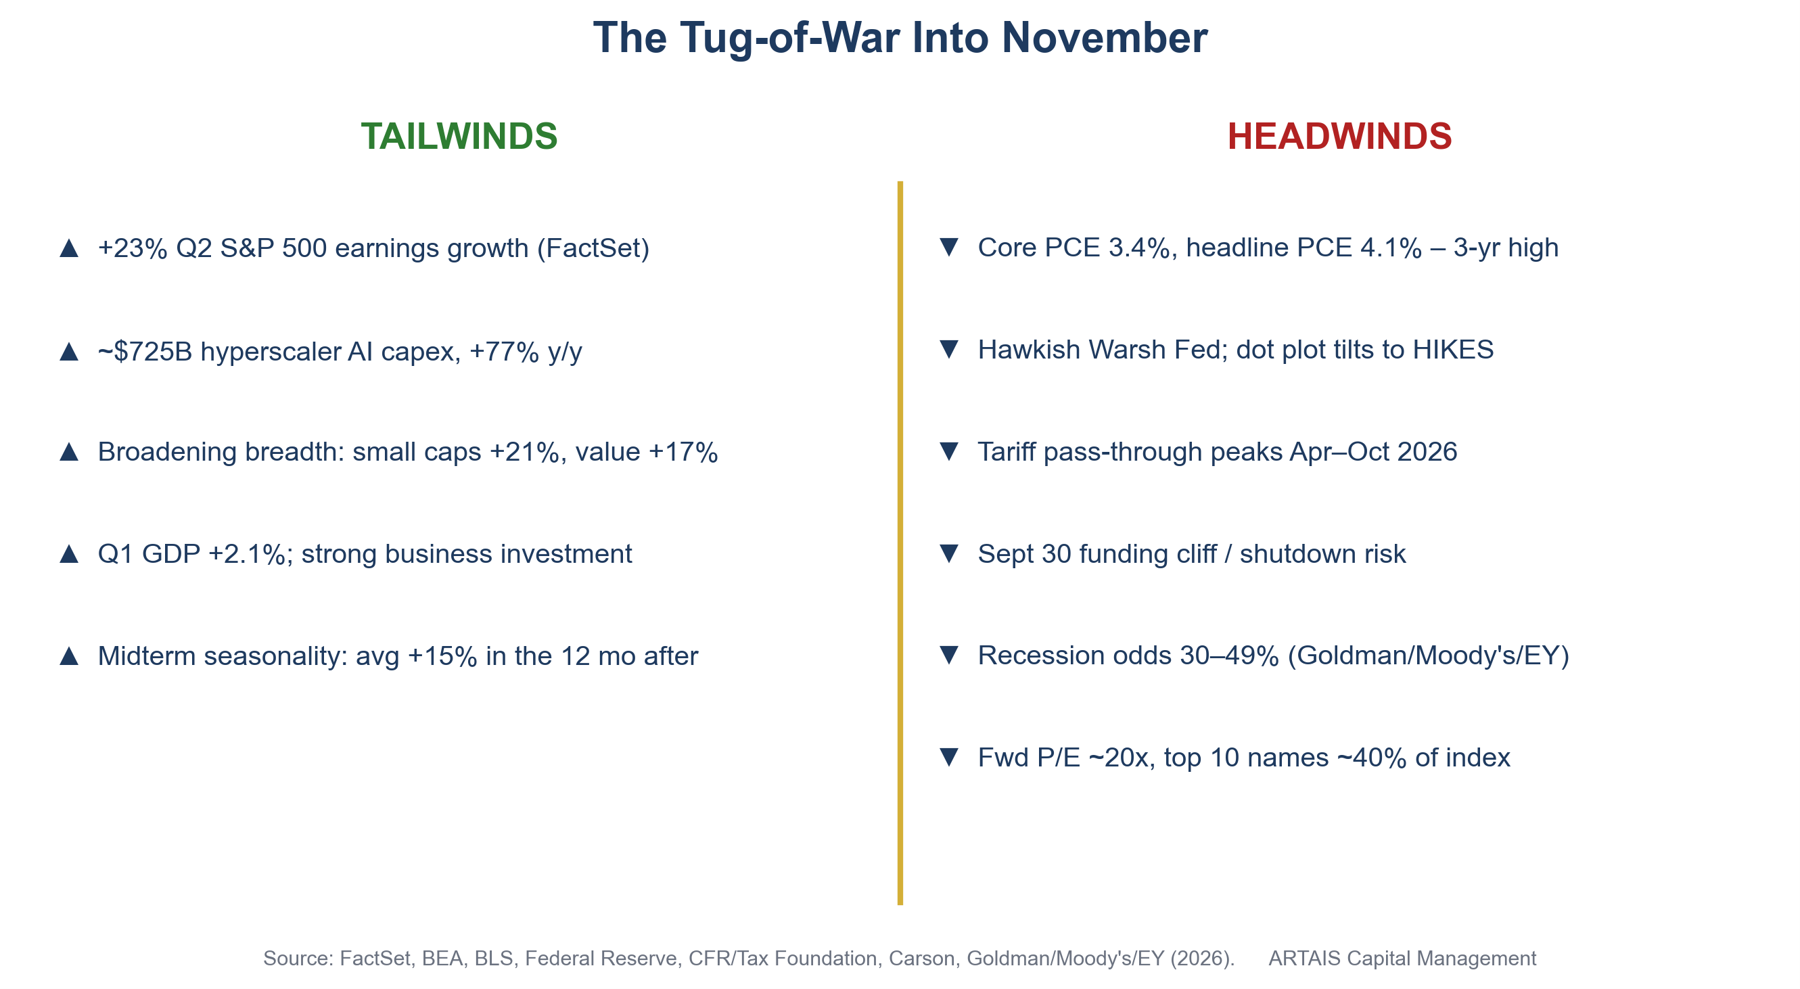
1. Inflation is re-accelerating, and the Fed has noticed. This is the big one. Headline PCE, the Fed’s preferred inflation gauge, ran at 4.1% year over year in May, its highest in three years.
The Fed did not change rates on June 17, but the updated dot plot, the committee’s own projection of where rates are headed, leaned toward hikes rather than cuts, with roughly half of policymakers open to higher rates this year.
Under new Chair Kevin Warsh, the message has been explicitly about getting inflation back to 2%. While, as I mentioned above, weaker economic data may keep the Fed at bay, as a weaker consumer will lessen the upward price pressures (they have less money to spend, which means less demand). However, strong inflation data could still force the Fed’s hand into aggressively raising rates.
2. Tariff pass-through is landing now. The average effective U.S. tariff rate rose to roughly 7.7% in 2025, the highest since 1947. Economists broadly expect the consumer-price pass-through to peak between April and October 2026, squarely inside our window. That’s a live upside risk to the very inflation prints that constrain the Fed.
3. A fiscal cliff sits on September 30. Government funding expires September 30. With FY2026 having already opened with the longest shutdown in modern history, another funding fight into the fall is a real possibility, and it lands weeks before the election. Longer term, federal debt is projected to climb from about 101% to 120% of GDP, which puts pressure on long-term bond prices.
4. Geopolitics remains an oil-shaped tail risk. The Middle East escalation earlier this year drove crude sharply higher before it retraced, and the Fed explicitly cited “elevated uncertainty” tied to the region in its June statement. WTI is back around $67 and Brent near $70, both still up roughly 15 to 17% on the year, but this escalation is a reminder of how quickly an energy shock can reignite inflation and compress valuations.
5. Recession risk isn’t zero, and valuations leave little room for error. Twelve-month recession odds range from about 30% at Goldman Sachs to 40% at EY-Parthenon to 49% at Moody’s Analytics. Meanwhile, the S&P 500 trades near 20 times forward earnings, above its five-year (19.9x) and ten-year (18.9x) averages. Higher-than-average multiples don’t cause corrections, but they can magnify the damage when a negative catalyst arrives.
Under The Hood: Rotation, Breadth, and Where the Market Leadership is Heading
The most constructive development of 2026 is the one the index level hides: the market is broadening.
For two years, a handful of megacap platform stocks did the heavy lifting. In 2026, leadership has rotated, and rotation is generally a sign of a healthier, more durable advance.
Technology still leads on a sector basis, but the character of that leadership has shifted.
It’s moved from the megacap tech names toward semiconductors, AI hardware, and the industrial and energy complexes that feed the AI build-out.
Energy is up nearly 20%, industrials nearly 19%, materials 13%.
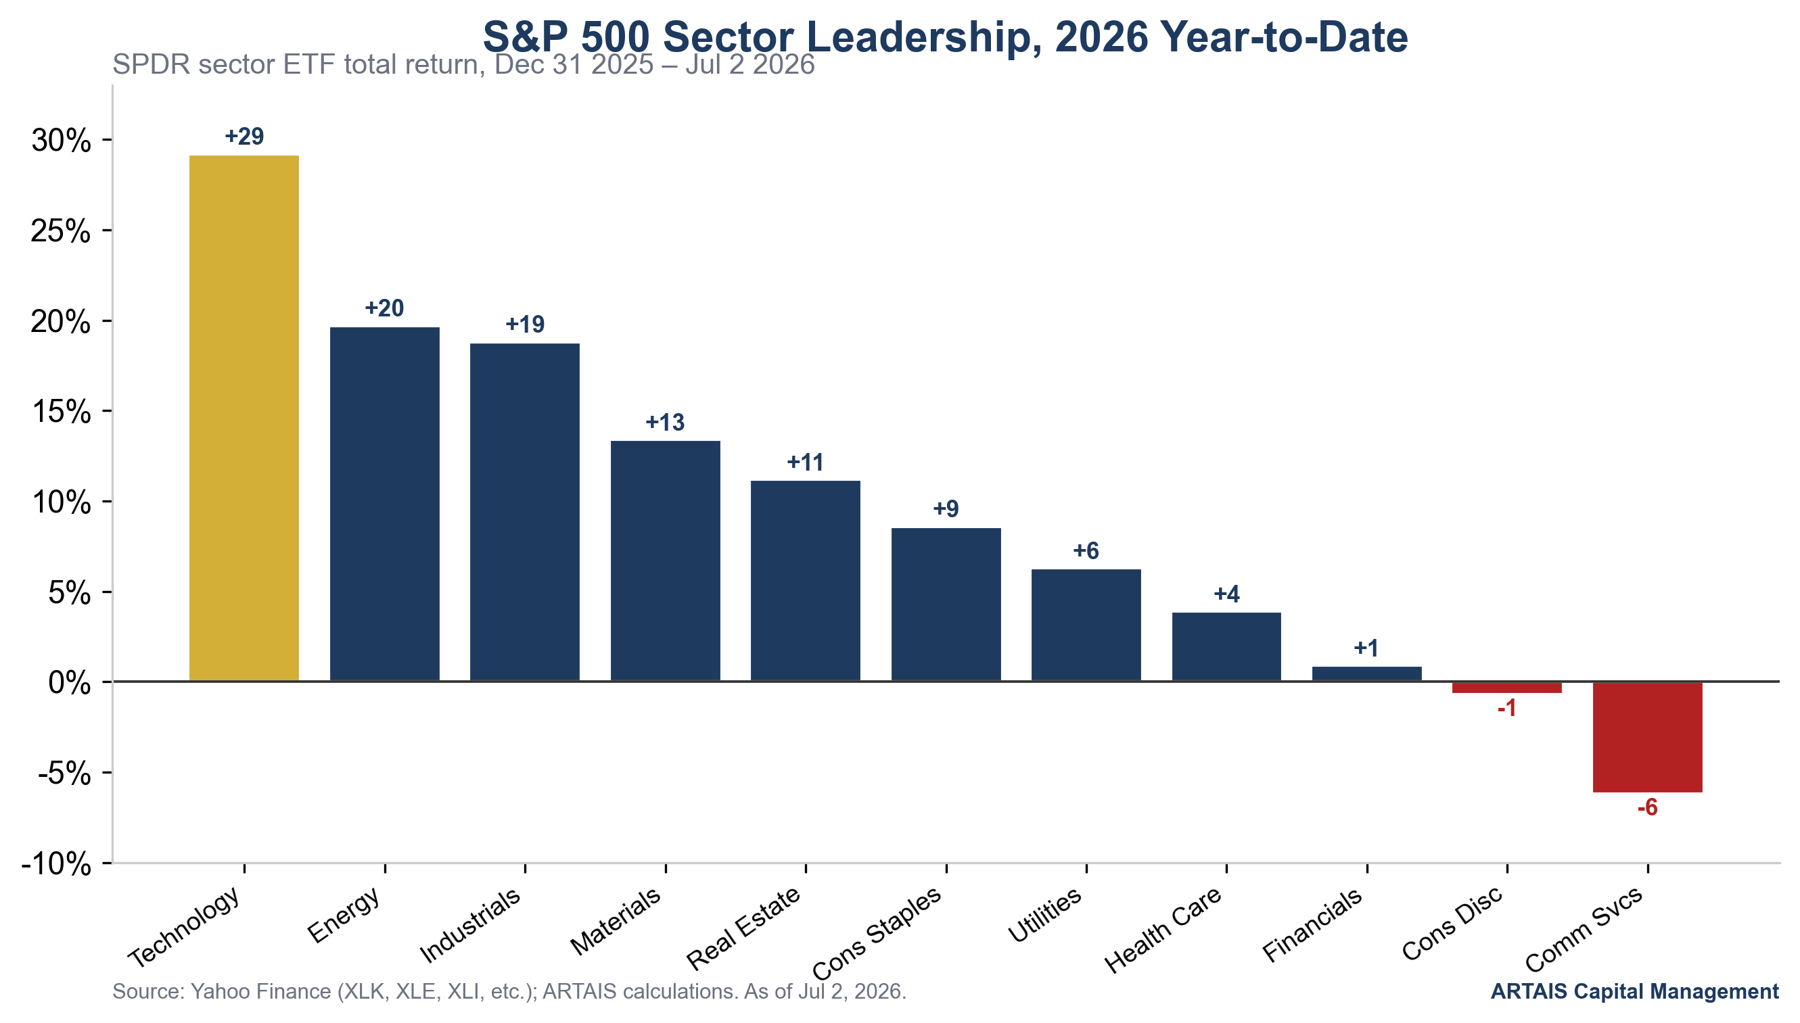
On the other side, communication services (home to several megacap growth names) is the worst sector, down 6%, and consumer discretionary is roughly flat.
That split is exactly why the broad Russell 1000 Growth index is up only 4% while Russell 1000 Value is up 17%.
The breadth signals reinforce it. The equal-weight S&P 500 (+12.3%) is beating the cap-weighted index (+9.9%), which tells you the average stock is outperforming the handful of giants at the top.
Small caps are having their best first half since 1991, with consensus 2026 earnings growth for the Russell 2000 climbing to roughly 38%.
What I’m Watching Between Now and November
This is the checklist I’ll be running against our models:
· July 14: June CPI and the start of Q2 bank earnings. The first real test of both the inflation trend and the fundamentals.
· July 28–29: FOMC. A hold is expected. Watch the language on inflation and the balance of risks more than the decision itself.
· Mid-to-late July: peak Q2 earnings. Are the roughly 23% growth estimates and the AI-capex guidance holding up?
· September 15–16: FOMC with a fresh dot plot. The most important policy event of the window. Does the Fed still lean toward hikes?
· September 30: government funding deadline. Shutdown risk, weeks before the election.
· August through September: the seasonal soft spot, historically where midterm-year lows form. Treat weakness as a shopping list, not a fire alarm.
· Early November: the midterm elections. History favors the twelve months that follow, especially if the result delivers divided government.
· All along: the inflation path, the dollar, and oil. These three are the transmission mechanism for nearly every risk above.
The Skeptic’s Corner
The seasonal edge may be a story we tell ourselves. U.S. Bank looked at the same midterm data and concluded the pattern is statistically insignificant: a sample of just 31 elections across 125 years, with outcomes ranging from losses over 30% to gains near 50%.
Their view is that the economy, not the election calendar, drives returns. And the recent exceptions are real. 2018 and 2022 were both midterm years with vicious declines. Seasonality is a probability tilt, not a schedule.
The market is priced for an easing cycle that may not come. Equities near 20 times forward earnings are implicitly assuming the Fed cuts into a soft landing. Headline PCE at 4.1% and a dot plot tilted toward hikes describe a different world. If the market has to reprice from “cuts coming” to “higher for longer, or higher from here,” the correction won’t wait for a seasonal script.
Concentration cuts both ways. The broadening I praised above is encouraging. But the S&P 500 index is still roughly 40% in ten names, and the AI-capex boom powering earnings is increasingly funded by debt and running well ahead of AI revenue. If that spending cycle even pauses, the cap-weighted index has a long way to fall before the “average stock” cushions it.
In Summary
The weight of history says a midterm year serves up its deepest drawdown in the summer-to-fall window we’re now entering, and then, more often than not, its best returns in the year that follows.
The fundamentals (roughly 23% earnings growth, a $725 billion capex cycle, 2% GDP) argue for staying invested.
The risks (re-accelerating inflation, a hawkish Fed, tariffs, a funding cliff, stretched valuations) argue for staying disciplined.
Those two statements aren’t in conflict.
They’re the whole point of a rules-based, adaptive approach. You don’t have to choose between optimism and caution when your process is built to lean into strength and step back from deterioration on signals, not on feelings.
If the seasonal soft spot arrives, we’ll treat it the way the data suggests it has usually deserved to be treated: as an opportunity that shows up on schedule and gets bought by the patient.
I’ll be watching the July inflation print and the September Fed meeting most closely. Everything else is noise until those two tell us whether the market’s priced-in optimism survives upcoming inflation data.
Sources
· Market levels and returns: ARTAIS calculations from Yahoo Finance adjusted closing prices, December 31, 2025 base through the July 1, 2026 close.
· Seasonality, drawdown, and off-the-low figures: Carson Investment Research (Ryan Detrick, “Thinking About 2026,” November 2025).
· “Sweet spot” +20% and the Q2–Q3 soft patch: Stock Trader’s Almanac (Jeffrey Hirsch).
· Twelve months post-midterm: +15.4% (Capital Group, May 2026); positive in all 18 cycles since 1950 (Forbes, October 2022).
· Skeptic case: U.S. Bank (January 2026), pattern statistically insignificant across a 31-election sample.
· Fed policy: FOMC statement and Summary of Economic Projections (June 17, 2026); rate-path odds per CME FedWatch (late June 2026).
· Inflation: BEA PCE (May 2026, headline 4.1% / core 3.4%); BLS core CPI 2.9% (May 2026).
· Growth and labor: BEA Q1 2026 real GDP +2.1% (June 2026); BLS unemployment 4.3% (May 2026).
· Earnings: FactSet Earnings Insight (2026), Q2 growth about 23%.
· AI capital expenditures roughly $725 billion (+77%): Value Add VC / company guidance (2026).
· Valuation and concentration: FactSet forward P/E near 20x; top-10 weight roughly 40% of the index (Morgan Stanley Investment Management).
· Tariffs: Tax Foundation (effective rate 7.7%, 2025); Council on Foreign Relations and JPMorgan (pass-through peak April–October 2026).
· Fiscal: Committee for a Responsible Federal Budget (September 30 funding deadline); CBO (debt 101% to 120% of GDP).
· Recession odds: Goldman Sachs 30%, EY-Parthenon 40%, Moody’s Analytics 49% (March 2026).
· Breadth and small caps: CNBC (June 2026), Russell 2000 best first half since 1991, roughly 38% 2026 EPS growth.