

I have written about the Presidential cycle before and how it can affect stock market trends.
If you are not familiar with it, the Presidential election cycle is one of the oldest observations in market seasonality, popularized by Yale Hirsch in the Stock Trader’s Almanac.
The idea is simple: U.S. equity returns have historically clustered by where the calendar sits in the four-year presidential term:
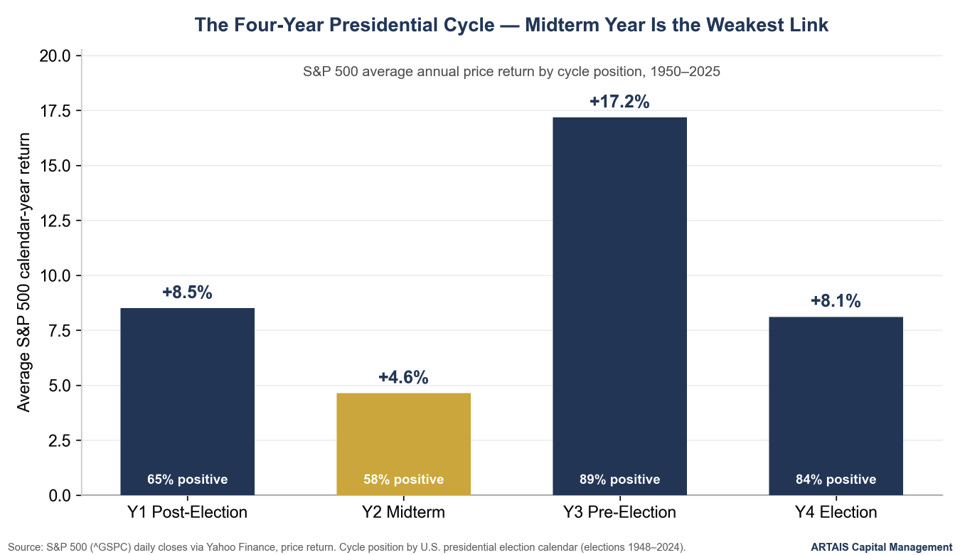
The conventional explanation is political-fiscal. In the first two years of a term, an administration tends to deal with the harder policy changes in its agenda.
(Current ARTAIS clients, please reach out to me for a free paid subscription)
By the second half of the term, the incentive flips toward economic stimulus and clarity ahead of the next election, in the hope of getting the incumbent party reelected.
In this week’s note, I want to dive a bit deeper and discuss some of the opportunities that are beginning to unfold and how it relates to this cycle.
The Current Pullback in Technology
As of the July 15, 2026 close, the S&P 500 sits at only 0.5% below the record it set on June 2.
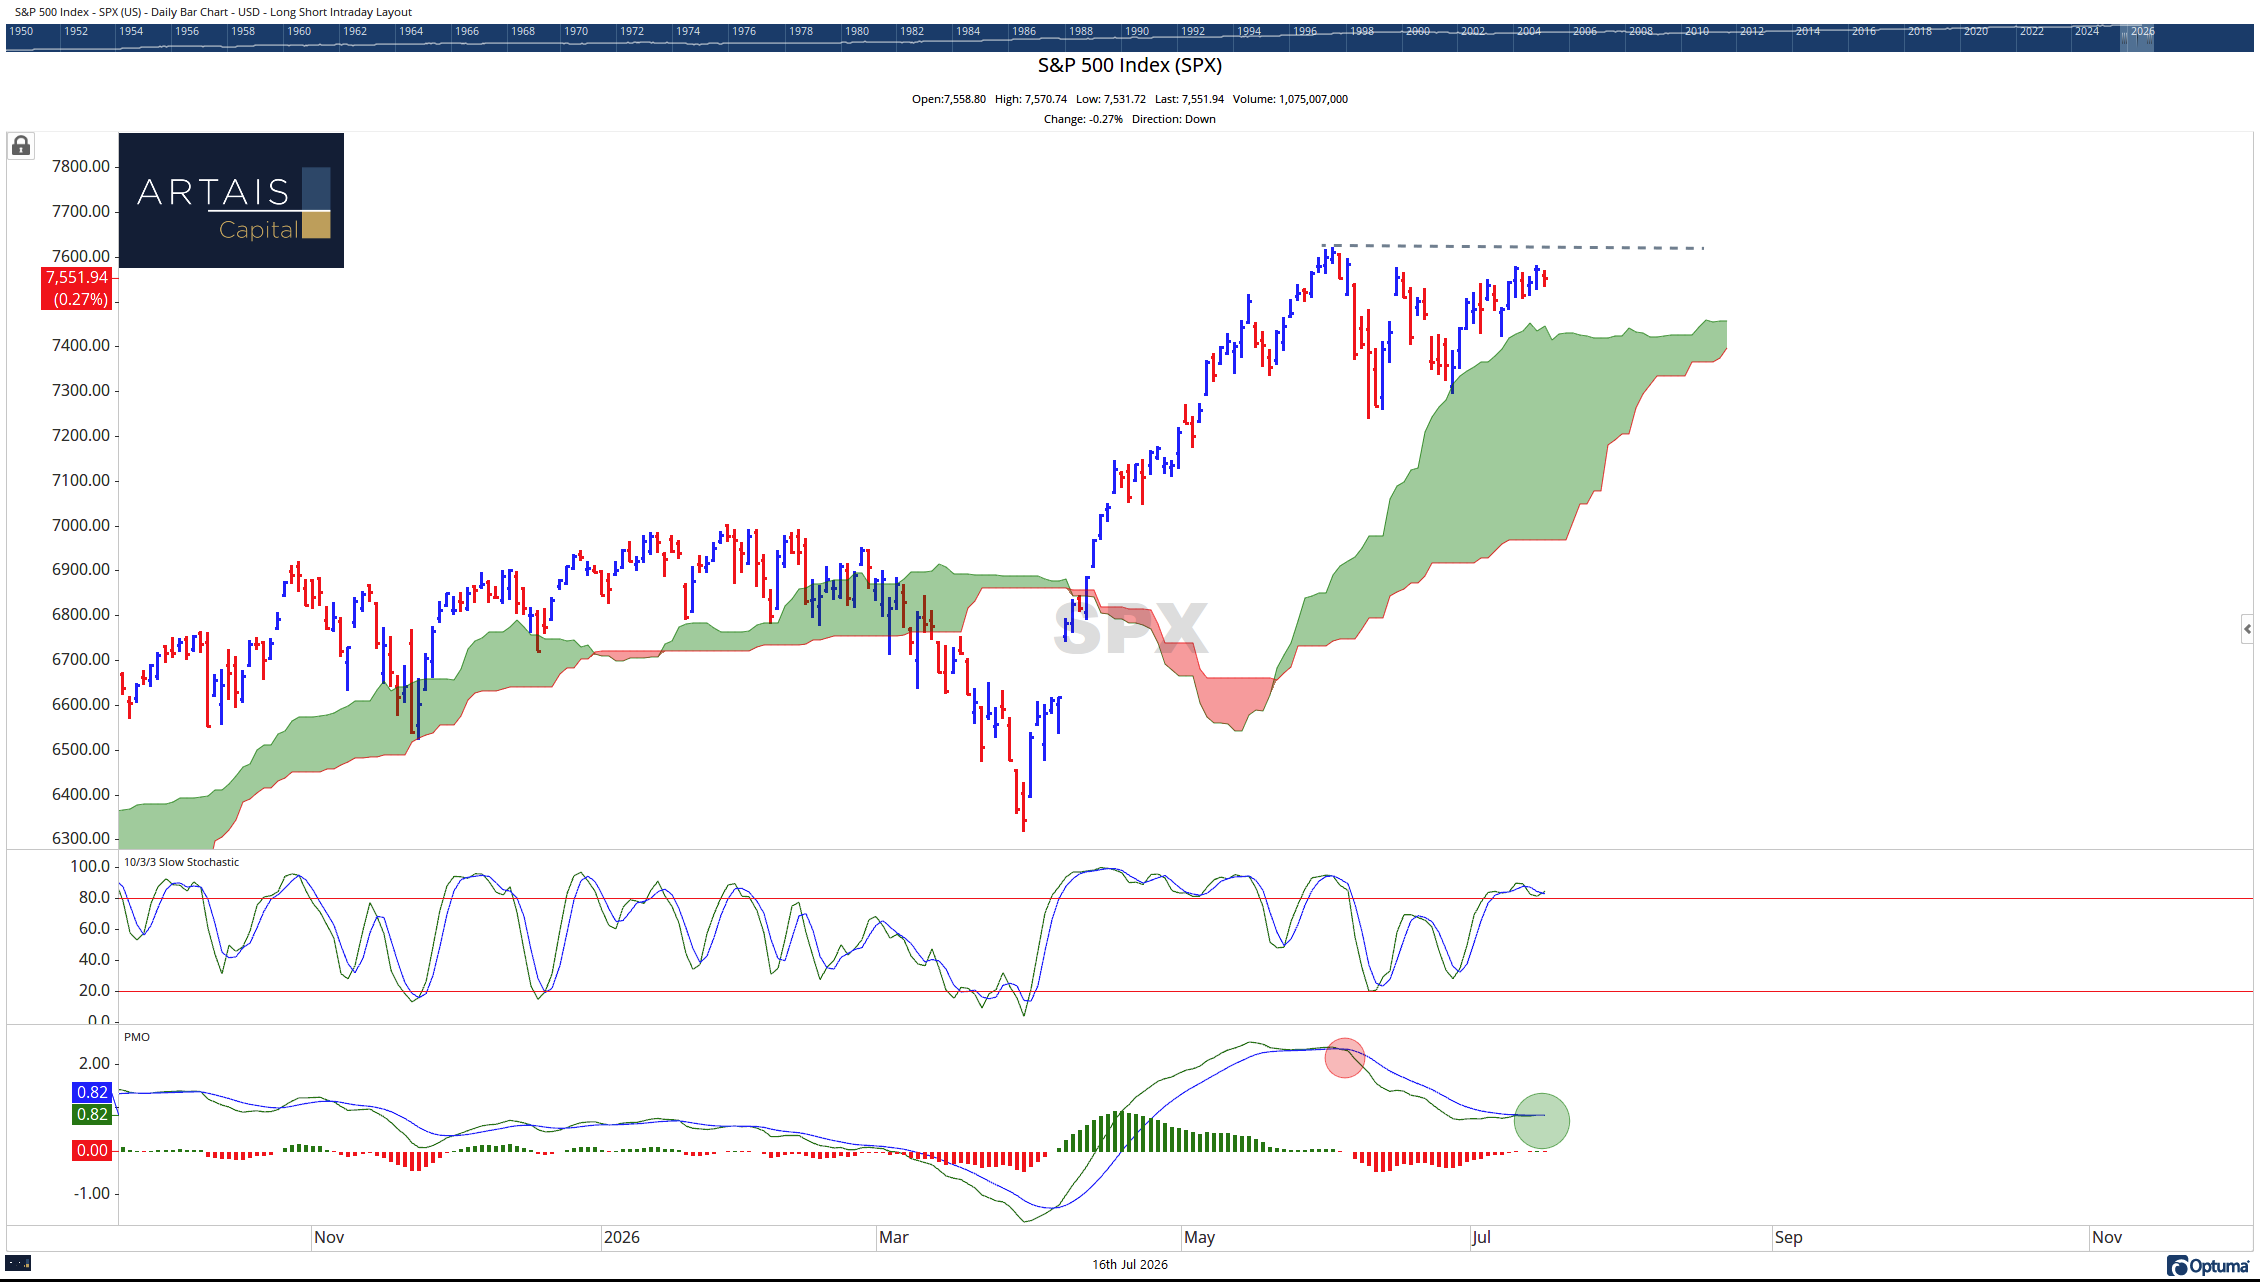
However, if we look one layer down, the picture is very different. The technology sector is down over 10% since its June 2nd peak:
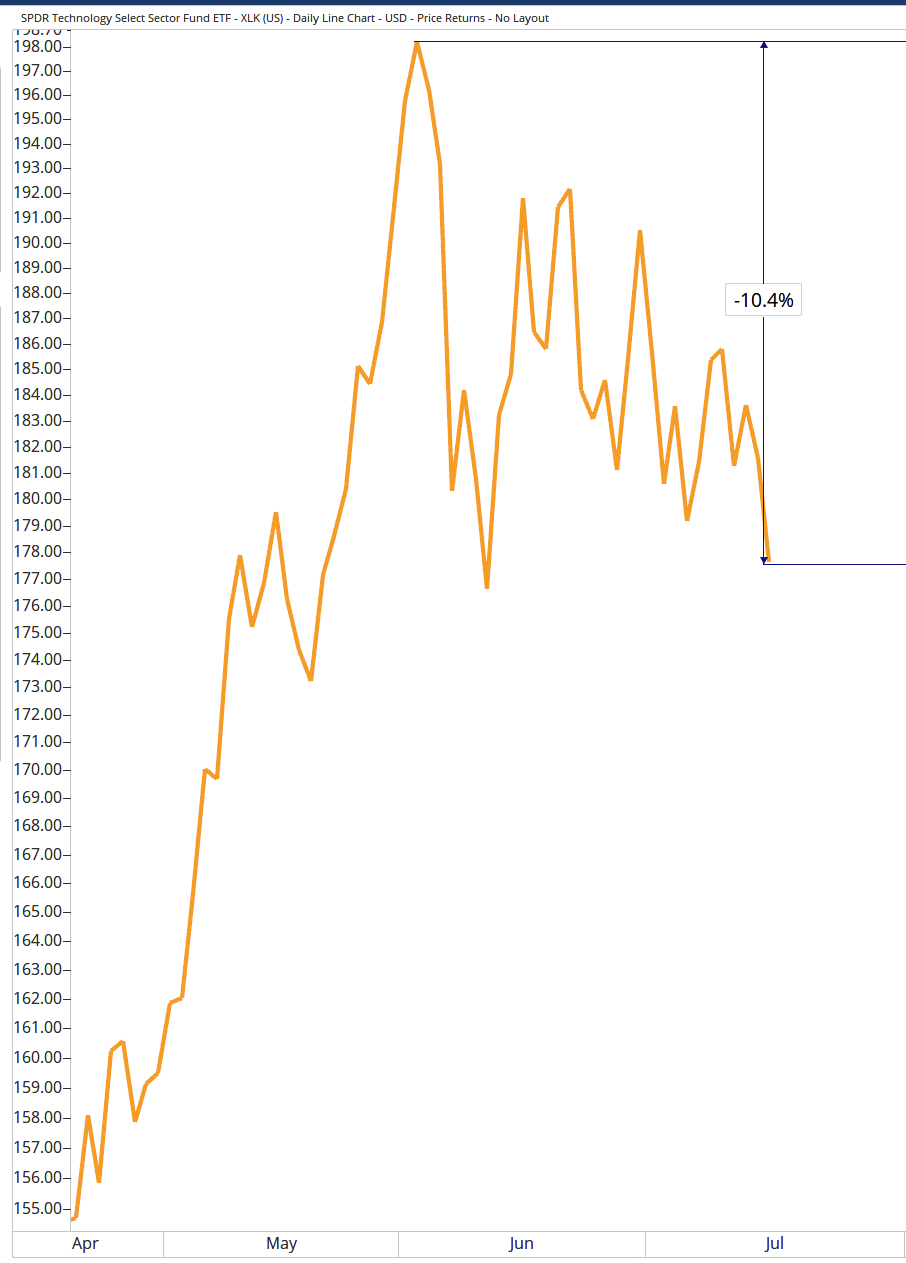
Source: OPTUMA
And the iShares Semiconductor ETF (SOXX) has fallen over 18% since its high in June.
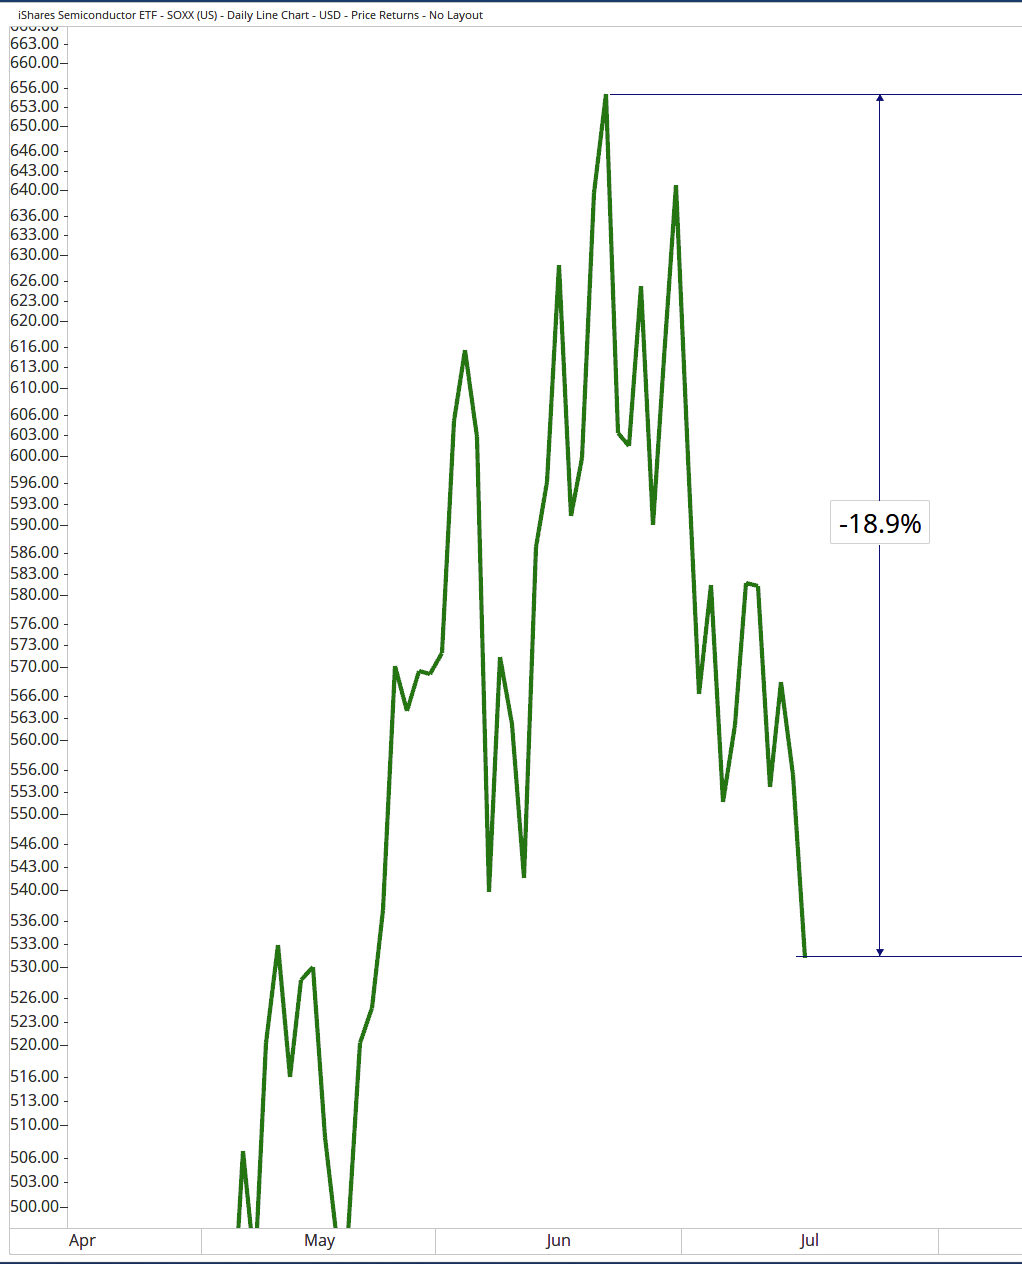
What makes this interesting is the fact that the Technology sector is the largest component of the S&P 500 Index.
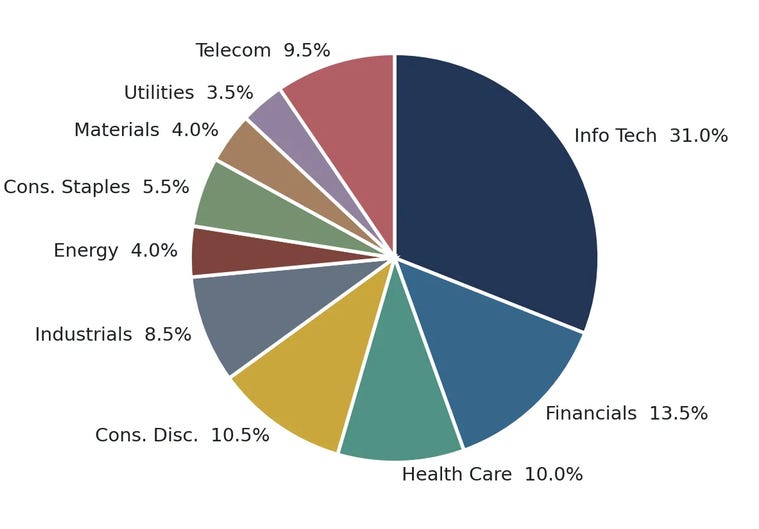
So how is the S&P 500 index nearing its previous all-time high when the Tech sector is down over 10% since June?
Financials and Health Care have taken over and have been supporting the index, while Tech falters. Since the June 2nd peak in Technology, Financials and Healthcare are each up over 10%:
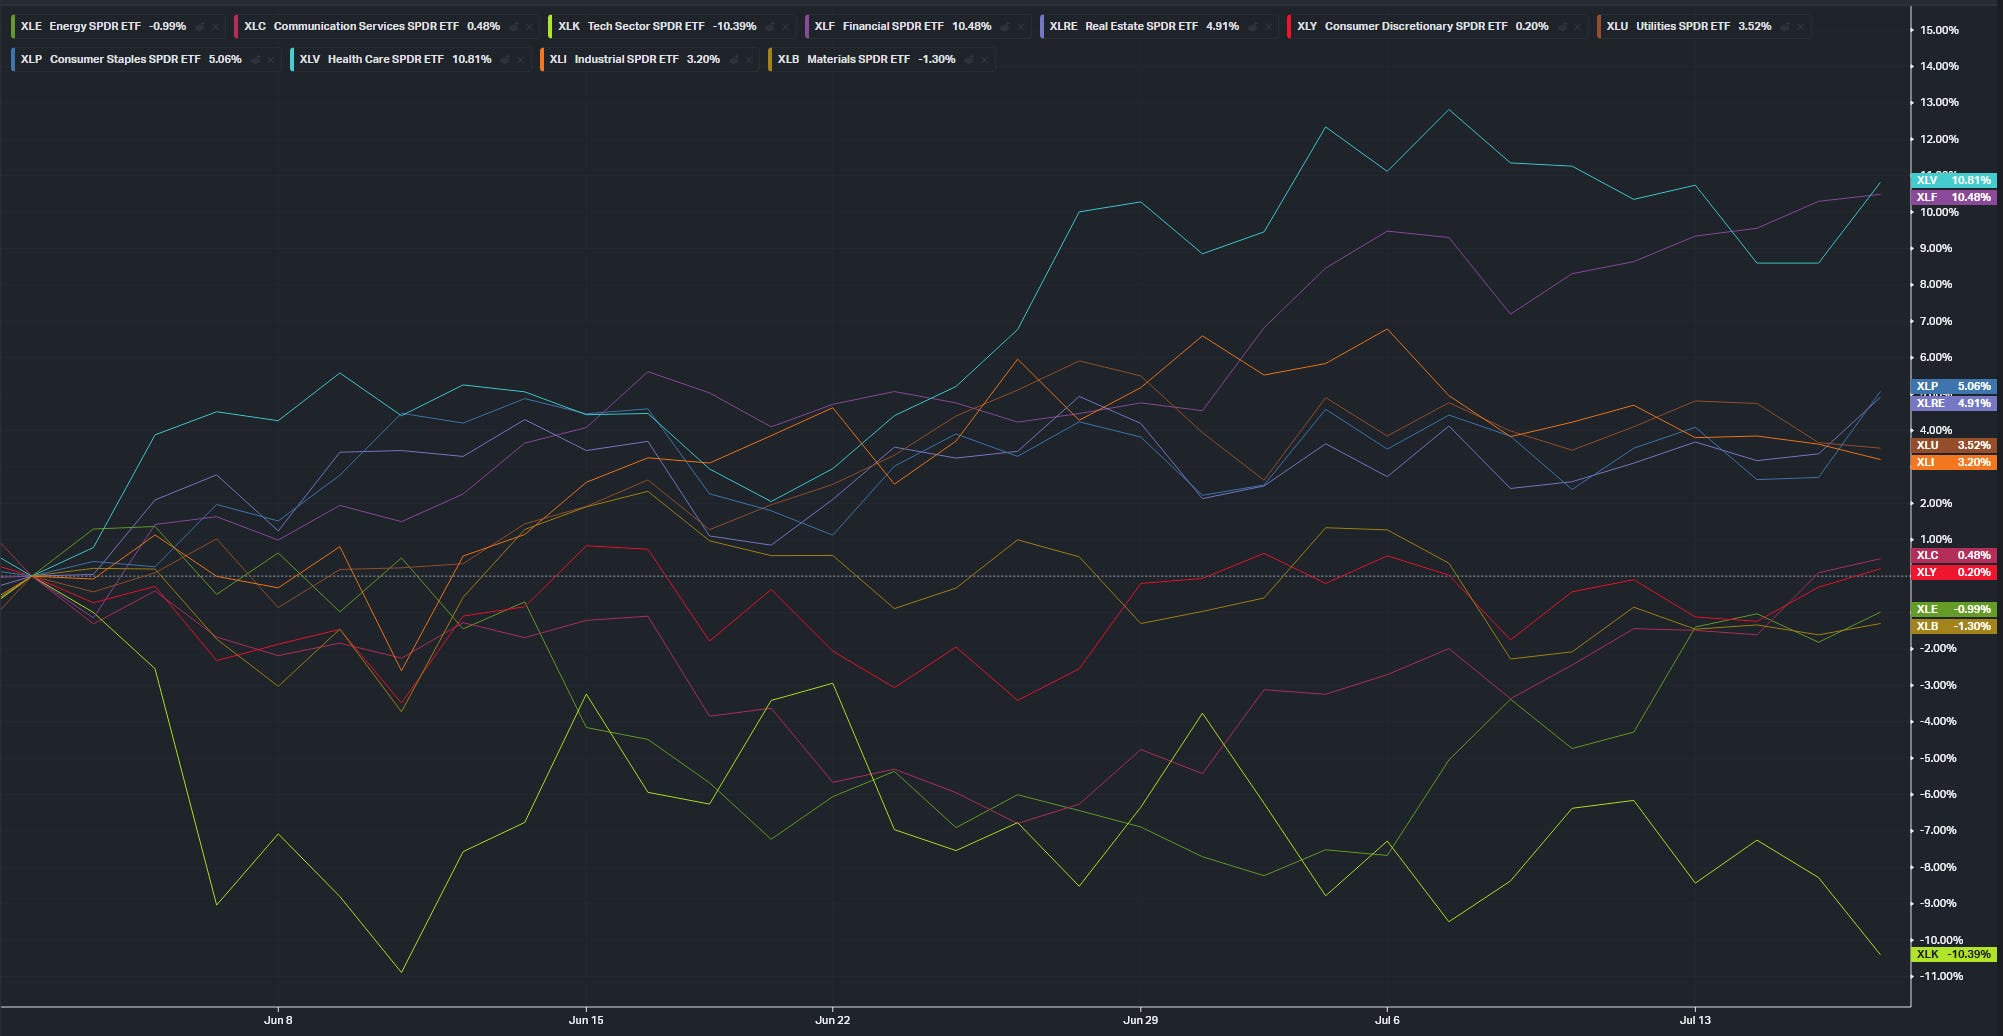
What does this pullback in Tech have to do with the midterm elections?
Let’s dive deeper into the historical trends of this cycle…
The Midterm Summer Low, and What Typically Follows.
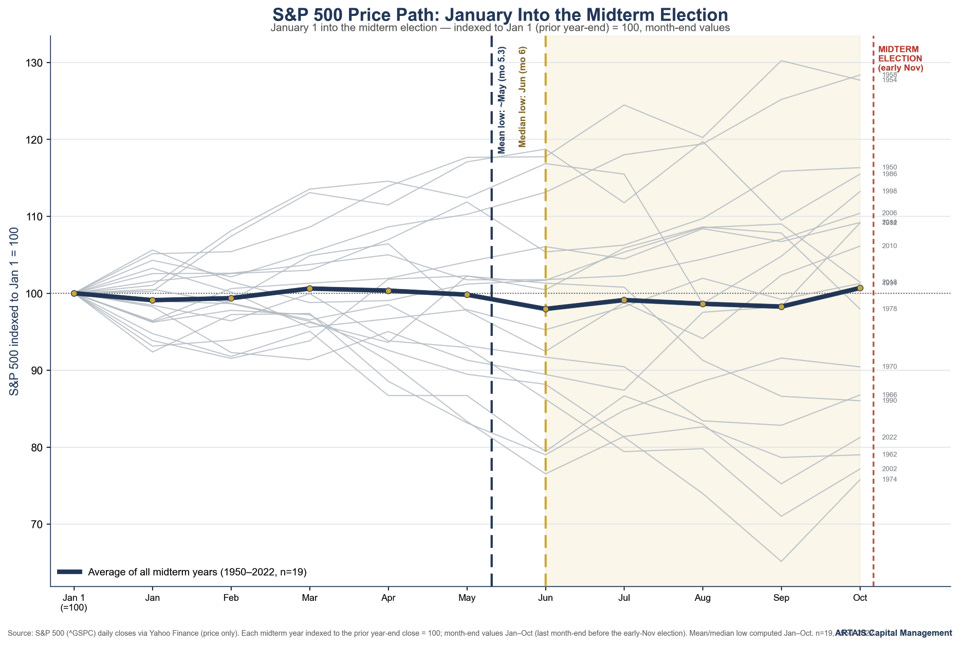
If we study the midterm election years as a group, a pattern begins to emerge. A choppy, range-bound first half, a soft patch across late spring and summer, a low, and a recovery that builds into the November election and accelerates into the pre-election year.
The charts below plot every midterm year since 1950 indexed to the prior year-end (=100), from January 1 into the election, with the bold navy line showing the average path.
I have also highlighted both the mean and median values of when the low has occurred:
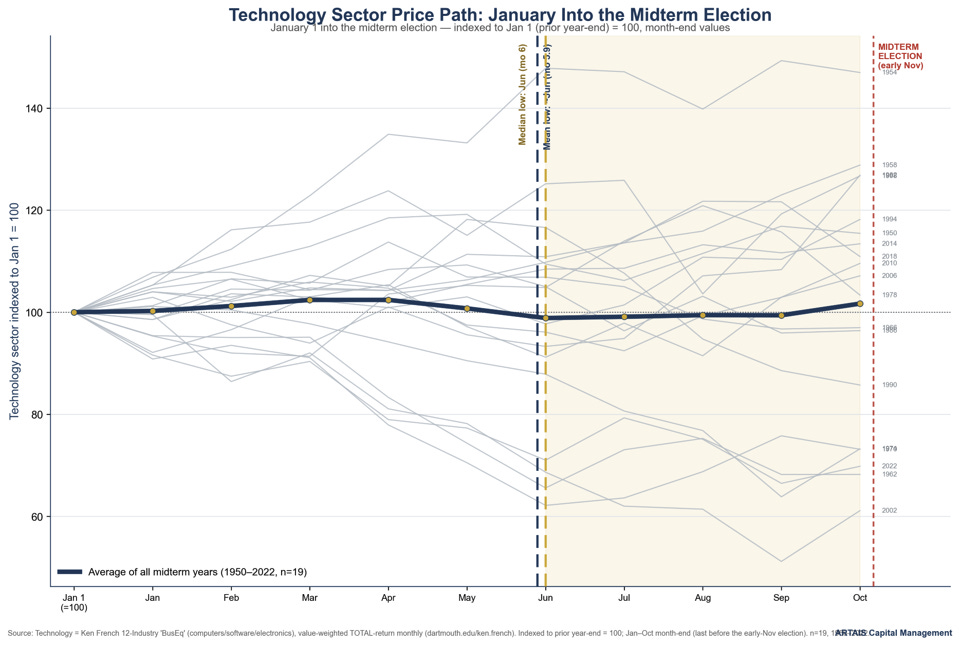
Technology shows similar timing, but with a wider range (this is due to the sector’s higher beta).
For this, I am using Kenneth French’s business-equipment (technology) industry portfolio on a total-return basis. His data can be accessed here: https://mba.tuck.dartmouth.edu/pages/faculty/ken.french/data_library.html
The average and median lows again cluster in the May–June window.
From the median June low into the end of October, the sector has averaged a 3.4% gain, positive in 58% of years — slightly outperforming the index, again consistent with Technology’s higher beta.
LPL Financial has noted that the S&P 500 was higher twelve months after every midterm low since World War II. The point for a tactical investor is directional: the midterm summer is historically closer to an entry than an exit.
While the move from the summer low into November has been positive, this is not where the real opportunity lies.
Over the twelve months following the midterm low and into the pre-election year, the S&P 500 index has averaged +17.2% and finished higher 89% of the time since 1950.
Using the end of June as a start date and Kenneth French’s data, the 12 months after the typical low have been pretty impressive for the Tech sector:
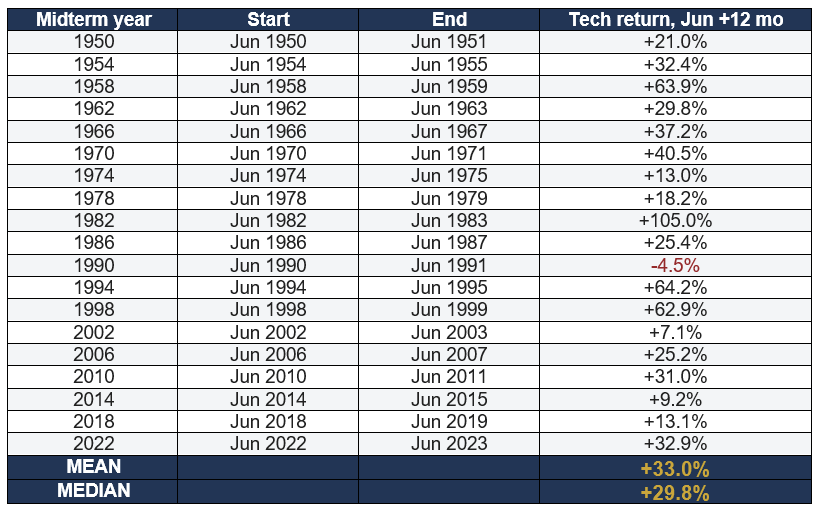
Source: Kenneth R. French Data Library, 12 Industry Portfolios, “BusEq” (business equipment: computers, software, electronic equipment), average value-weighted monthly TOTAL returns, 1950–2023 (mba.tuck.dartmouth.edu/pages/faculty/ken.french). Start = June month-end of each midterm year (the composite mean/median low month); return compounded over the following 12 months.
What about Health Care and Financials?
The below Relative Rotation Graph is already showing the momentum starting to weaken for Health Care and Financials:
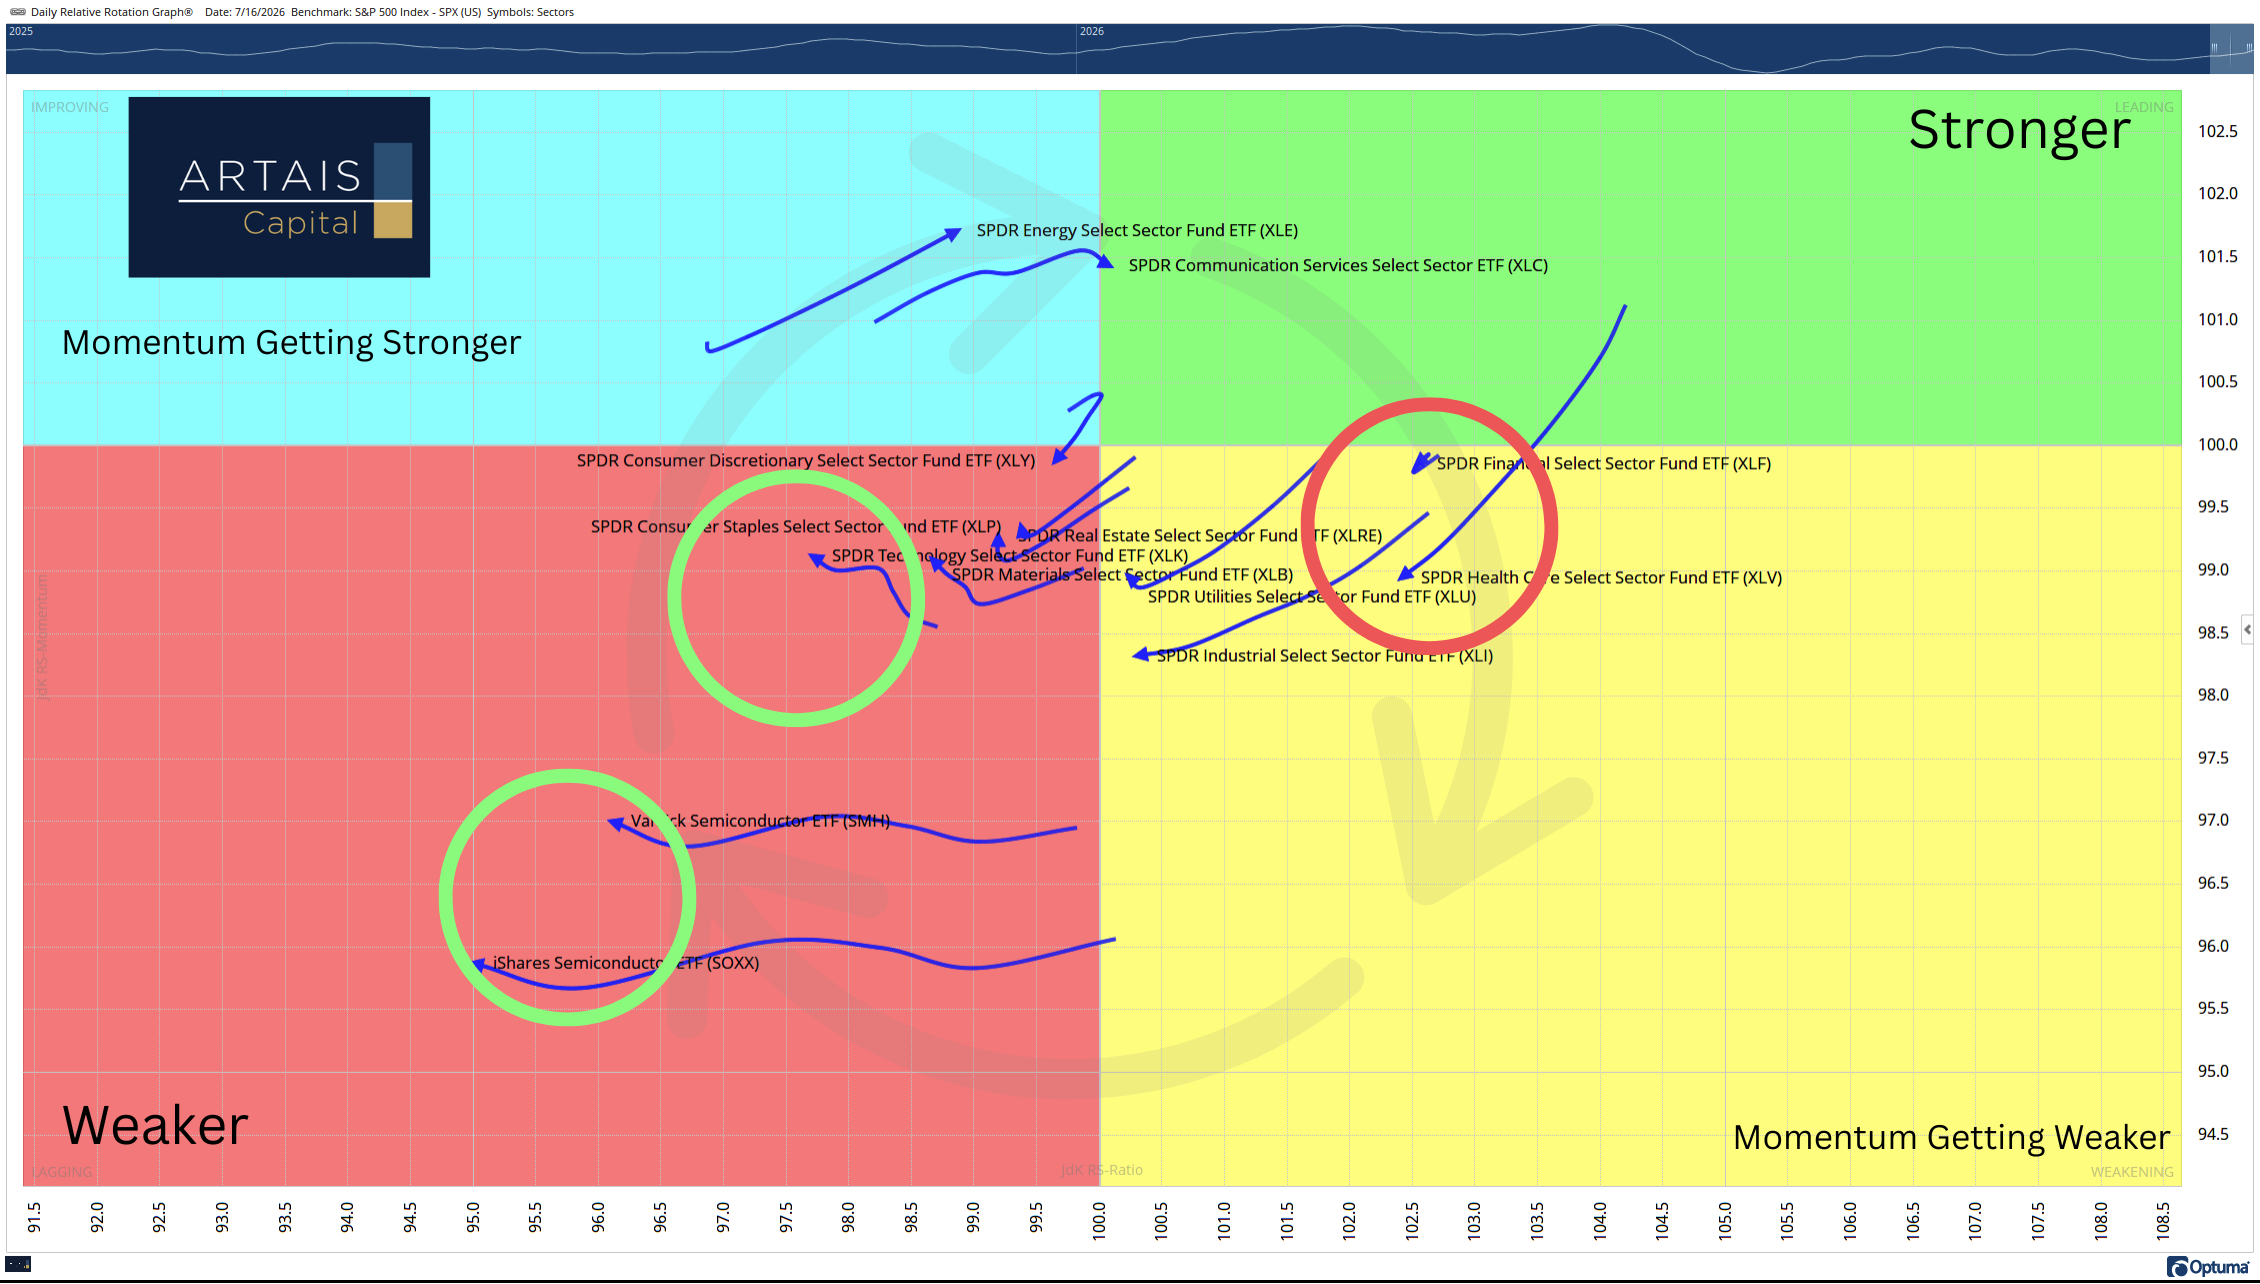
If you are not familiar with Relative Rotation Graphs (RRG), they allow us to visualize market rotation in real time.
RRGs typically rotate in a clockwise fashion, and research has shown that opportunities occur when a sector is in the lower left quadrant. This is due in part because investors start looking for value after a pullback in price (Think buy low, sell high).
(Current ARTAIS clients, please reach out to me for a free paid subscription)
As I mentioned in this week’s Signal & Noise Report, in his paper, “Buying Out Performers is Too Late,” Mathew Verdouw, CMT, CFTe, highlights that when stocks are in the Lagging Quadrant (the red, bottom-left quadrant), 90% of the time they continue to rotate to the Improving Quadrant:
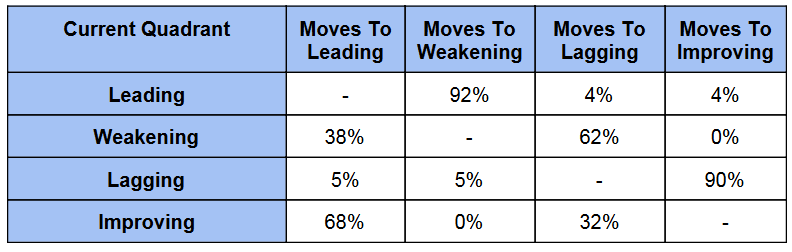
This means 90% of the time these stocks see a rise in positive momentum and relative strength.
But John, what about the down years during a midterm election year?
Up Years vs. Down Years — What Actually Separates Them
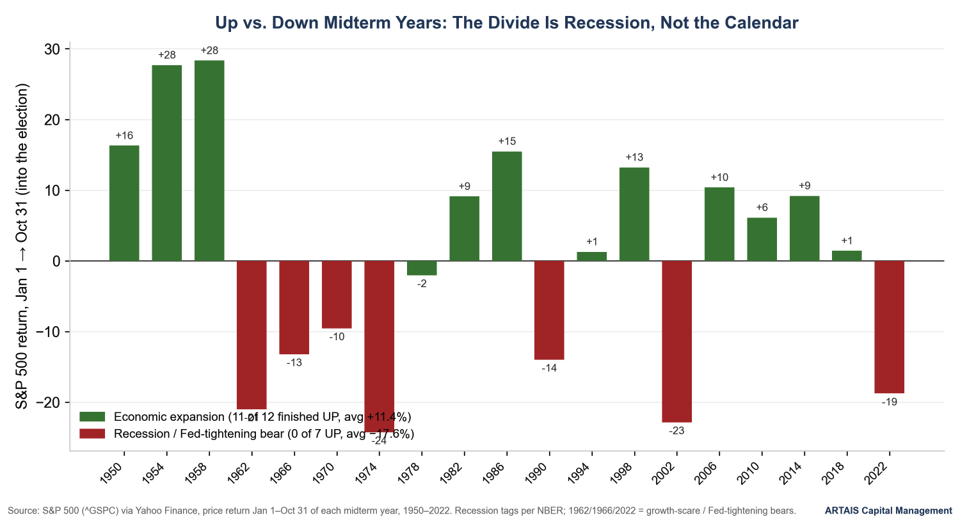
Averages hide the most important fact about midterm years, which is that they are bimodal.
The useful question is not “is this a midterm year” but “which kind of midterm year is this.”
The dividing line is not the calendar. It is the economy. Sort the down years, and every one of them coincided with a recession or an aggressive monetary-tightening bear market: 1962 (a growth scare), 1966 and 2022 (Fed-tightening bears), and 1970, 1974, 1990, and 2002 (recessions).
Sort the up years, and they are, almost without exception, ordinary economic expansions.
Grouped that way, expansion midterm years finished higher in 11 of 12 cases and averaged +11.4% into the election, while recession-and-tightening midterm years were down in all 7 and averaged −17.6%.
Where Does 2026 Sit?
On the evidence available today, 2026 fits the expansion profile rather than the recession profile, on three independent measures:
· No recession. The U.S. economy is not in an NBER-dated recession, and the S&P 500 sits within 1% of an all-time high. In most prior midterm years that finished lower into the election, the market was already in the red by summer. 2026 is not.
· A strong first half. The S&P 500 was up 10.6% year-to-date at mid-July. Historically, a positive mid-July has skewed the outcome sharply: midterm years that were higher at mid-July finished higher into the election 78% of the time (average +10.6%), while those that were lower at mid-July finished up only 40% of the time (average −8.3%).
· Positioning. Down midterm years averaged −11.3% at mid-July; up years averaged +5.7%. At +10.6%, 2026 is running ahead of the typical up-year trajectory, not behind it.
Of course, none of this guarantees the outcome. Instead, the data implies that the version of the midterm pattern that applies in a healthy expansion is the relevant base rate for 2026.
In Summary
Put the three threads together. First, the calendar: a midterm-year summer, historically the interior low of the weakest year in the cycle, handing off to the strongest.
Second, the regime: an ongoing expansion with the index near highs, which is the profile that has produced up years 11 times in 12.
Third, the pullback itself: the highest-beta group in the market has already corrected 14% to 18% from its June peak while the index has barely moved.
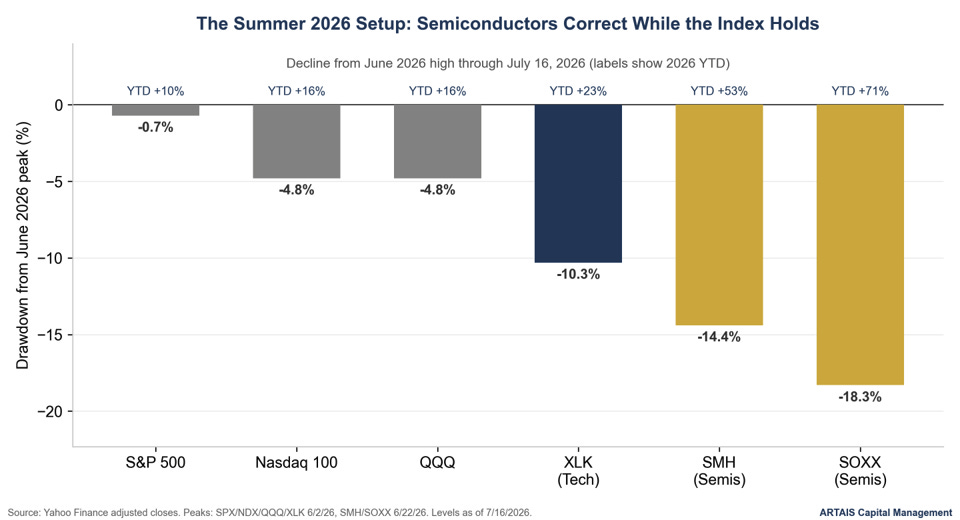
This is what a sector-level pullback inside an intact stock market uptrend looks like.
Semiconductors led on the way up, and high-beta leadership giving back part of a large advance during the summer soft patch is exactly the behavior I would expect to see in this cycle.
My research on beta and the Presidential cycle has found that the technology and high-beta complex tends to bottom slightly later than the index and then leads the recovery once the Year 2-to-Year 3 handoff begins, with the deepest relative weakness clustered in the June-to-September window that the market is now traversing.
The analytical observation, then, is that a semiconductor group down 14% to 18% from its June high, inside an expansion, in a midterm summer, is sitting at the intersection of three separate historical tailwinds rather than at the start of a structural breakdown.
That does not make it a certainty, and it is not a recommendation to buy any specific security. It is a statement about base rates: history has more often rewarded accumulation into this kind of weakness than punished it.
Skeptic’s Corner
So what can go wrong? I like to always examine the opposite side of the argument, then use the weight of the evidence to help formulate my decisions.
· The sample size is small. Nineteen midterm years is a small sample, and U.S. Bank’s analysis that election-cycle effects are not statistically significant is not a throwaway caveat.
· Regime risk is the whole game. The entire positive year case rests on the expansion continuing. If the labor market rolls over, if inflation forces the Fed back to tightening, or if an earnings reset hits the AI capital-spending cycle, 2026 gets reclassified into the recession scenario, and that scenario was down every single time, by an average of nearly 18%. Semiconductors, as the highest-beta group, would lead that decline just as they have led the advance.
· The correction may not be over. A 14%–18% drawdown is not necessarily the low. High-beta groups have historically bottomed later than the index, sometimes not until the autumn; SOXX down 18% could become SOXX down 25% before it turns. “Cheaper than June” is not the same as “cheap,” and semiconductors are still up sharply on the year. Plus, Tech earnings release tends to cluster near the end of July.
· Seasonality is not a thesis. Semiconductor valuations and the durability of AI-driven demand remain the open questions under the price action. Seasonality can only ever be a supporting argument; it cannot substitute for the fundamentals, and it should never be the primary reason to own a cyclical, richly-valued group.
The measured conclusion: the weight of the historical evidence leans constructive for technology into November, but the argument lives or dies on the economic regime. Watch the data that can break it, like labor, inflation, and the trajectory of AI-related capital spending.