
The NVIDIA Trap: Why the S&P 500 is Flat While New Winners are Soaring
The index is 7% NVIDIA, but the real money is moving elsewhere. Here is how we use Relative Rotation Graphs (RRGs) to spot the Great Value Rotation of 2026.

For the last few years, being a “diversified” investor mostly meant owning a handful of massive tech companies. If you owned the S&P 500, you were essentially betting on a small committee of AI giants led by NVIDIA.
But as we move through February 2026, the “Magnificent” era is facing a new challenger: the math of exhaustion.
While the headlines still obsess over every NVIDIA earnings beat, a quiet shift is happening under the hood. To see it, you have to stop looking at price charts and start looking at “Relative Rotation.”
The Market as a Race Track
Most investors look at a stock chart and ask, “Is it going up?” But institutional pros ask, “Is it going up faster than the market?”
Source: RRG Research, StockCharts.com
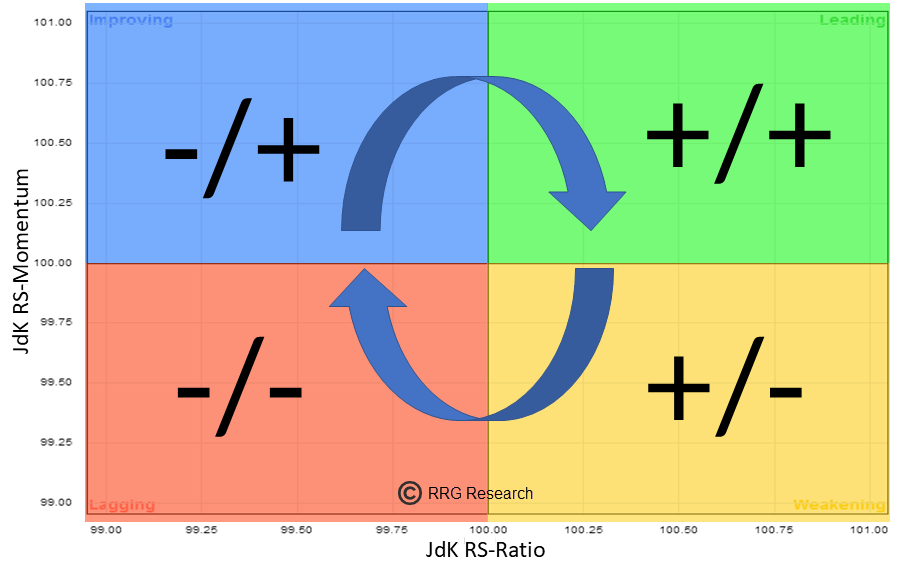
Think of a Relative Rotation Graph (RRG) as a circular race track with four zones.
The Leading zone is where the winners live.
The Weakening zone is where the winners go to catch their breath.
The Lagging zone is for the underperformers.
The Improving zone is the “on-ramp” where discarded stocks start to find their legs again.
When you plot the market this way, you see a story that a regular price chart misses.
For most of 2025, Tech (XLK) lived firmly in the Leading quadrant. But recently, we’ve seen those “tails” on the graph start to curl downward toward the Weakening zone.
Meanwhile, the “boring” sectors—Financials, Energy, and Value-heavy industrials—are making a beeline for the Leading quadrant.
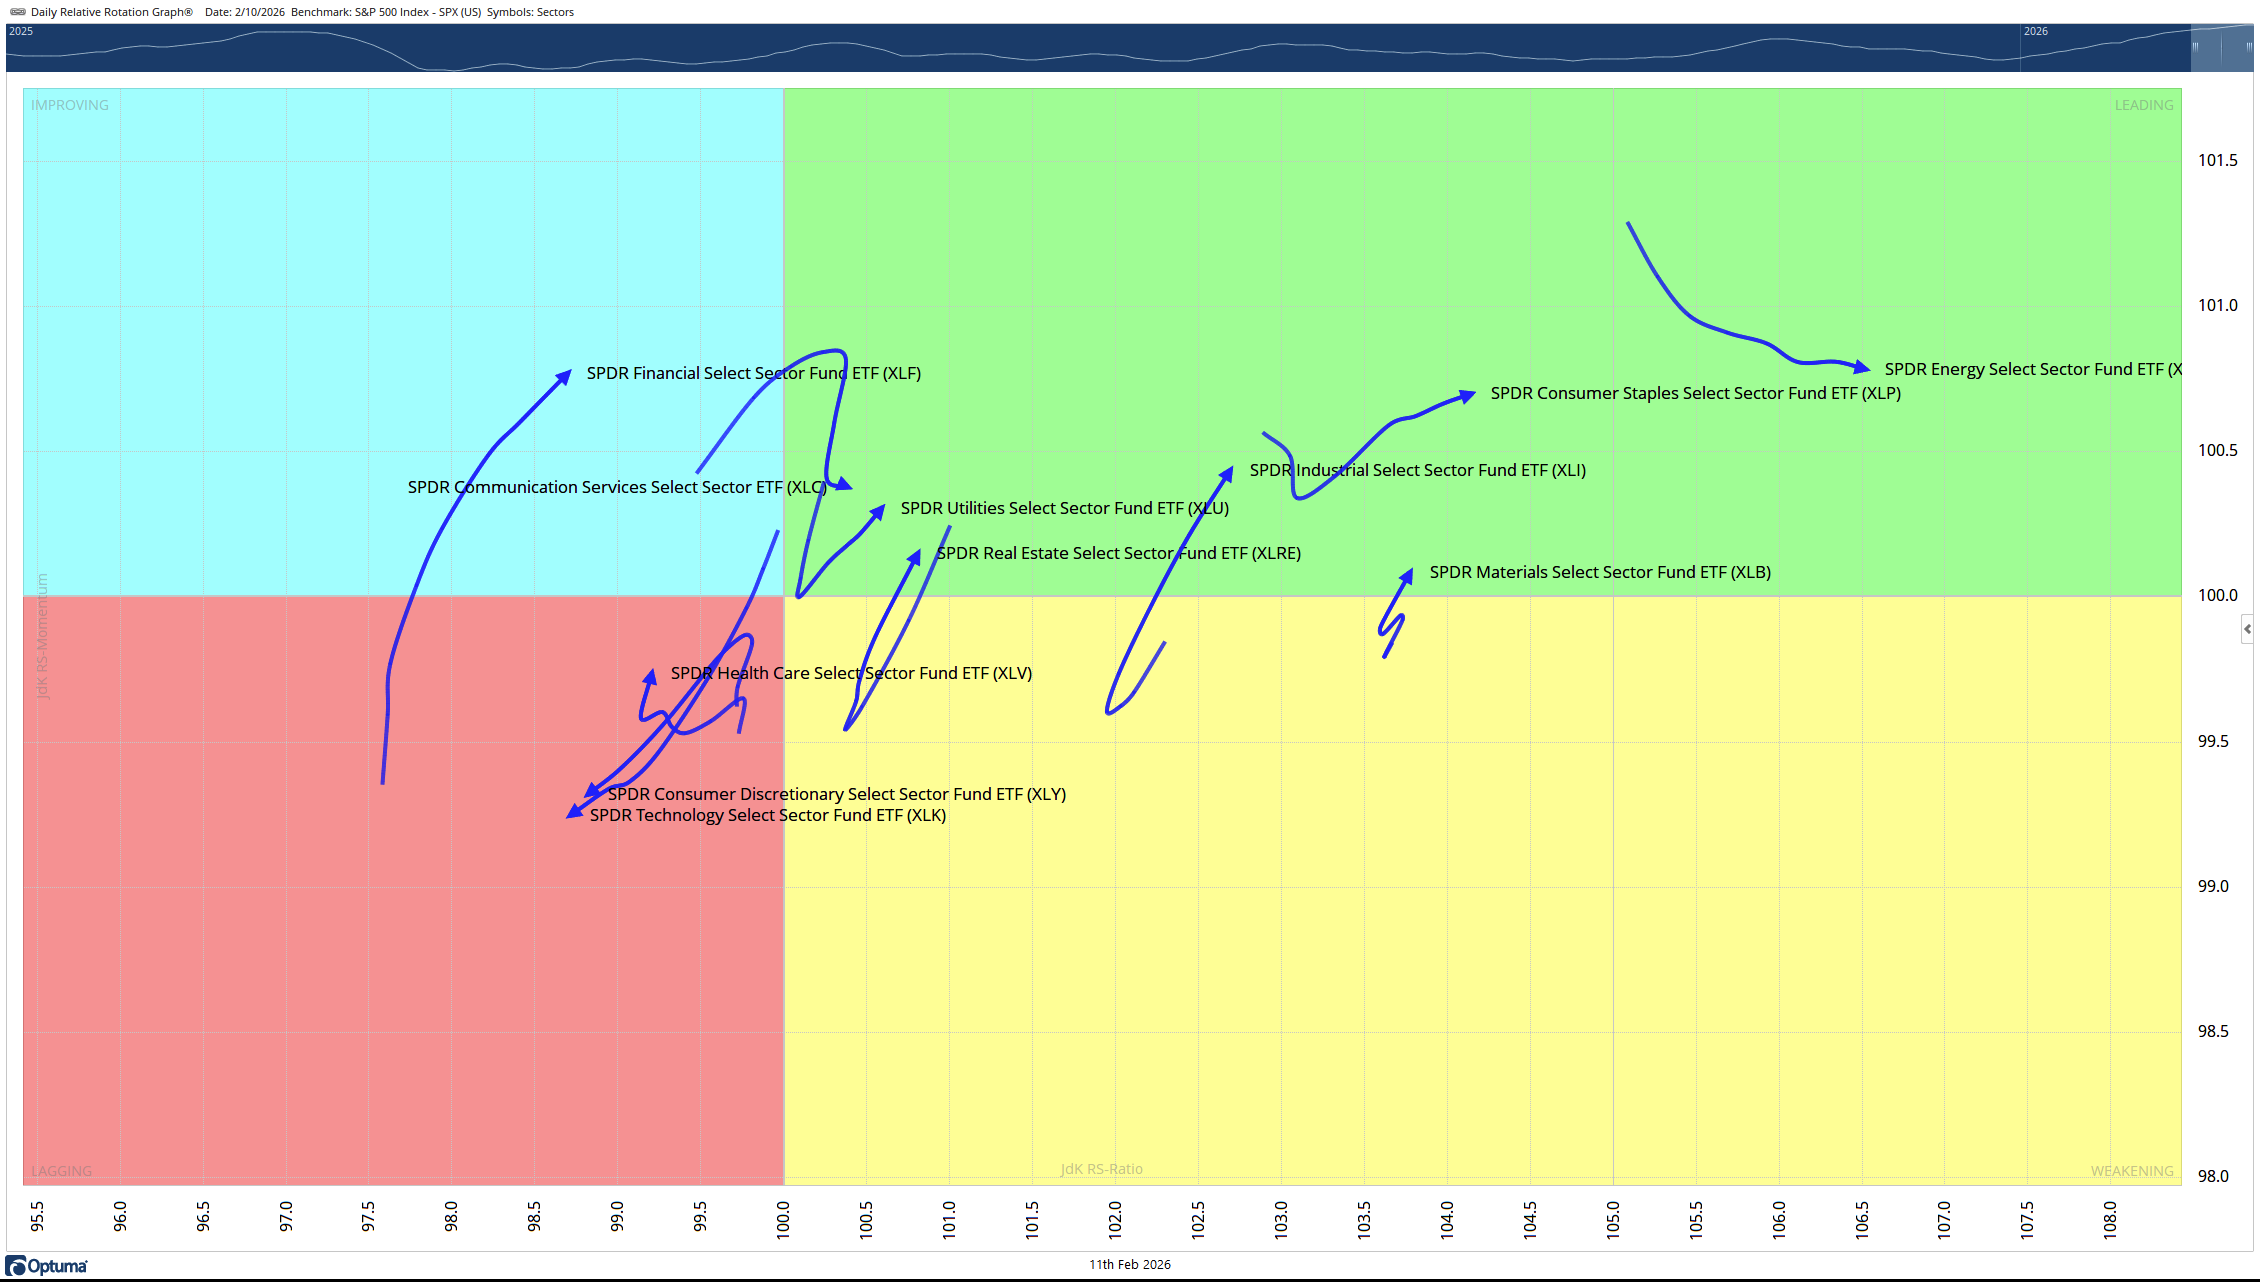
Source: Optuma, ARTAIS Capital Management
The 7% Problem: The NVIDIA Effect
To understand why the S&P 500 feels so disjointed lately, look no further than NVIDIA’s weighting. At roughly 7.31% of the entire index, NVIDIA is a gravitational force.

When NVIDIA has a bad day, it doesn’t just pull down the tech sector; it drags the entire S&P 500 into the red, even if 400 other stocks in the index are actually rising.
This concentration creates a “hall of mirrors” effect.
Investors see the S&P 500 flat or down and assume the economy is struggling, when in reality, value stocks and small-caps are having their best month in years.
A closer look at NVIDIA’s chart shows us that the stock is still down 11% from its October 2025 high. Since then, it has been stuck in a sideways trading pattern - unable to break out and reach its former glory.
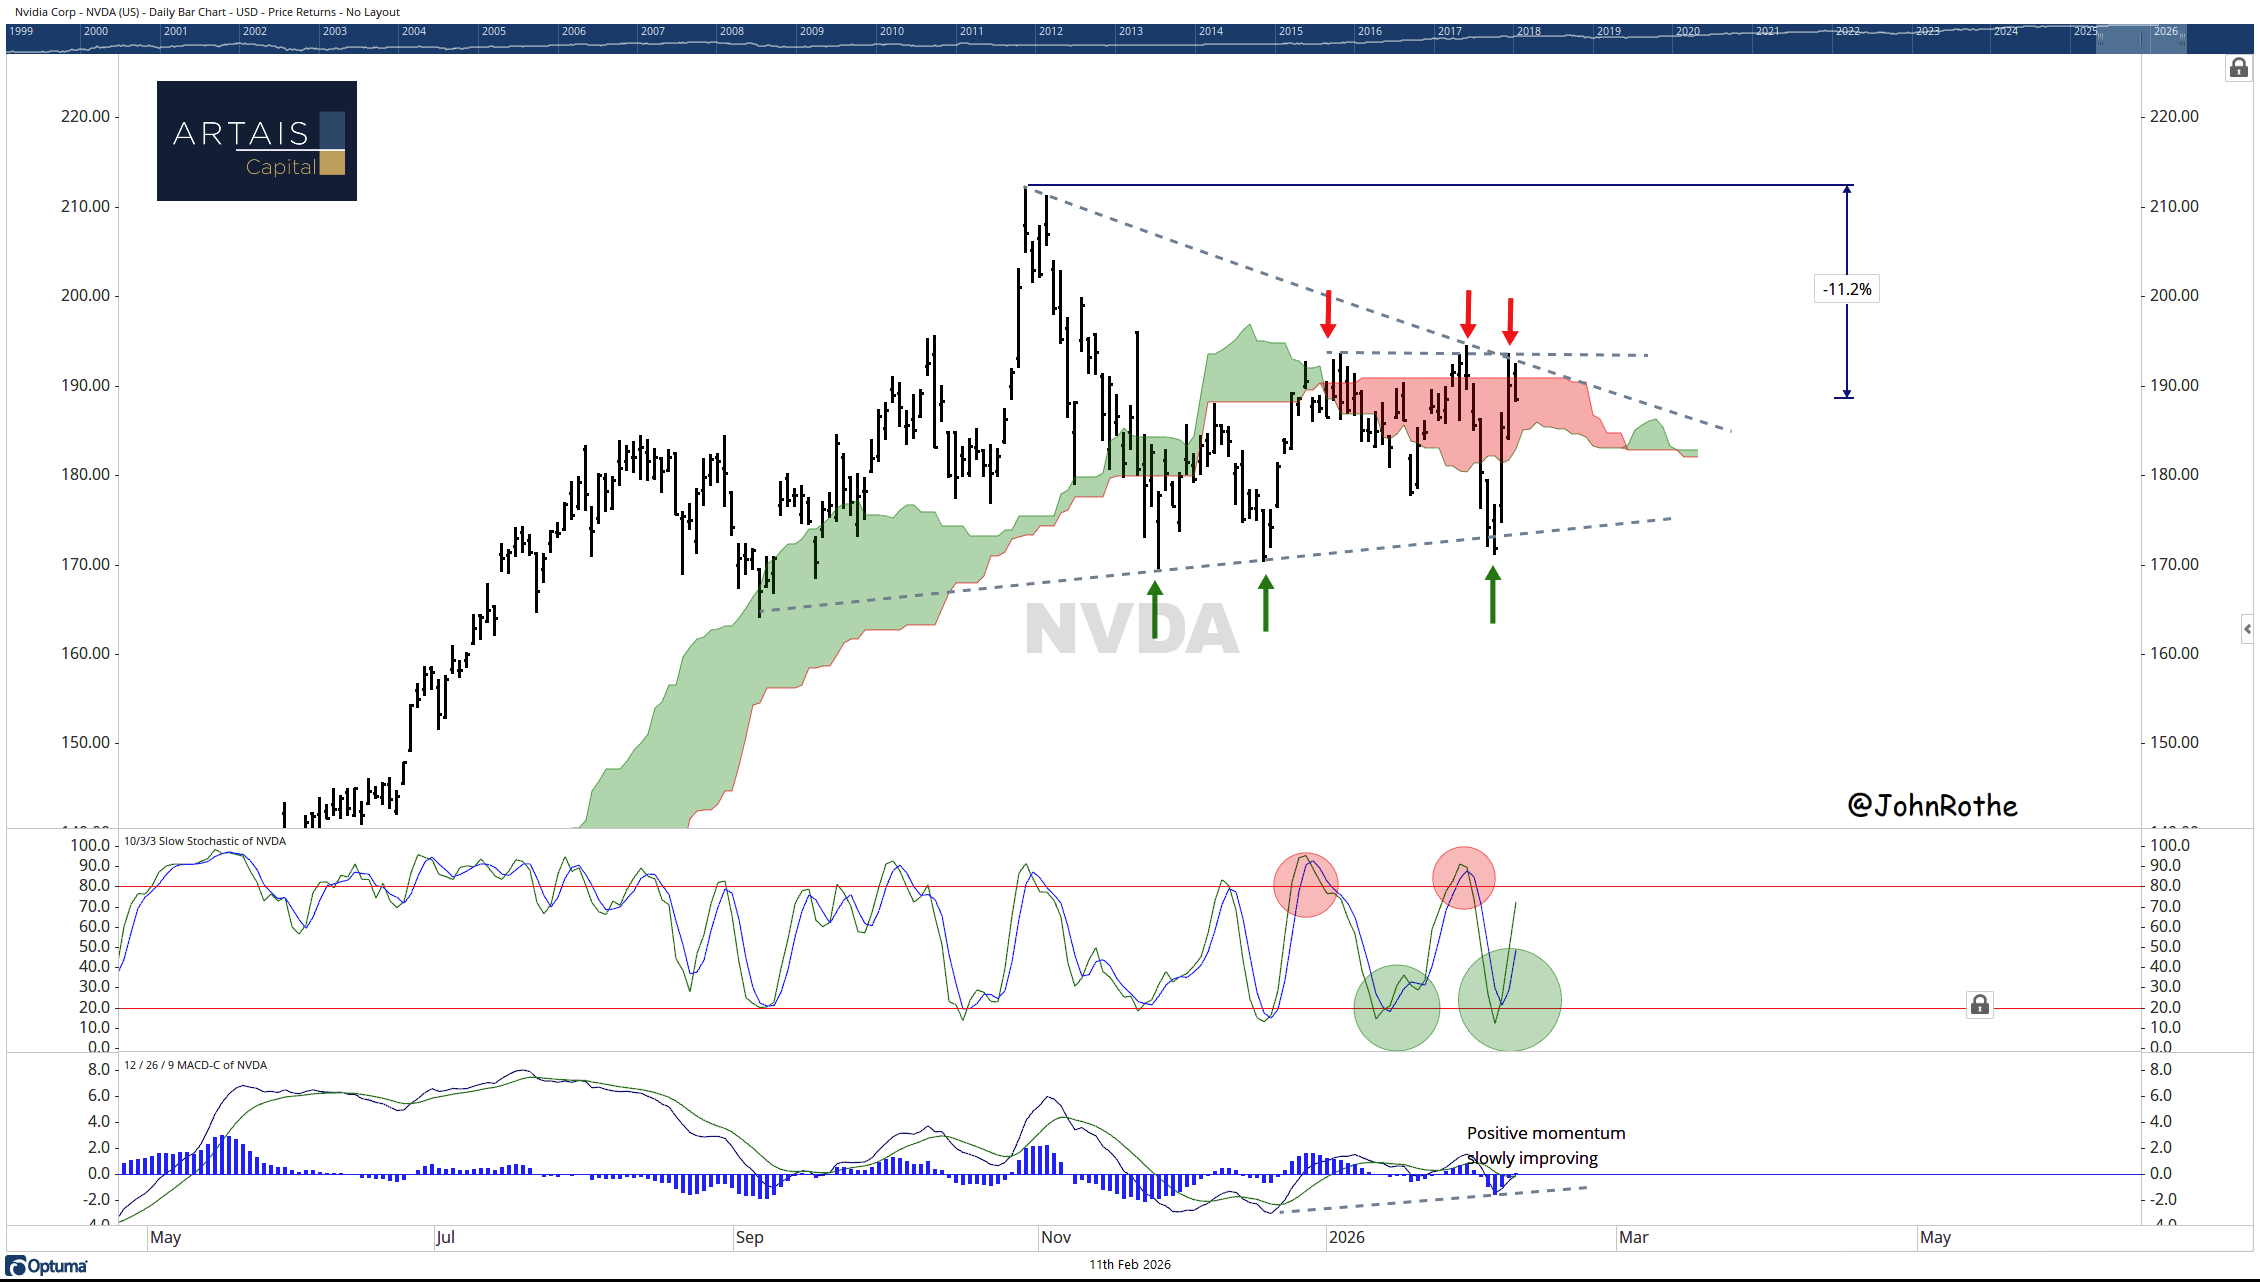
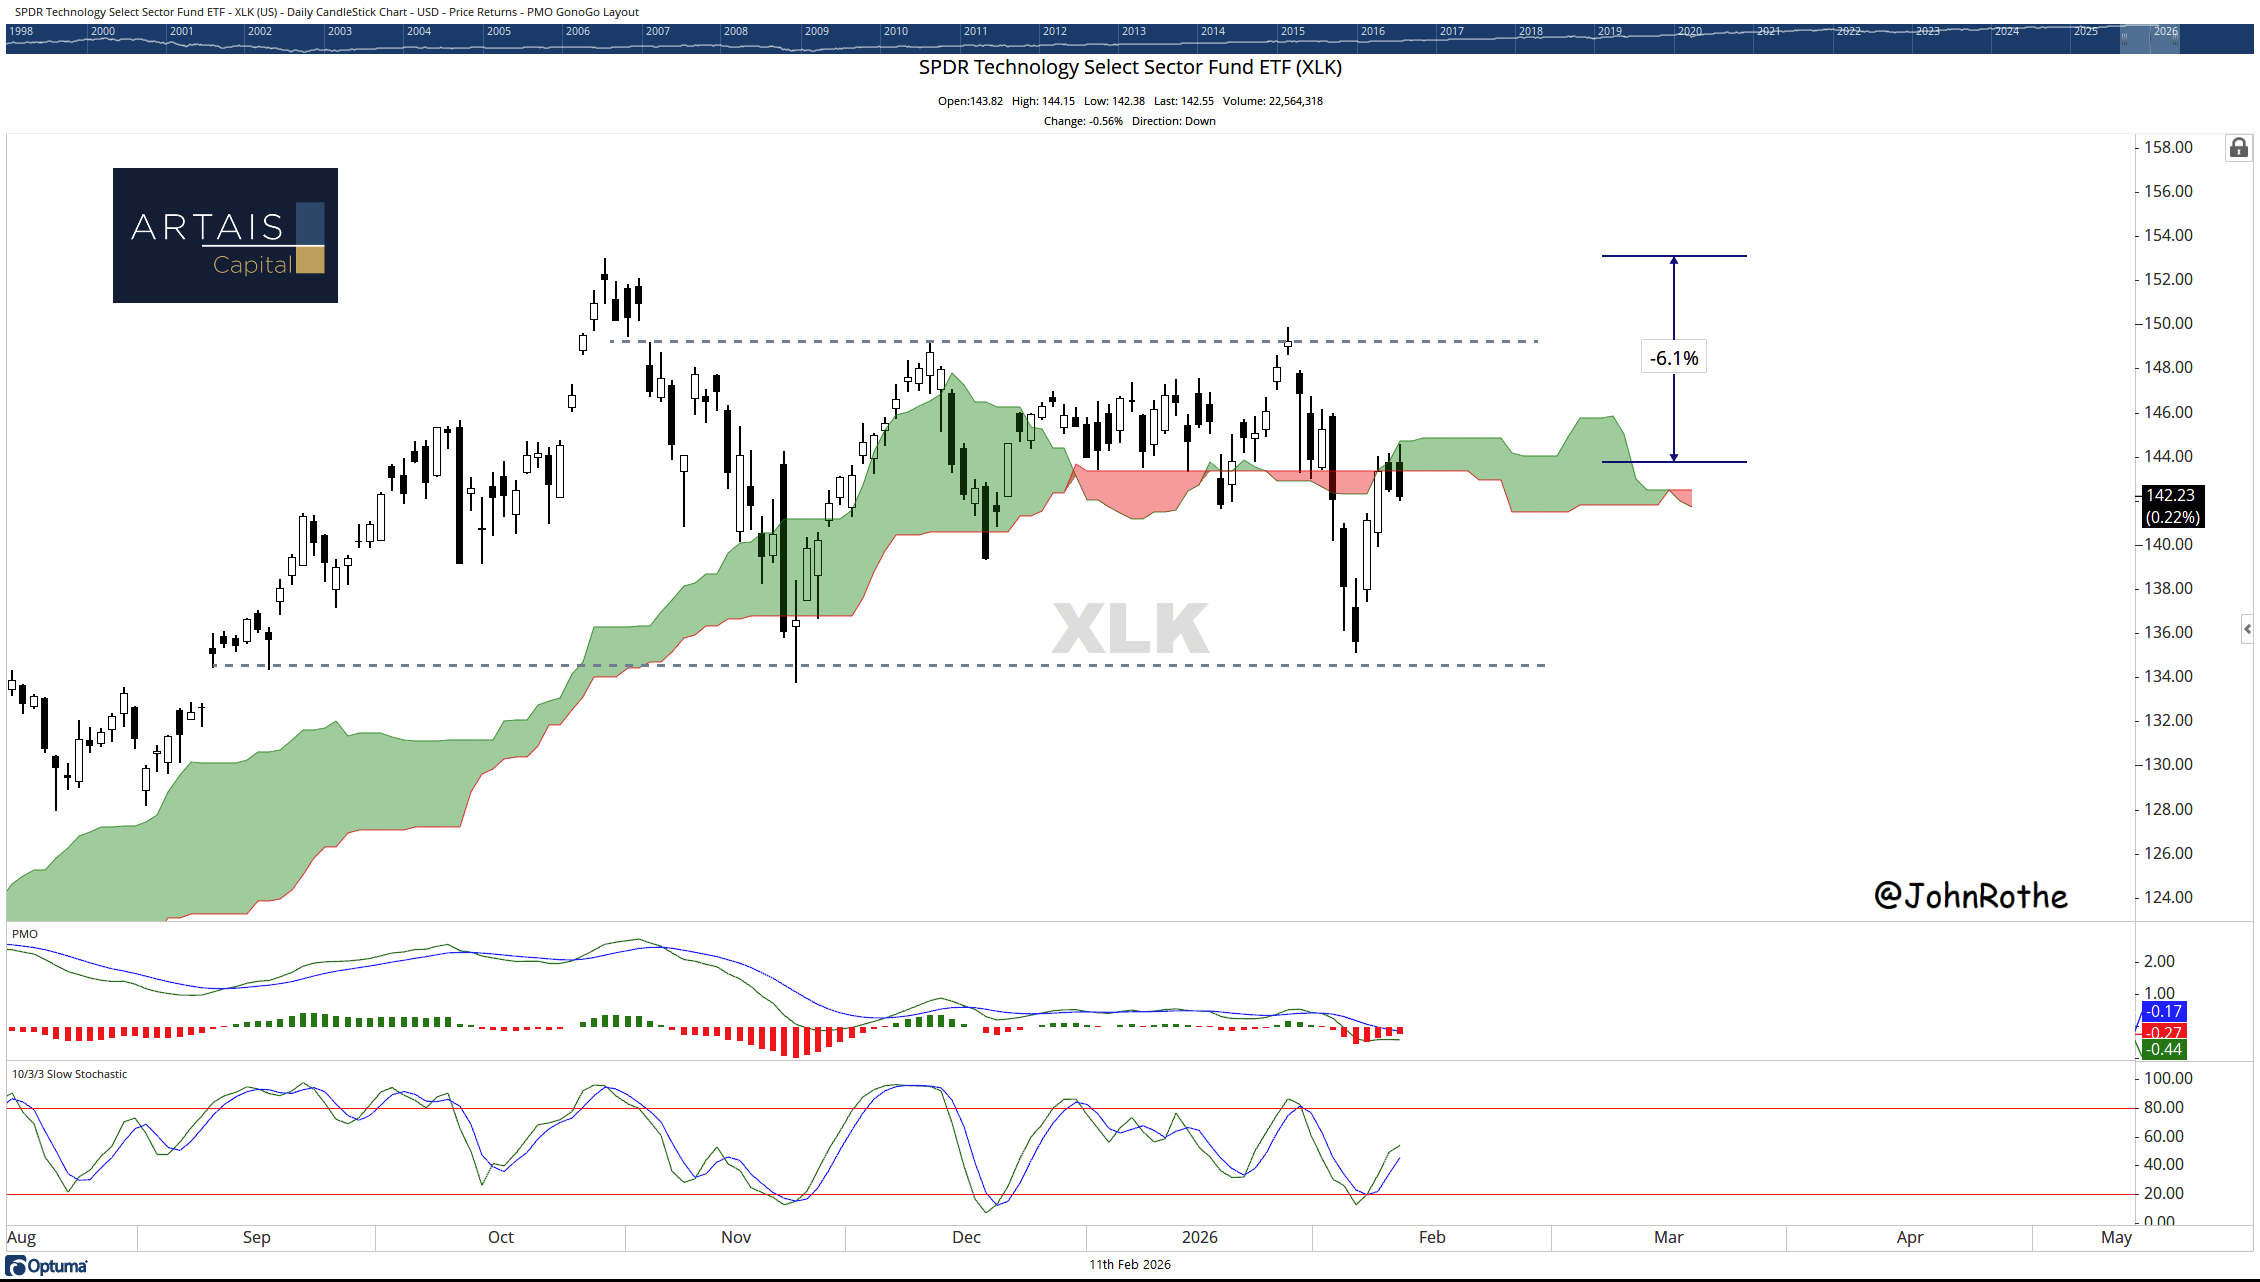
Tech stocks in general look weak and are stuck in a similar sideways trading range, as market watchers are possibly hesitant to allocate too heavily to the sector until NVIDIA begins to break out towards new highs.
Why “Value” is Gaining Momentum
Why now? It’s a combination of “AI fatigue” and a reality check on valuations.
While NVIDIA’s earnings have been stellar, the market is no longer rewarding “good” news; it is only rewarding “perfect” news.
Meanwhile, sectors like Energy and Materials are benefiting from a weaker dollar and a steadying global economy.
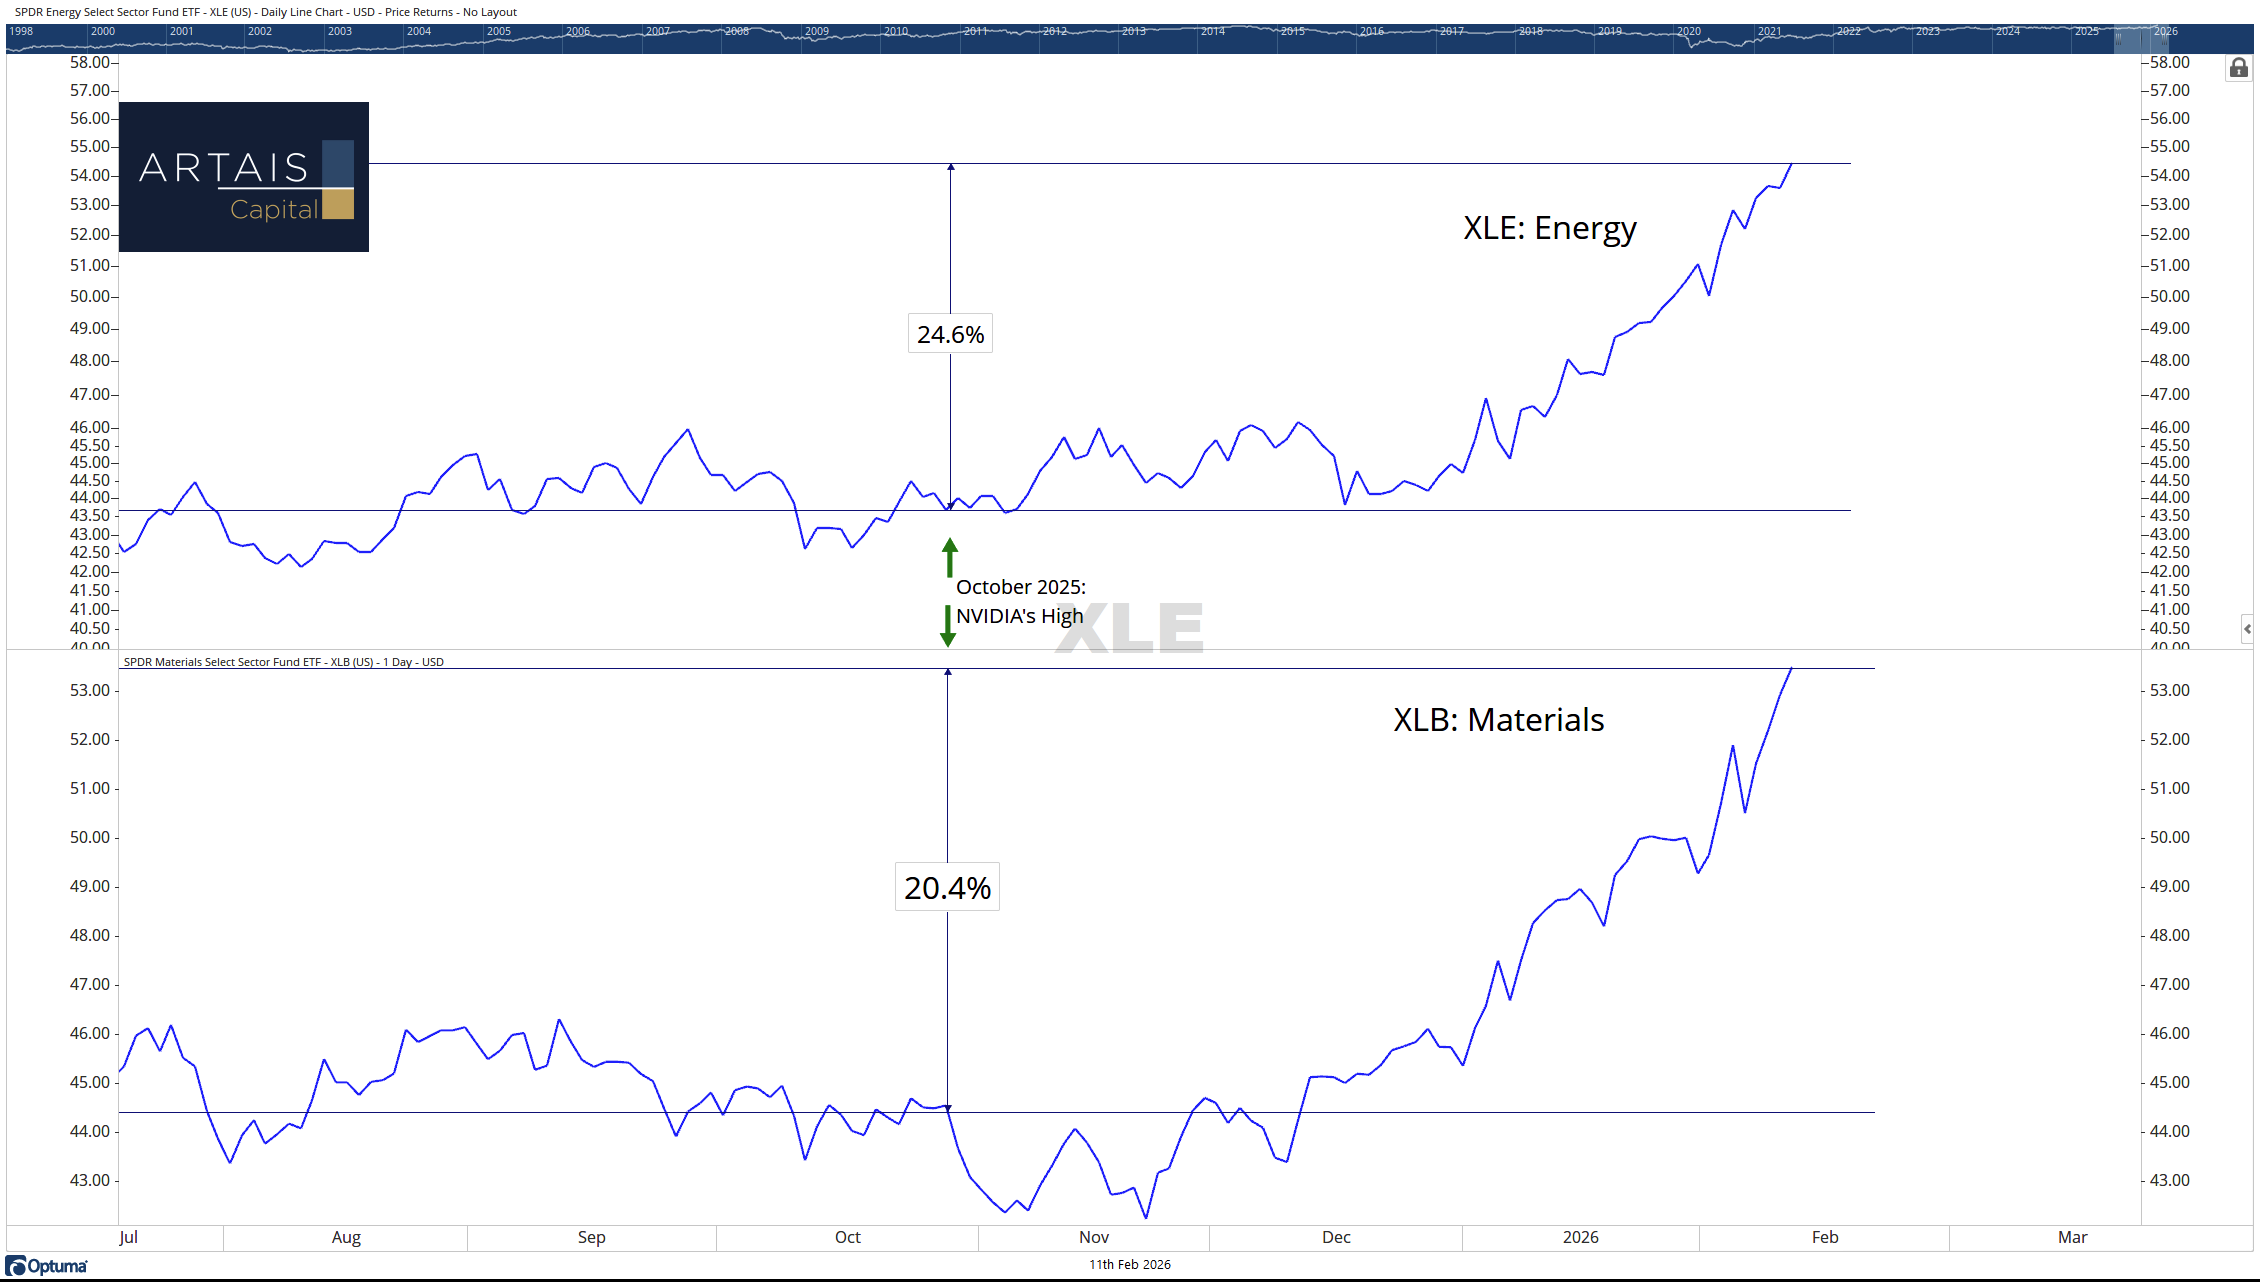
On the RRG, these sectors are currently in the Improving quadrant, showing the strongest “momentum” (the vertical axis) we’ve seen in years. This suggests that the current move into Value isn’t just a one-week fluke—it’s a structural shift in leadership.
The Bottom Line
The “NVIDIA Index” isn’t dead, but it is no longer the only game in town.
By using RRGs to visualize where the money is moving, it becomes clear that the next phase of this bull market likely belongs to the sectors that were left for dead in 2024 - or at least until NVIDIA can reclaim its leadership role again.
If you are still only watching the S&P 500 price, you are only seeing half the movie. It’s time to start watching the rotation.