
Five Weeks of Red: What History Says Comes Next

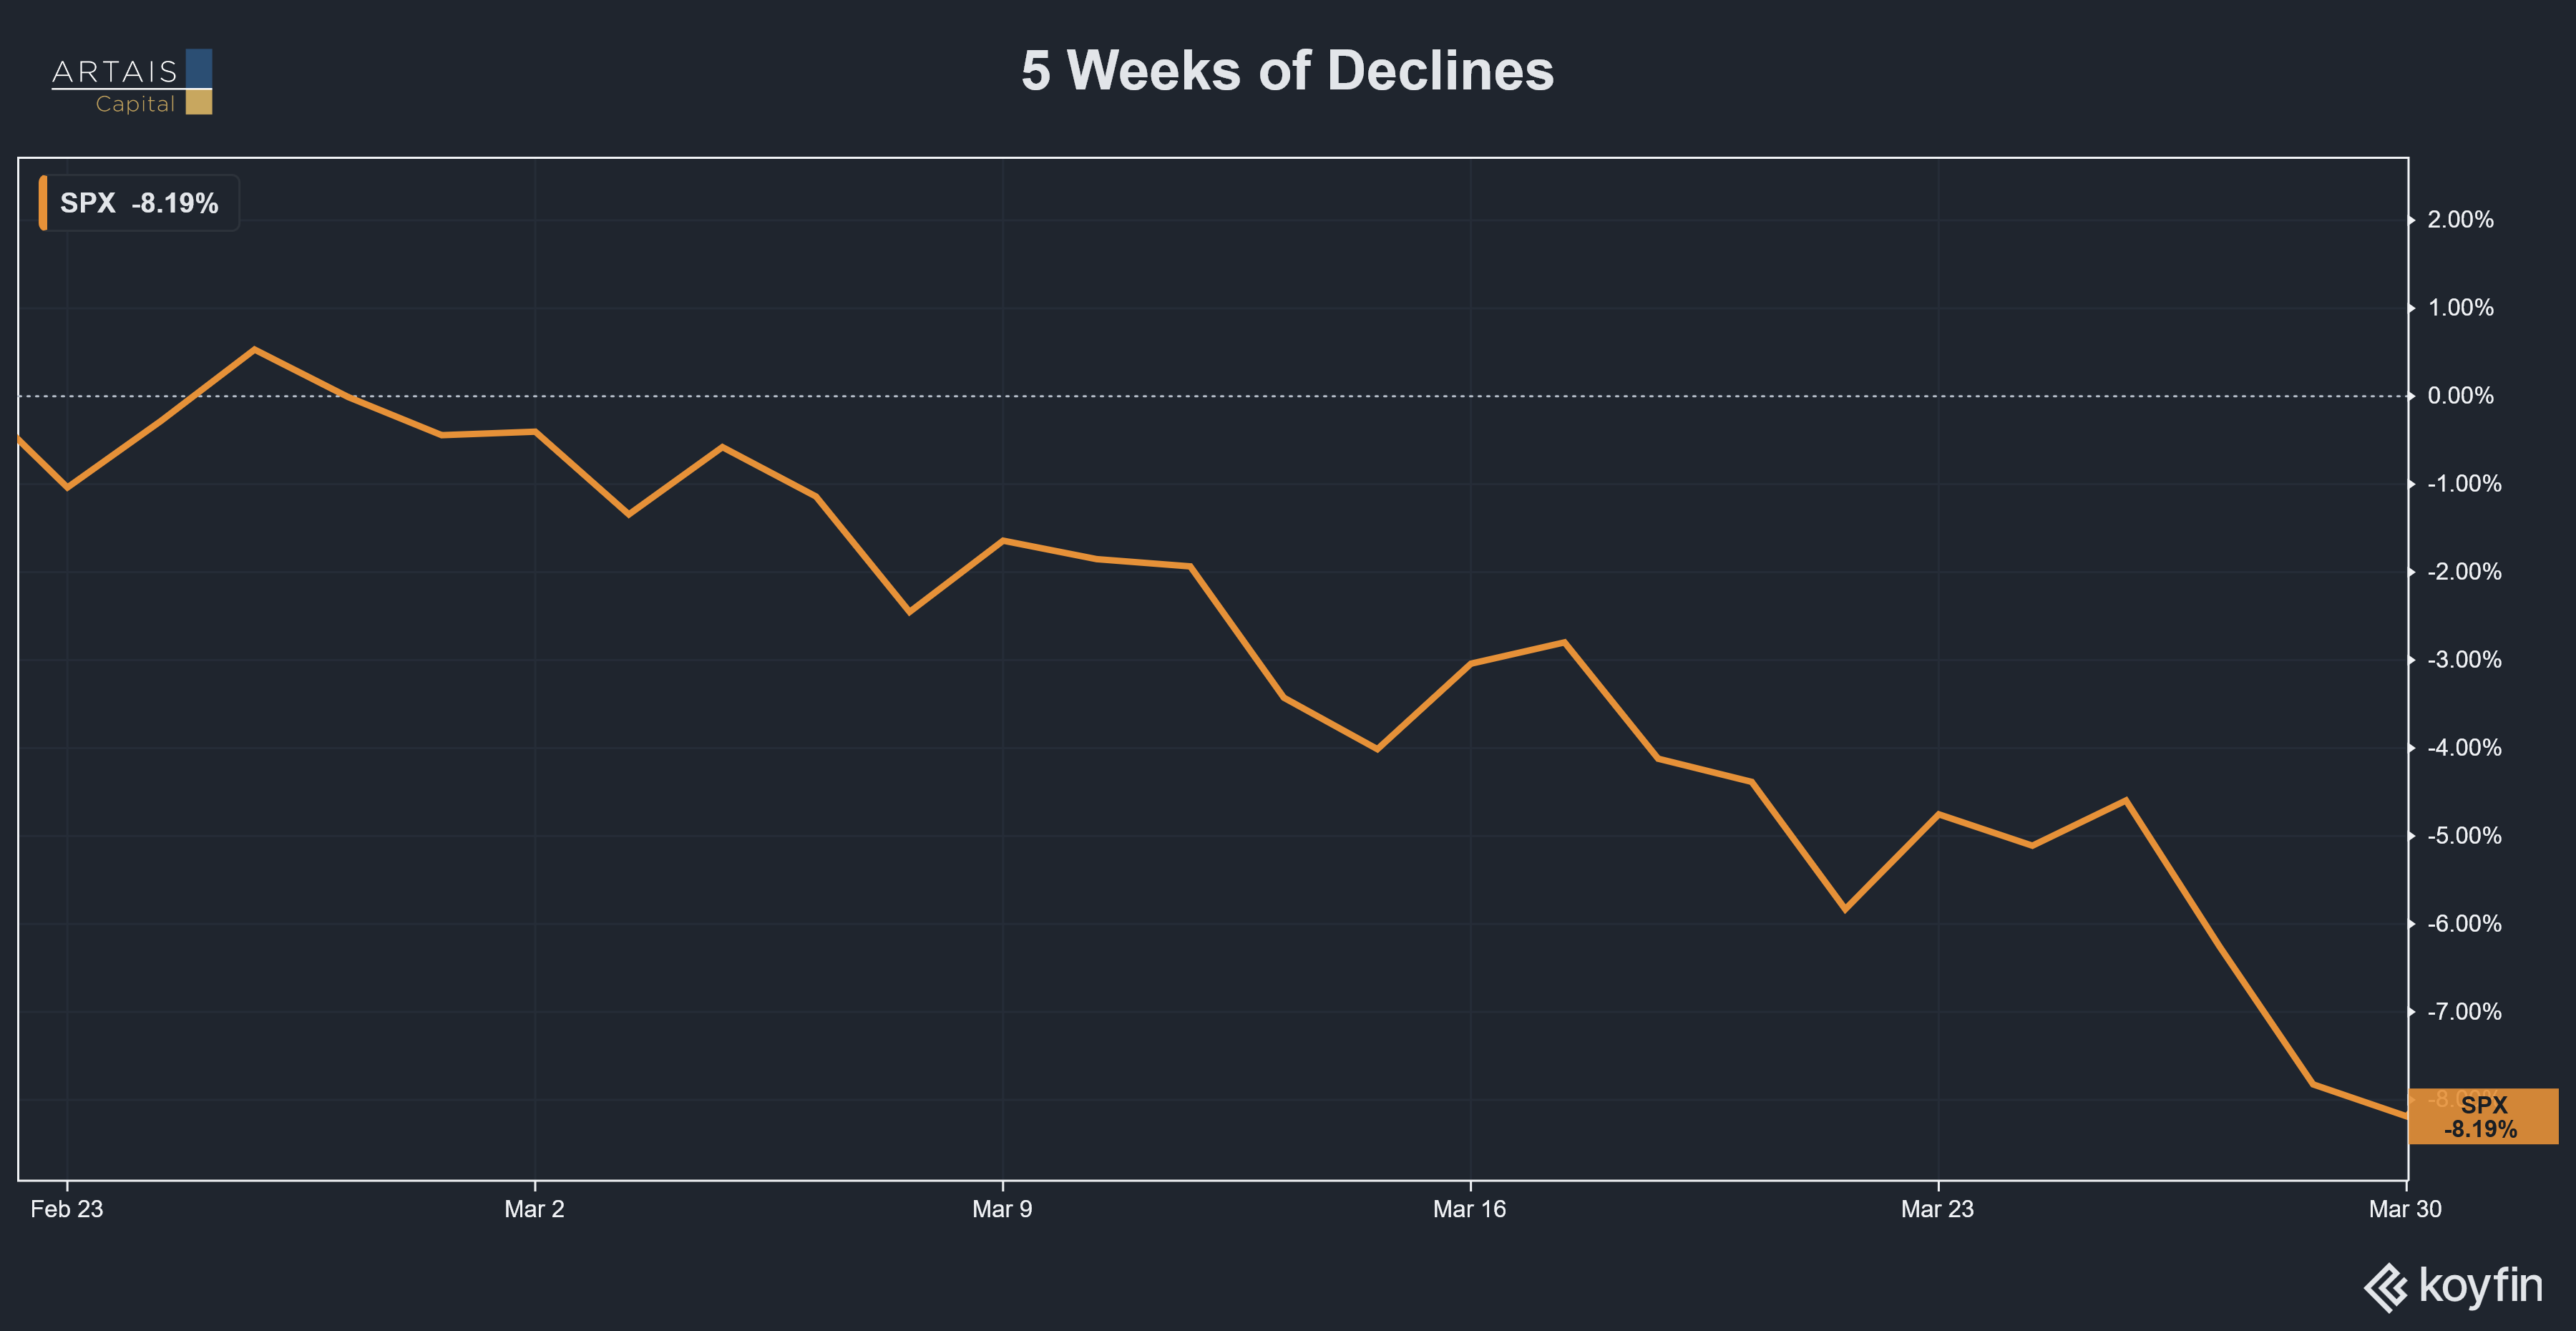
Five Weeks of Declines
The S&P 500 has fallen for five consecutive weeks since late February. This is the longest weekly losing streak since May 2022, when the index fell seven straight weeks during the inflation-driven bear market.
This decline is being driven by the Iran-U.S. conflict, which shut the Strait of Hormuz and pushed Brent crude towards $115 per barrel, injecting a supply shock into an economy that was already showing cracks.
Five weeks of declines in a row may feel ominous. But what does the historical record actually say?
This Has Happened Before: 31 Times Since 1950
Since 1950, the S&P 500 has experienced 31 completed streaks of five or more consecutive down weeks. That works out to roughly once every 2.4 years. The current decline is actually milder than the historical average of 9.5% for these episodes.
So, what happens during the weeks and months after declines like this?
S&P 500: 5+ Consecutive Down Weeks (1951-2022)
Forward Returns from End of Losing Streak
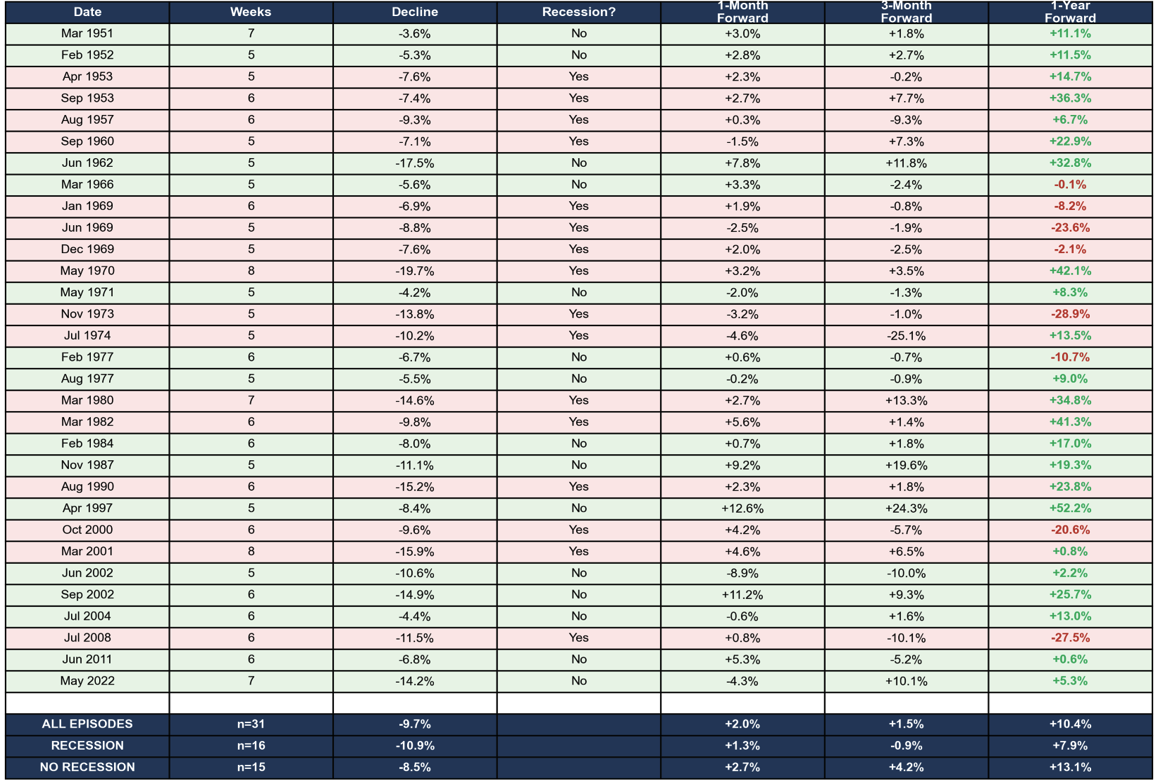
Complete historical data: all 31 episodes of 5+ consecutive down weeks with forward returns. Source: Yahoo Finance (S&P 500 weekly adjusted close). Recession dates per NBER. ARTAIS Capital Management.
One month later, the average return was +2.4%. Markets stabilize quickly; roughly 68% of instances were positive.
Three months later, the average was +4.3%.
One year later, the average return was +10.1%, with 71% of instances positive and a median return of +10.1%.
The range of outcomes, however, is enormous. The best one-year return was +52.2% (April 1997). The worst was -28.9% (November 1973).
The difference between the best and worst case scenarios? Recessions.
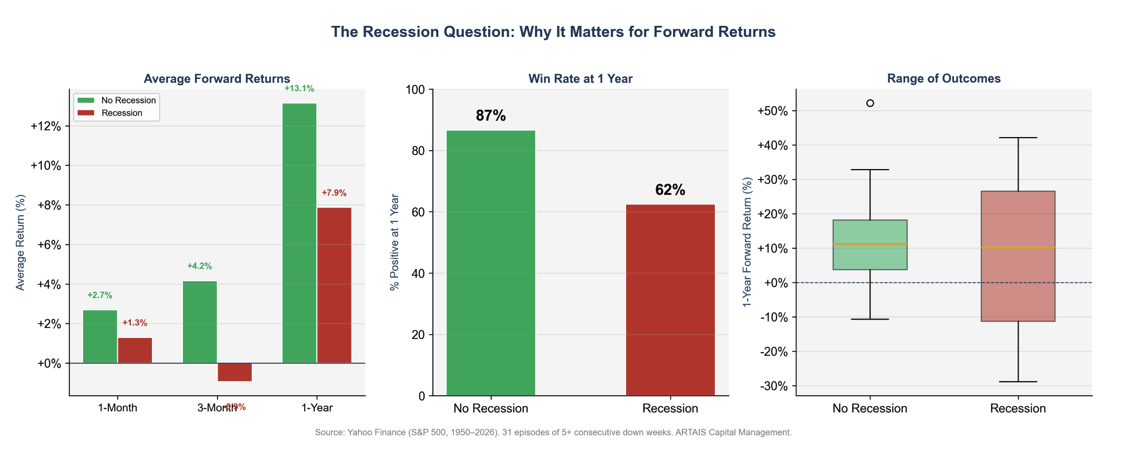
The Recession Question Changes Everything
The single most important variable for forward returns after a five-week losing streak is whether the economy tips into recession.
When these streaks occurred outside of recessions (1962, 1987, 1997, 2004, 2011, 2022), the average one-year forward return was +12.3%, with 81% of episodes producing positive returns. The median was +10.1%. These were buying opportunities.
When they coincided with or preceded recessions (1969, 1973, 2000, 2008), the picture darkened. The average one-year return dropped to +7.9%, but that number is misleading.
The data gets inflated by two massive V-shaped recoveries in 1980 (approximately +34.8%) and 1982 (approximately +41.3%), both of which occurred when the Fed had enormous room to cut rates and did so aggressively.
The worst outcomes (November 1973 at -28.9%, July 2008 at -27.5%, June 1969 at -23.6%) all shared something with today: an external shock combined with a late-cycle economy where the Fed had limited flexibility to cut rates.
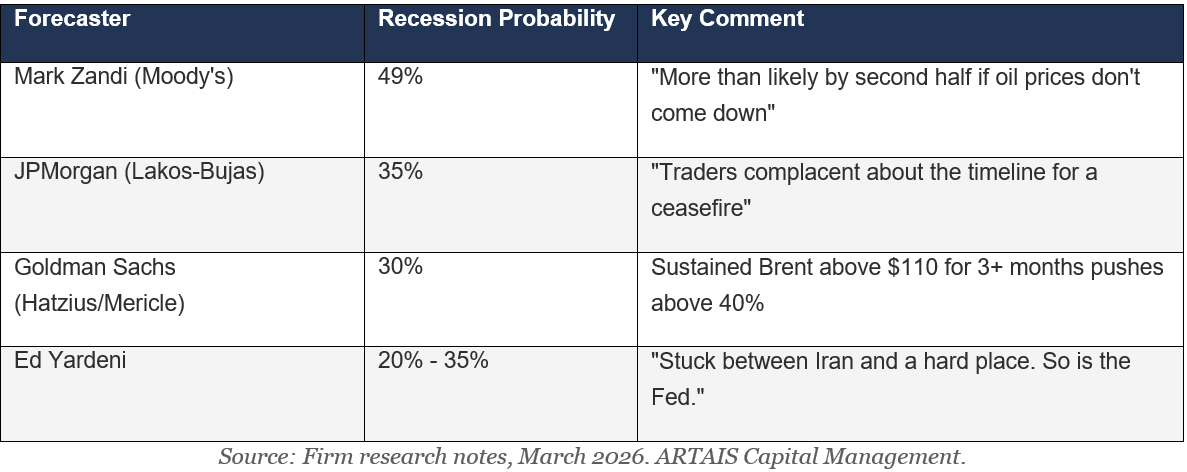
What Are The Chances The US Falls Into A Recession?
Oil prices matter here.
In 1990-91, Iraq’s invasion of Kuwait sent oil prices up 112%. The S&P fell 19.9% but recovered within four months after the conflict was resolved.
In 1973-75, the Arab oil embargo sent crude up over 300%, the S&P dropped 48.2%, and it took over seven years to recover to previous highs.
The difference? In 1990, the Fed had room to cut, and the price shock was temporary. In 1973, inflation was already running hot, the Fed had limited flexibility to cut rates, and the supply disruption lasted much longer.
Currently, I am seeing elements of both, which is why the recession question is so contested right now.
I have been tracking the major Wall Street recession probability estimates since the Iran conflict began on February 28. The range is wide, and every revision has gone in one direction: up.
The Bull Case: Why This Could Be 1990, Not 1973
Oil
Iran de-escalation or Strait of Hormuz reopening. Every oil-shock recovery in the past 50 years began with supply normalization.
In 1991, oil fell 30% within weeks of the Gulf War ceasefire. Diplomatic channels remain active. If a ceasefire materializes, the oil premium unwinds rapidly, and with it the recession probability estimates.
Economic and Market Data
While the data is mixed (which is exactly what you would expect at this stage of the debate), there are some good signs.
ISM is still in expansion territory. Manufacturing PMI at 52.4 (February) and Services at 56.1 (February) remain solidly in expansion.
Initial claims for unemployment are still anchored at roughly 210,000 per week, historically low and inconsistent with a recession that has already started. This is the single most real-time labor market indicator, and it is not flashing red yet.
Sentiment is also getting washed out. Some of the strongest one-year returns in the historical record (1953 at +36.3%, 1980 at +34.8%, 1982 at +41.3%) came after positioning had become extremely defensive.


The Fed
Today, the Fed has ammunition. Unlike 1973, when the Fed was already deep into a tightening cycle, today’s fed funds rate gives the Fed meaningful room to cut.
In 1990 and 2001, the market bottom arrived when investors believed the Fed’s next move would be a cut.
Currently, the futures market has priced in no action from the Fed at their next meeting, but the odds are increasing for at least one rate cut by the end of the year.
Listen closely for any shifts in language from the Fed, indicating future rate cuts.
The AI Cycle
Plus, the AI investment cycle is not over. Over $700 billion in AI-related capital expenditure has been committed by major tech firms through 2027.
While spending has slowed somewhat, as CEOs hedge against a macro downturn, it has not stopped. If the oil shock resolves, the AI buildout resumes as the dominant growth driver.
The Bear Case: Why This Could Be Worse Than It Looks
Oil
Oil above $100 is a tax on everything. Goldman Sachs estimates that every $10 increase in oil prices shaves approximately 0.1 percentage points off GDP growth.
With Brent up roughly $35 since the conflict began, that is a 0.35% GDP drag before any second-order effects.
Current Traffic — HORMUZ STRAIT; Source: MarineTraffic.Org
The International Monetary Fund estimates that a 30% oil price increase reduces global GDP by up to 0.5 percentage points. We are well past that threshold. Unlike 1990, when the shock lasted four months, the Strait of Hormuz remains at near-zero traffic with no credible timeline for reopening.
Economic Data
Again, the data is mixed. The February payroll numbers showed that the economy created only 181,000 total jobs in all of 2025. February saw a job loss of 92,000, the third time in five months that the economy lost jobs.
The labor market is not falling off a cliff. It is eroding slowly, which is exactly how the early stages of past recessions have looked.
Consumer spending is fading, as the University of Michigan consumer sentiment is at 53.3.

Real consumer spending growth has decelerated. Higher gas prices act as a regressive tax, hitting the bottom 60% of households hardest.
The Fed
The Fed may be trapped due to its dual mandates: maximum employment and stable prices. Meanwhile, Core PCE (inflation) remains above 3%, and rising oil prices are pushing headline inflation higher.
But the labor market is weakening, and growth is slowing. Cutting risks re-igniting inflation. Raising or keeping rates at current levels risks a deeper downturn. There is no clean option.
The same stagflation trap preceded the worst outcomes in 1973-74.
Tariffs are compounding the oil shock. Section 122 surcharges of 10-15% on imports are adding to cost pressures independent of oil.
Unlike oil prices, tariffs do not reverse with a ceasefire. The combination of supply-side inflation from oil and tariffs narrows the Fed’s room to respond with rate cuts.
The Private Credit Issue
Then there is the problem of escalating private credit stress. Apollo and Ares have gated redemptions on several funds after receiving over 11% in quarterly redemption requests. KKR’s Future Standard fund was downgraded to junk by Moody’s.
JPMorgan estimates that 30% of the $1.8 trillion private credit market is lent to software companies, precisely the sector most vulnerable to an AI-related spending pullback.
Private credit barely existed during the last recession. Nobody knows exactly how the stress will impact the economy or the markets.
The Bond Market
The yield curve un-inversion deserves attention. The 2-year/10-year spread un-inverted in late 2025 after the longest inversion in history.
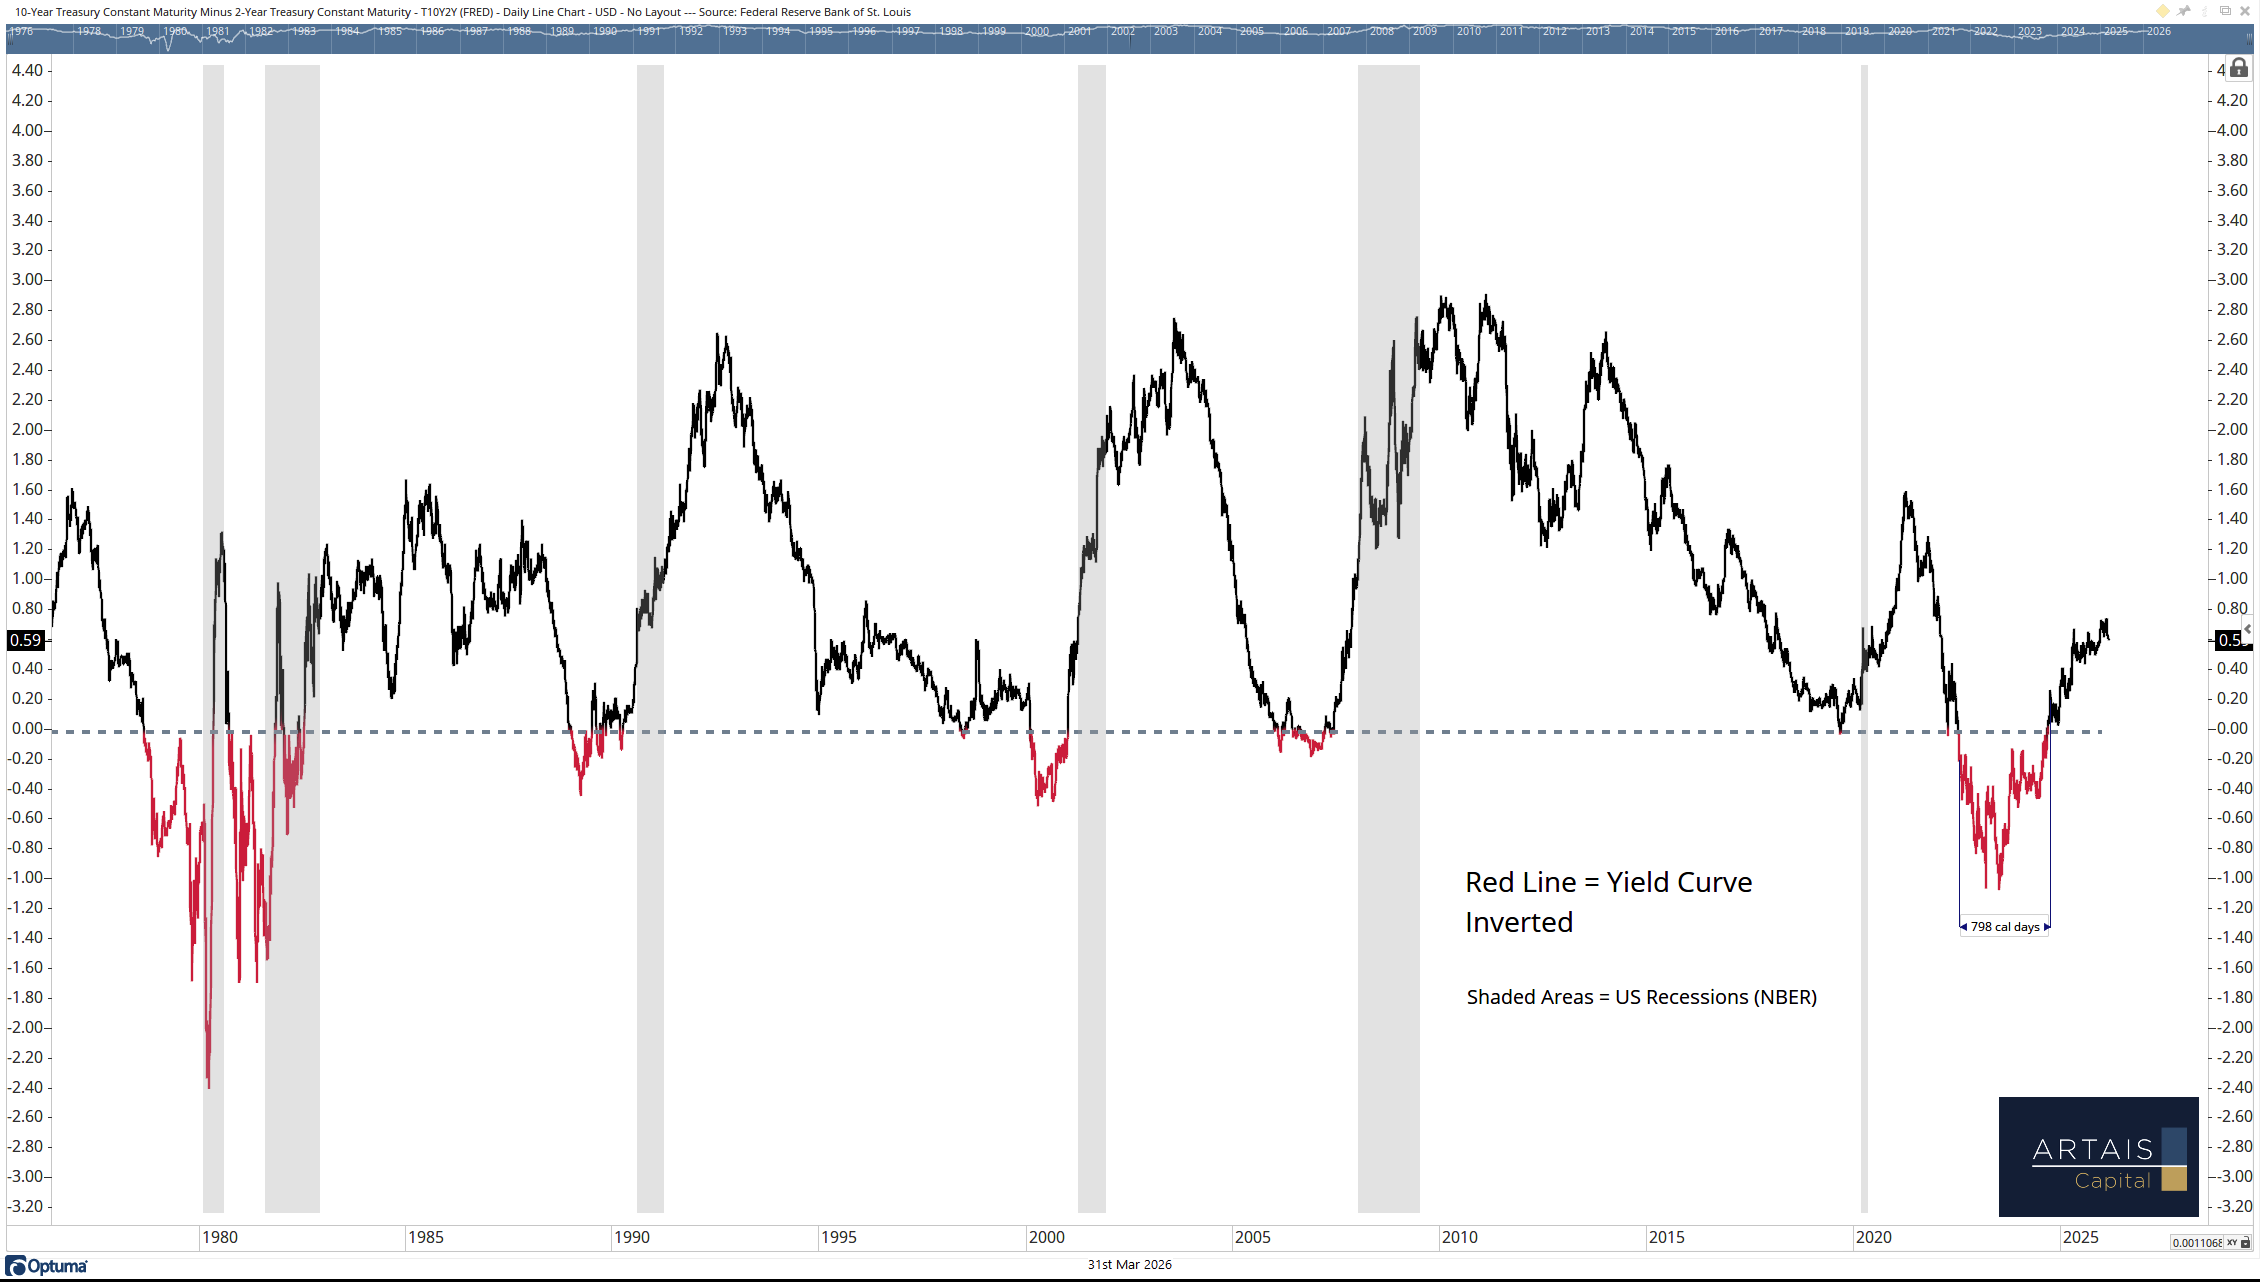
Historically, un-inversion has preceded every recession since 1989, with a median lead time of about five months. We are roughly four months past un-inversion now. That does not guarantee a recession, but it puts the clock in a historically uncomfortable zone.
Where This Leaves Investors
Watch the charts. Charts, in my opinion, are one of the greatest tools to get an insight into how investors are positioning themselves.
Are they buying at key levels, where they can buy strong names on sale? Or has something changed their outlook and they no longer believe that current prices are “a deal” because a recession is right around the corner?
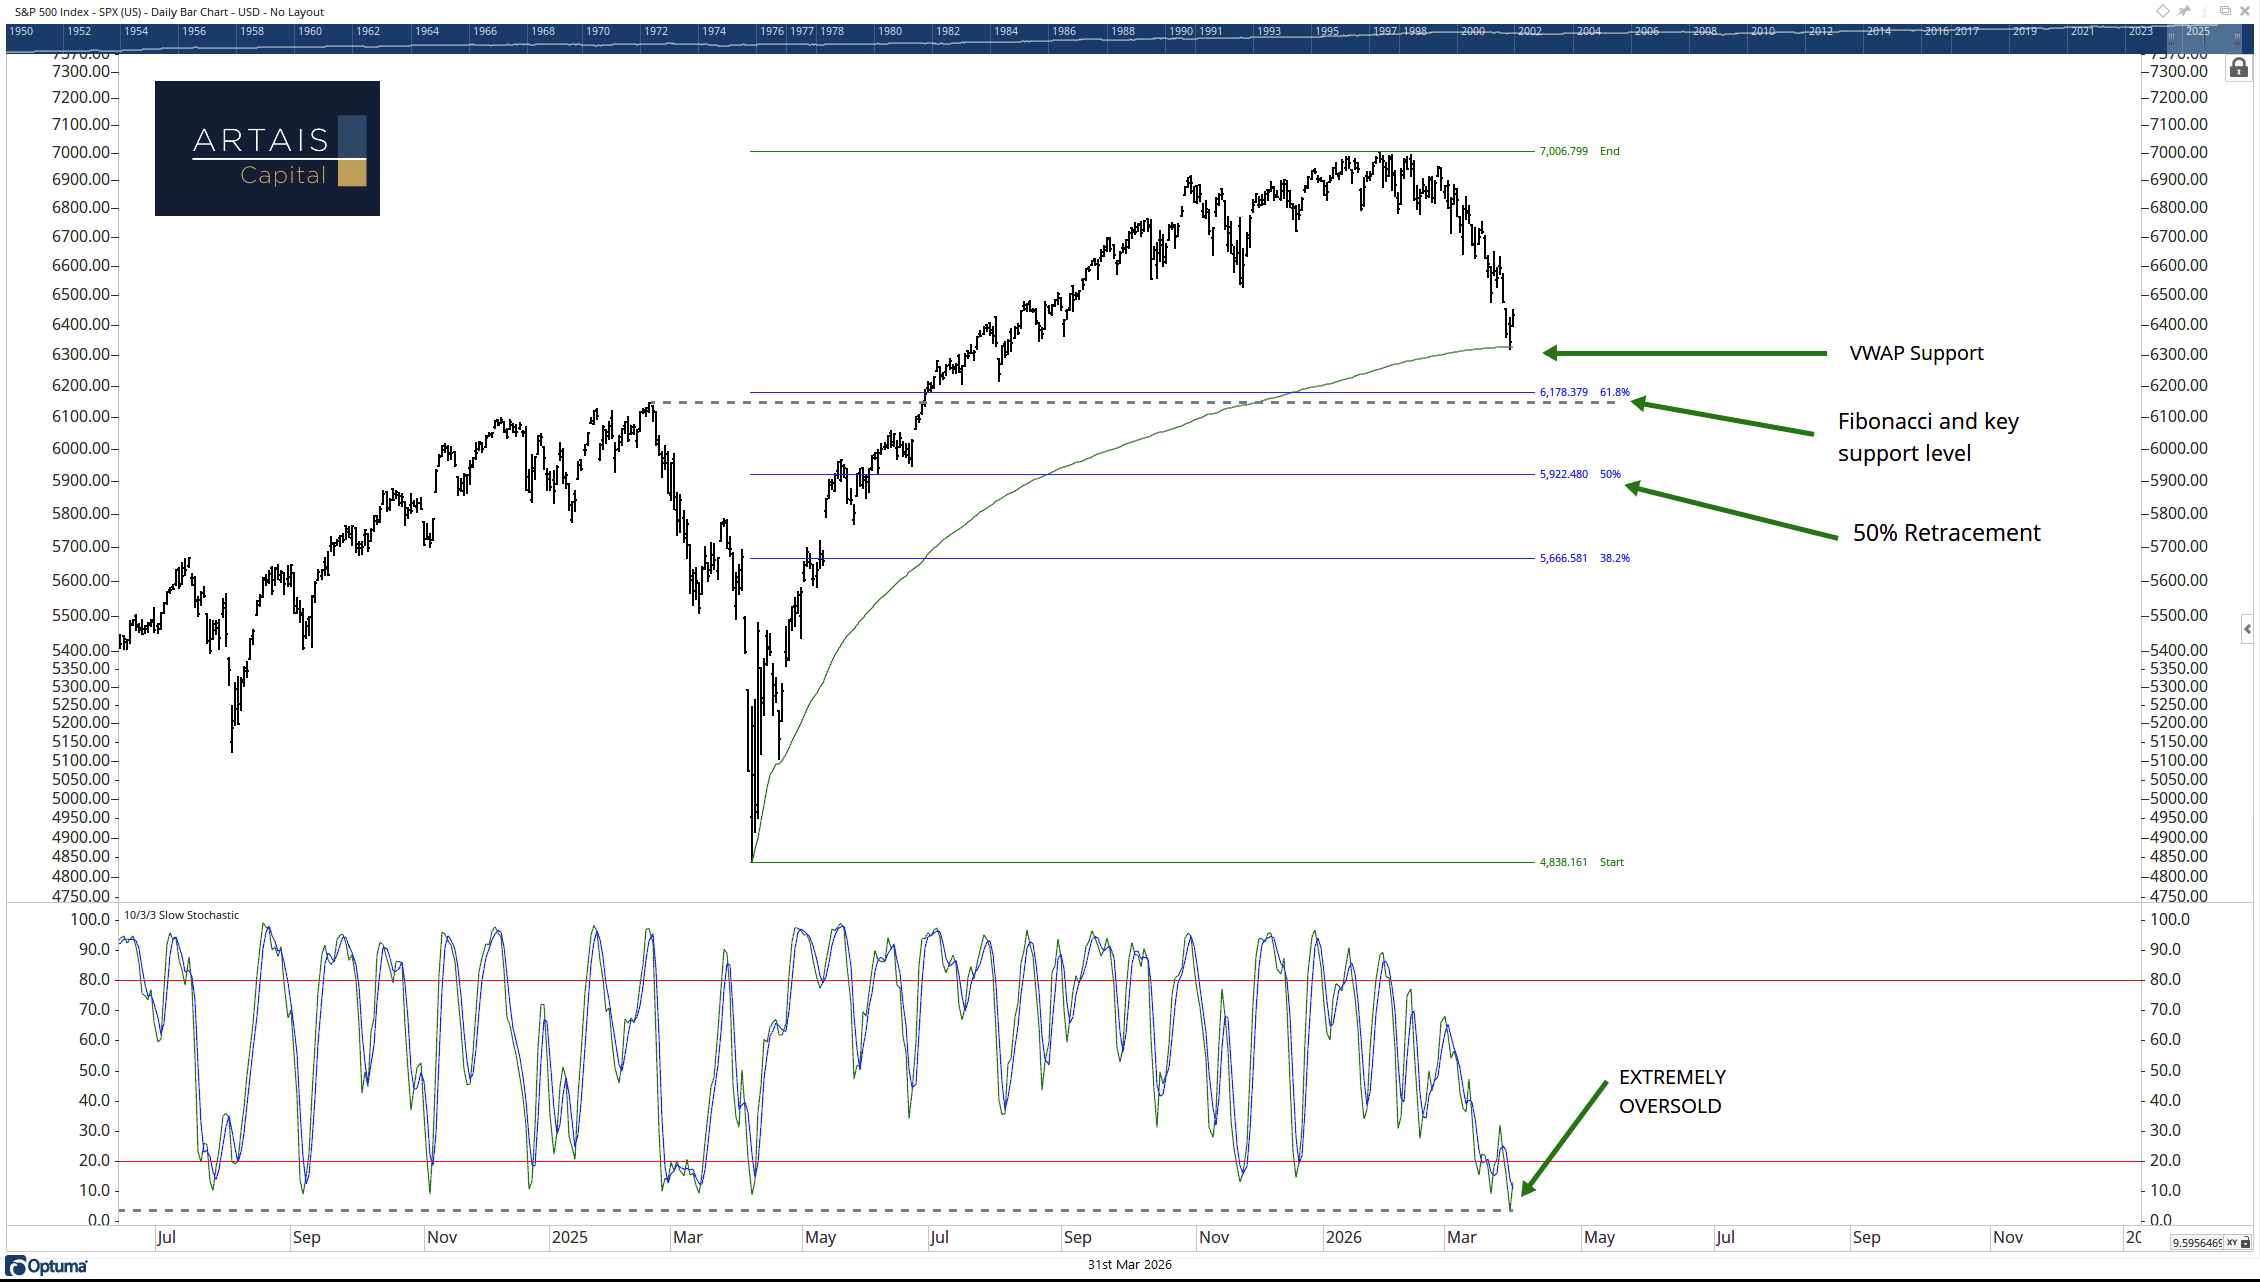
Currently, the S&P 500 has pulled back to some important levels. Keep an eye on how the market reacts at these levels.
History says this five-week decline is likely a buying opportunity with strong 12-month forward returns, if the economy avoids recession.
The bulls can point to unemployment claims data, ISM readings, and the possibility of an Iran resolution.
However, if the economy tips into recession - and the bear case has its own compelling logic: the oil shock severity, payroll deterioration, and private credit stress - then the current decline could be just the opening act of a larger drawdown.