
Inflation Just Hit 4.2%. Take Out Oil And It's 2.9%.
Unfortunately it's not that simple

Last week I wrote an article titled “Are We Headed For A 1970s-Style Second Wave?”, where I discussed the trajectory inflation took during the 1970s.
I wanted to take a deeper dive into the impact that rising oil prices have on inflation. Is it a short-term impact? What does inflation look like when oil is removed? Is there a trickle-down effect?
Let’s take a closer look…
Yesterday morning, the Bureau of Labor Statistics reported that consumer prices (CPI) rose 4.2% over the past year. This morning, it followed up with a producer price index (PPI) report that included a record data series.
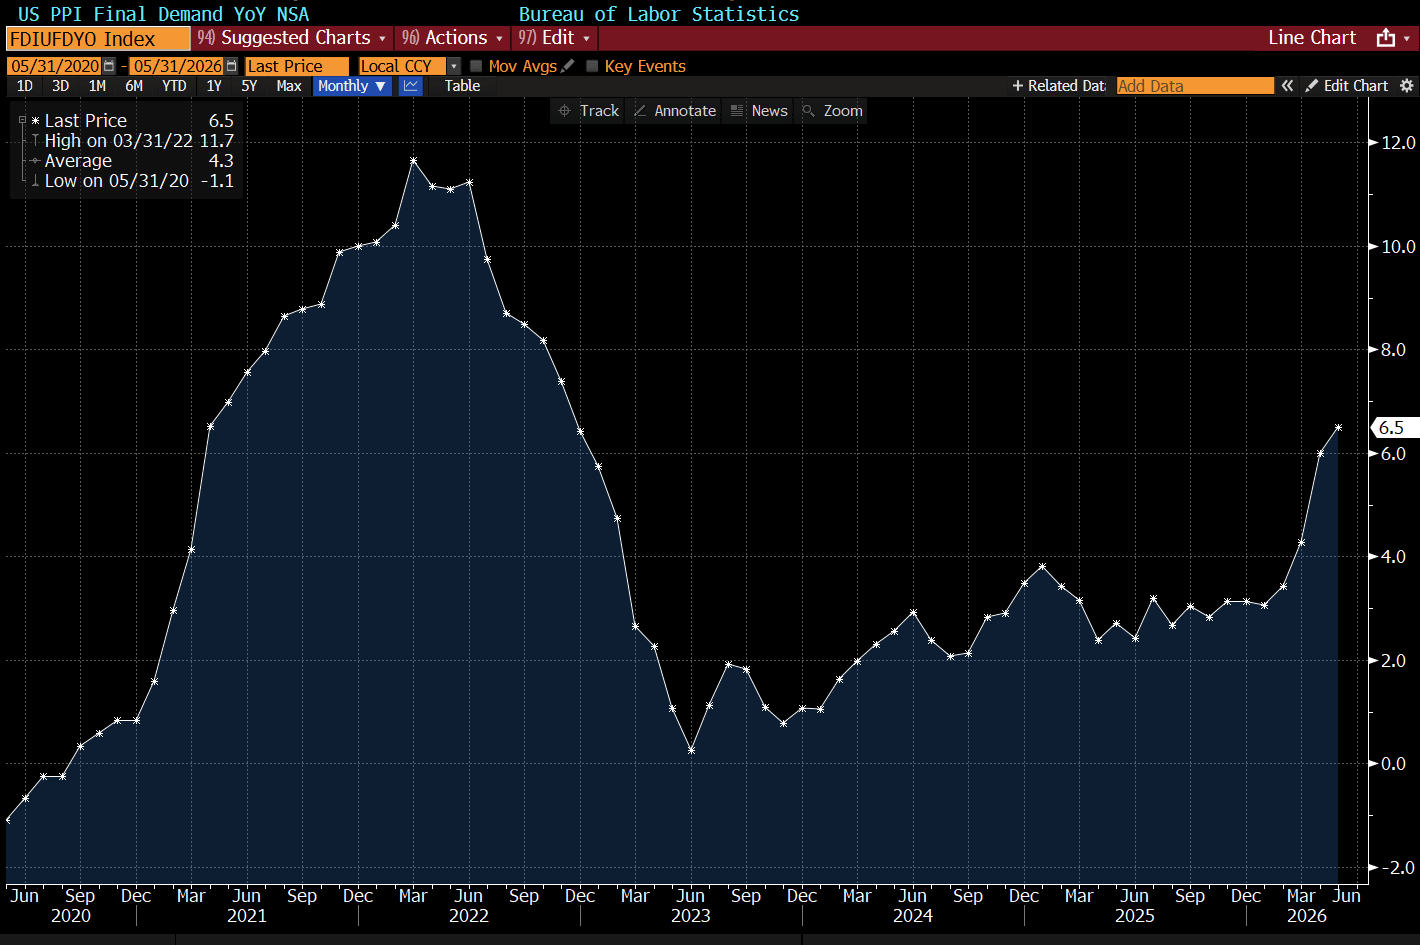
Two hot prints in two days, six days before new Fed Chair Kevin Warsh holds his first FOMC meeting.
So is inflation actually as bad as 4.2% sounds? The honest answer is both less and more.
Is Inflation as Bad as the Headlines Say?
Less than it looks, in one important way. The core reading — everything except food and energy — rose just 0.2% in May, below forecasts, and sits at 2.9% year over year. Forecasters were expecting worse.
The gap between 4.2% headline and 2.9% core is the whole story of this report.
When those two numbers diverge that much, it usually means one category is doing the damage rather than prices rising everywhere at once.
That’s exactly what the category data shows.
But there’s a “more” side too, and it showed up this morning.
The Producer Price Index measures what businesses pay each other before costs ever reach you.
Inside the PPI data is what is called Stage 1 intermediate demand; the rawest industrial inputs, ie very start of the supply chain. This jumped 3.2% in May alone. That’s a record for the series. Year over year, those input costs are up 12.3%.
Consumer inflation tells you where prices have been. Pipeline inflation hints at where they might go. Right now pipeline inflation is rising.
Where is Inflation Hitting the Hardest?
The May report reads less like an inflation report and more like an oil report with footnotes.
What’s Going Up:
· Gasoline: +40.5% year over year
· Airfares: +26.7% — jet fuel is an airline’s second-biggest cost
· Energy overall: +23.5%, accounting for more than 60% of the monthly increase
What’s Not:
· Shelter: +3.4% and decelerating — the biggest component of CPI is cooling
· Food: +3.1% — elevated but stable
· Used cars: −2.0% — actually falling
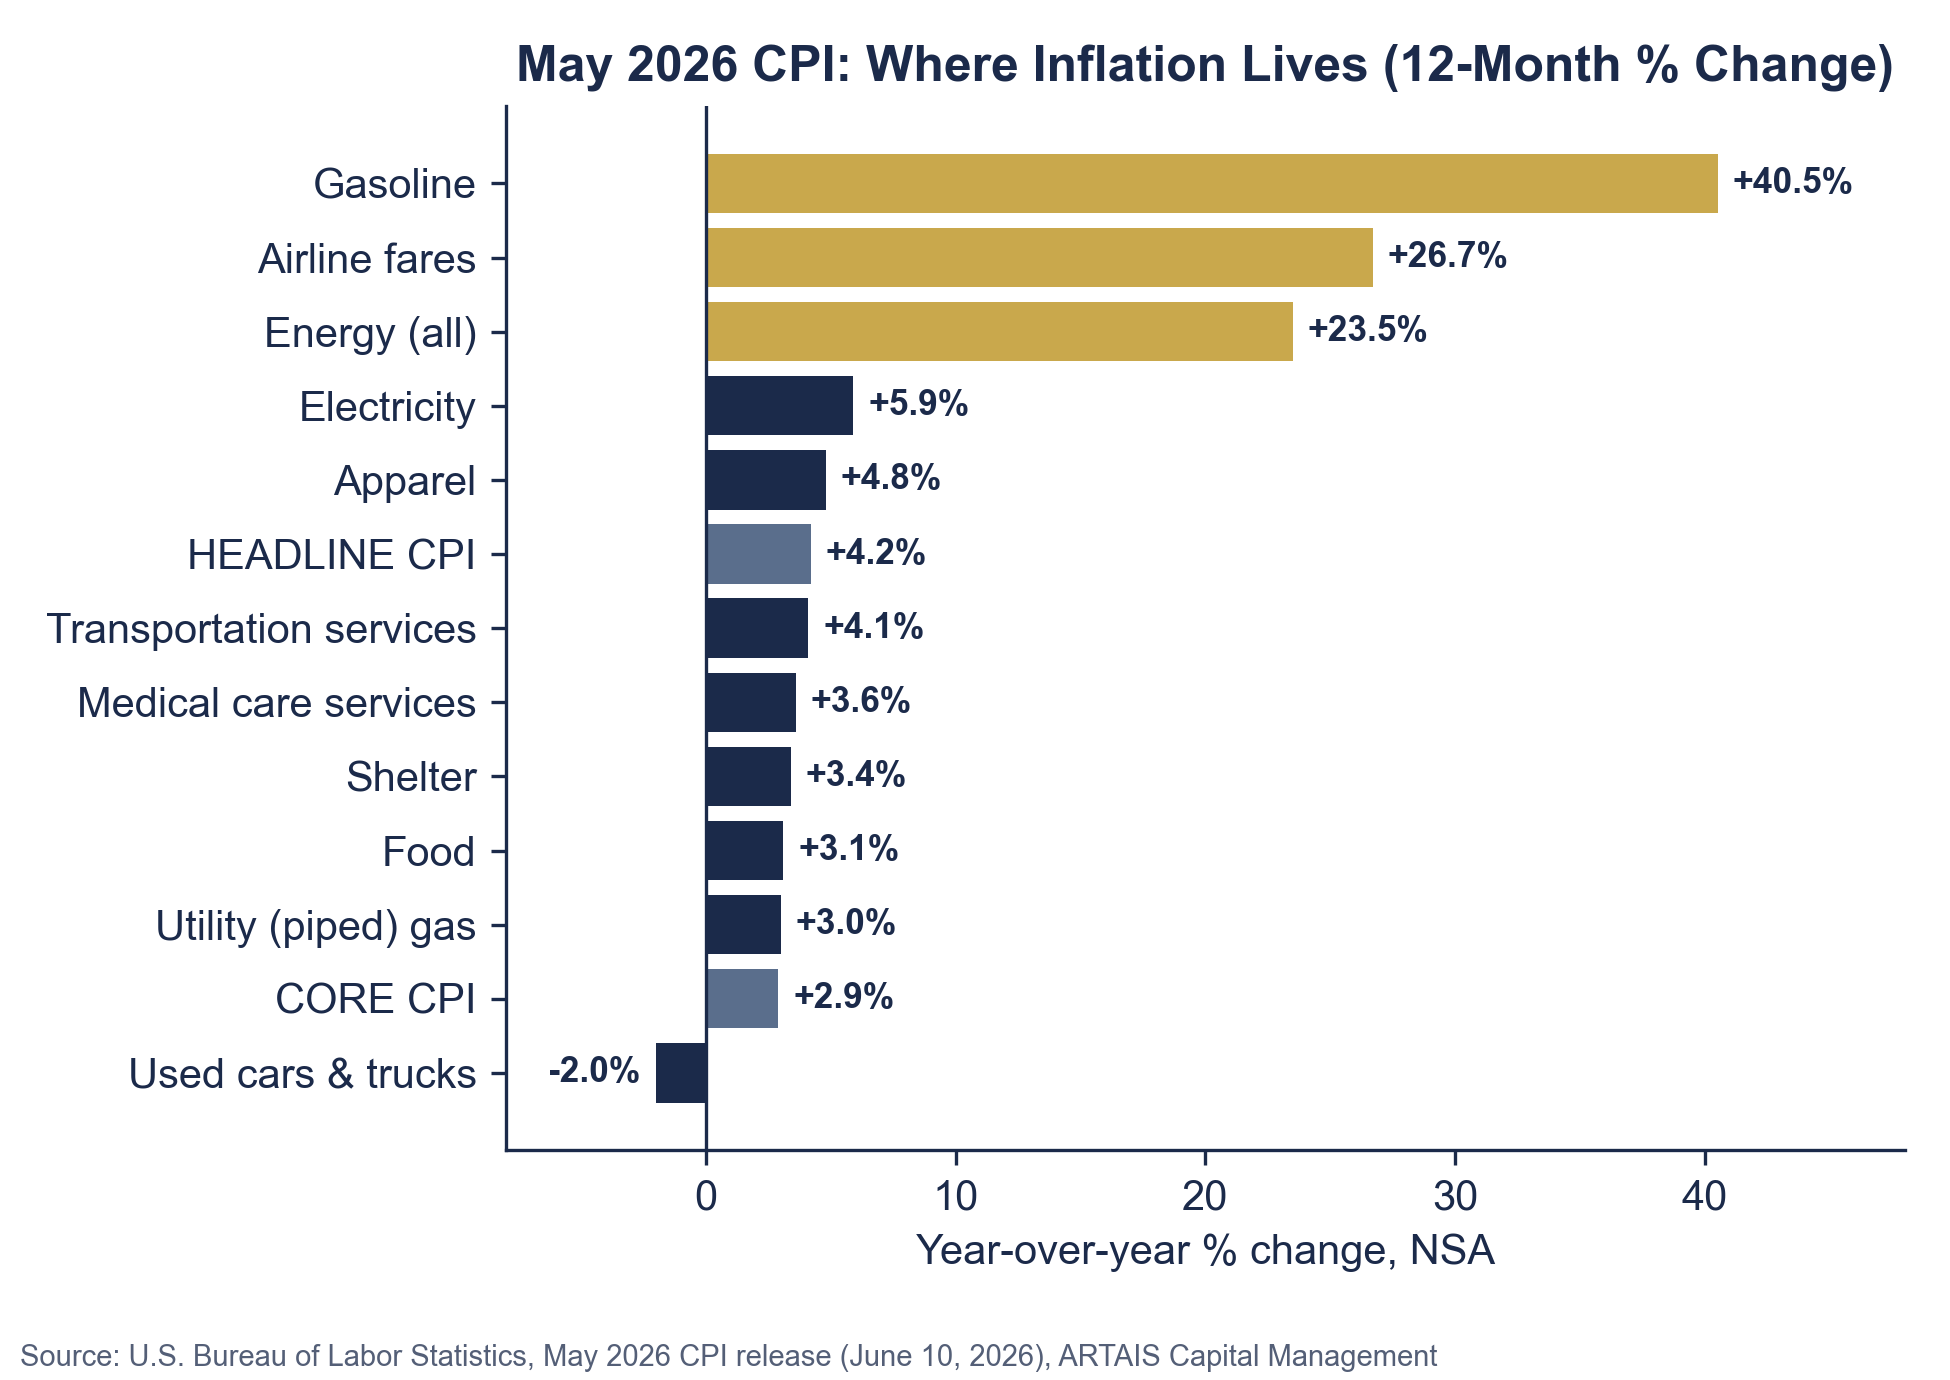
The data is indicating that we are dealing with a narrow rise in inflation, not a broad one.
In 2022, price increases were everywhere: goods, services, rent, wages. This time inflation is more focused.
What Happens When You Take Oil Out?
The Bureau of Labor Statistics (BLS) publishes a series called “all items less energy” — the full consumer basket with energy removed.
It’s running at roughly 2.9%. In February, before the war and the Hormuz closure, headline CPI was 2.4%.
So the arithmetic answer is yes: remove oil and inflation drops dramatically, from 4.2% back to the high 2s, within shouting distance of the pre-war trend.
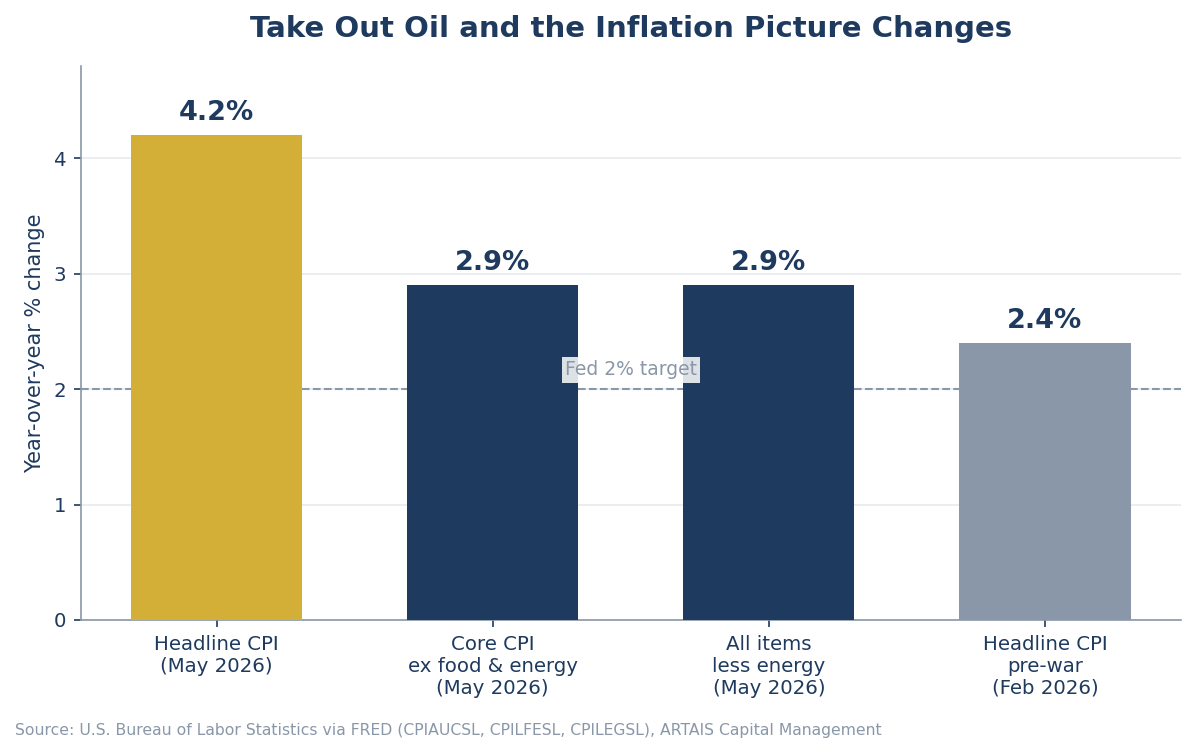
But the arithmetic answer is also a little too convenient, because oil doesn’t politely stay in its own category.
Do Higher Oil Prices Trickle Into Everything Else?
They do. But the better question is “how much and how fast?”.
Economists at the Federal Reserve Board studied exactly this (Conflitti and Luciani, 2017). Their finding: a 10% rise in oil prices adds roughly 0.1 percentage point to core inflation, spread over about two years.
Apply that to today. WTI crude went from about $67 before the conflict to roughly $91 now, with a spike to $113 at the worst of it. Call it a 36% sustained move. The Fed’s own framework says that should eventually push core inflation up by around 0.3 to 0.4 percentage points, slowly across eight quarters.
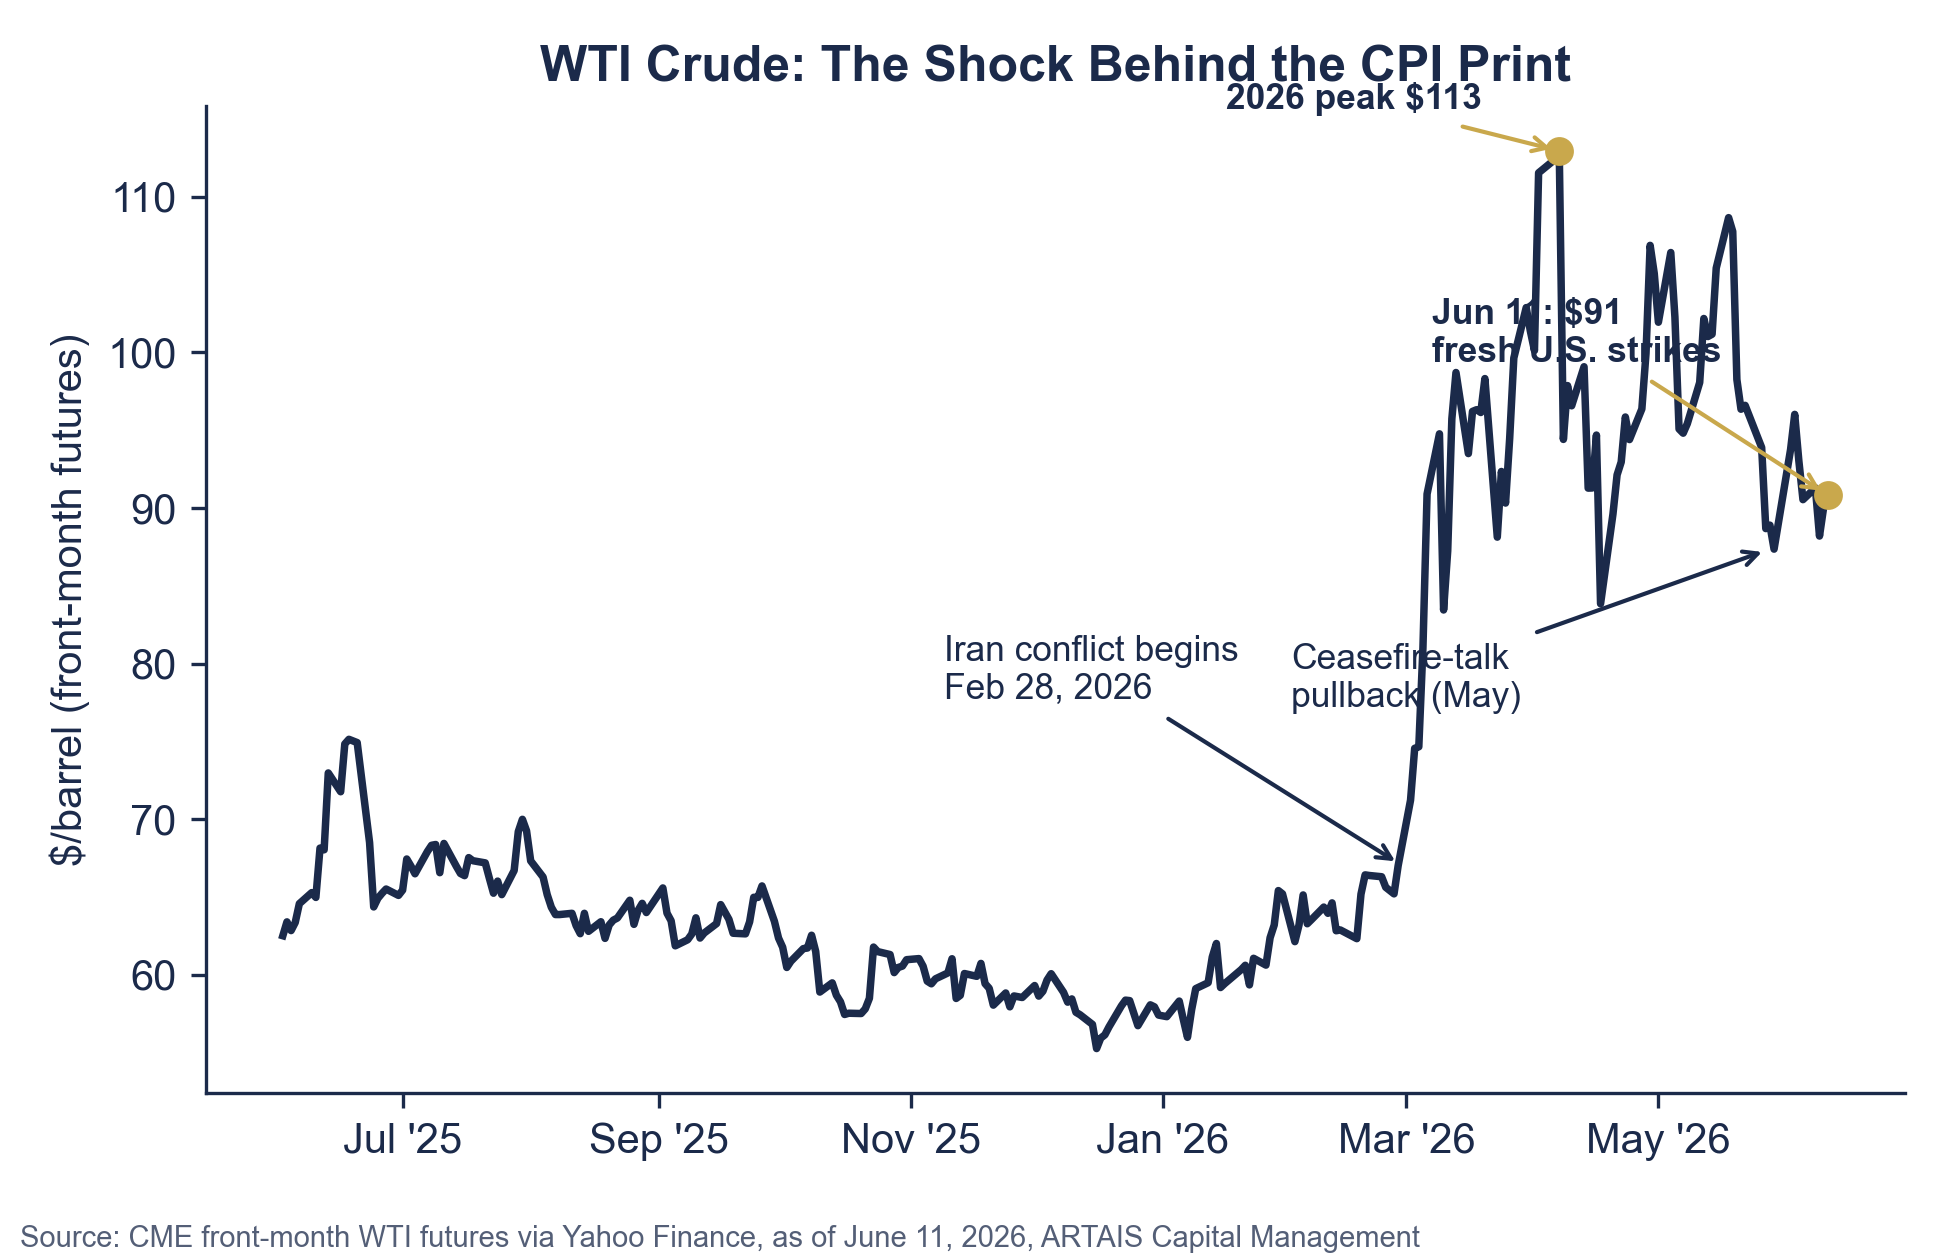
That’s real, and it’s why the Fed can’t simply ignore oil. But notice what it isn’t: it isn’t 4.2% inflation.
The direct, immediate effect of oil at the pump is enormous. The indirect effect on everything else is much slower.
Two things would change that math, and both deserve watching.
First, that record PPI intermediate-demand number — if input costs keep compounding at that pace, the pass-through estimates start to look dated.
Second, expectations. The slow inflation growth research assumes people keep believing inflation will come back down. The 1970s went wrong when they stopped believing it.
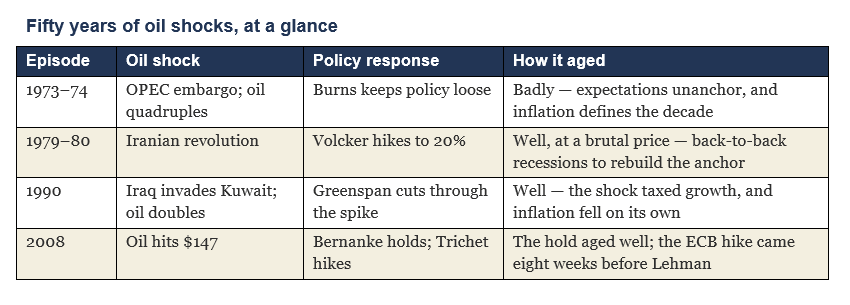
How Have Central Banks Handled Oil Shocks?
This is where history gets opinionated. Four episodes, four verdicts:
1973–74, Arthur Burns: Accommodate. (Wrong.) OPEC quadrupled oil prices, and Burns’s Fed kept policy loose. They reasoned that oil inflation wasn’t the Fed’s fault. Inflation expectations broke loose, and the 1970s became the decade of inflation.
1979–80, Paul Volcker: Hike to 20%. (Right, and brutal.) Cleaning up after Burns required a federal funds rate of 20% and back-to-back recessions. The lesson wasn’t that oil shocks demand 20% rates — it’s that letting expectations unanchor makes the eventual solution catastrophic.
1990, Alan Greenspan: Cut. (Right.) When Iraq invaded Kuwait, and oil doubled, Greenspan read the shock as a tax on growth rather than the start of an inflation spiral. The Fed cut through the spike. Inflation fell on its own as the economy slowed.
2008, Ben Bernanke vs. Jean-Claude Trichet: Hold vs. Hike. Oil hit $147 in July 2008. Bernanke held rates. Trichet’s ECB raised rates that same month — eight weeks before Lehman failed. That hike has been catalogued as one of the great modern policy errors, twice over, since the ECB repeated a version of it in 2011.
And the old debate has restarted. The ECB raised rates 25 basis points today — its first hike since 2023 — while futures markets price roughly a 98% chance the Fed holds next week.
Frankfurt and Washington just picked opposite sides of the 2008 argument again. History already picked a side once. We’re about to find out if it repeats.
Will High Oil Prices Do the Fed’s Job For Them?
This is the most underrated question in the whole debate, and it’s the strongest argument for holding rather than hiking.
Expensive oil is a tax. Every dollar a household spends on $5 gasoline is a dollar not spent on restaurants, travel, or furniture.
Energy is also an input cost for nearly every business, which squeezes margins and capital spending.
Oil shocks have preceded most U.S. recessions since World War II, not because oil causes inflation, but because oil destroys demand.
So a central bank facing an oil spike gets some tightening for free. The 1990 Greenspan episode is the cleanest example: the oil shock itself slowed the economy enough that the Fed’s next move was down, not up, and inflation came back to earth without additional hikes.
That’s the case for patience. If $91 oil persists, it bites growth, and the growth hit eventually pulls inflation down with it. Hiking on top of an oil tax risks doubling the restraint. This was Jean-Claude Trichet’s mistake.
What’s The Likely Path For The Fed?
Next week’s meeting (June 16–17) is Kevin Warsh’s first meeting as FOMC Chair, and he inherits a genuinely split committee.
The April meeting minutes showed an 8–4 vote, the deepest dissent since 1992. Markets have all but settled the near-term question: roughly 98% odds of a hold.
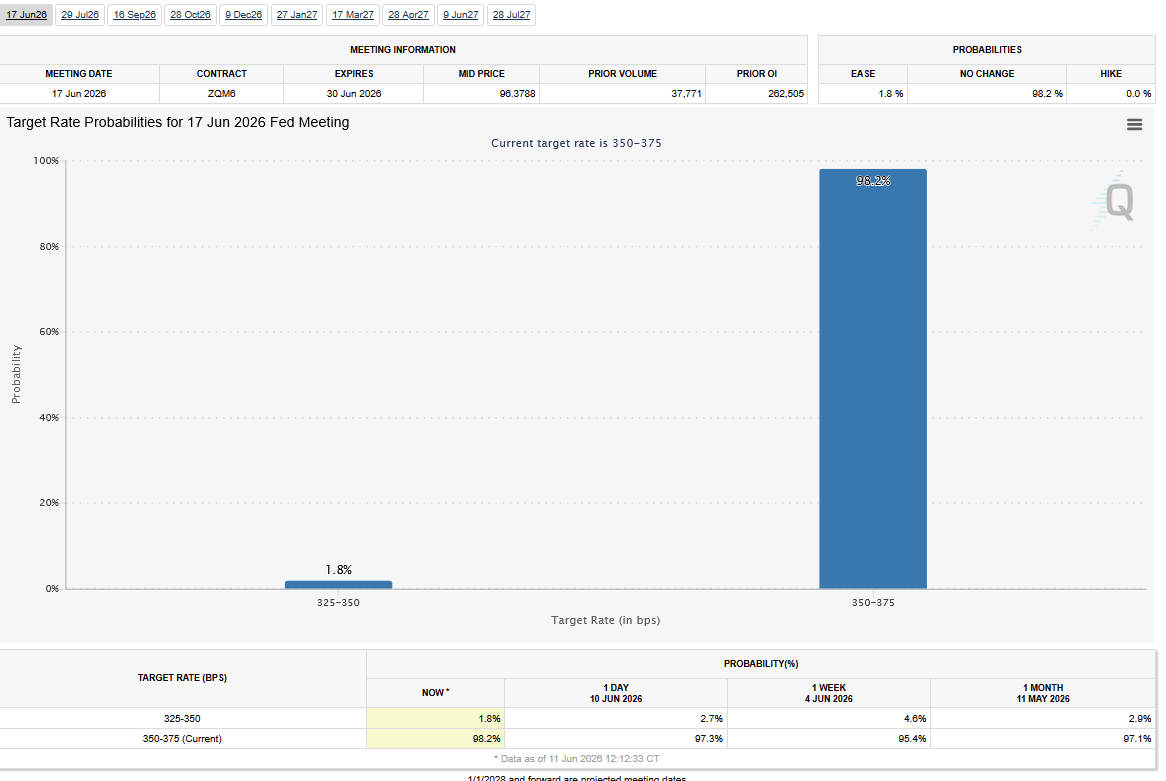
Source: CME Group
My read of the probabilities from here:
Base Case - Hold. Core at 2.9% and decelerating shelter give the Fed room to wait. The Greenspan-Bernanke playbook says look through the spike while watching expectations. Nothing in the core data forces a move in either direction. This is what the market is expecting.
Hike - If Hormuz stays shut and pipeline pressure keeps building, the next move is more likely a hike than a cut. A 12.3% annual rise in raw input costs is tolerable for a quarter. Compounding for a year, it threatens the “narrow inflation” story. The FOMC committee already has four dissenters favoring a rate hike.
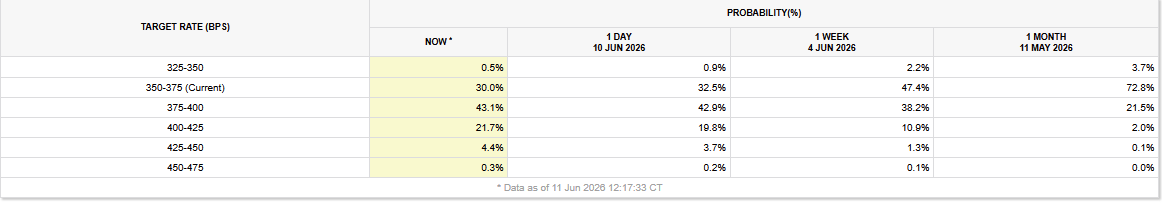
The FedWatch tool, which is based on the futures market, has been forecasting an increasing chance of at least one rate hike by the end of this year:
Cut - Fast cuts only if the labor market cracks. That’s the 1990 template: the oil tax bites, growth rolls over, and the Fed’s problem flips from inflation to recession within a couple of quarters. If payrolls turn negative, the 4.2% headline will be forgotten remarkably fast.
What I’d watch, in order: the PPI pipeline series (does the record repeat?), market-based inflation expectations (still anchored, so far), and weekly jobless claims (the earliest crack in the 1990 scenario).
Skeptic’s Corner
Arguments against everything I just wrote:
“Core is 2.9% only because oil hasn’t hit it yet.” Fair. The Fed’s own research says 0.3–0.4 points of pass-through are coming over two years. If shelter stops decelerating at the same time, core could be back above 3.5% by mid-2027 without any new shock.
“The 1990 analogy assumes the shock is temporary.” Greenspan’s look-through worked partly because the Gulf War resolved in months. A Hormuz closure that persists for a year is a different animal — closer to 1973’s structural supply loss than 1990’s brief scare. The longer it lasts, the weaker the look-through case gets.
“Expectations are anchored until suddenly they aren’t.” The Burns error didn’t look like an error in real time. He had respectable arguments. So does today’s consensus for holding. The uncomfortable truth is that anchored expectations are only observable in hindsight.
“A record PPI print is a record for a reason.” I’m treating the stage 1 intermediate demand number as a warning light. A skeptic would call it the headline. If businesses pass those costs through rather than eating them, the narrow-inflation thesis dies quickly.
All fair. My counter is simply that the core data, as of today, hasn’t validated any of them — and policy should respond to evidence, not anticipation of evidence.
For now, the market has made its bet: hold next week, and hope the oil tax does the heavy lifting.
The four central bank episodes you map are the right framework for reading this week's data. What consistent allocators have learned from those cycles is that the timing error, not the direction error, is what causes the most damage. Volcker was right but early enough to be brutal. Trichet was wrong about both direction and timing simultaneously. The 1990 Greenspan episode worked because the look-through was short enough that expectations never had time to drift.
The PPI Stage 1 intermediate demand print is the number that makes the 1990 analogy most fragile. A 3.2% monthly jump in raw input costs at the start of the supply chain is not a consumer inflation story yet — but it is a two-quarter warning. Half of tactical allocators are underweight government bonds precisely because the pipeline data keeps refreshing the inflation argument before the consumer data has time to cool. The narrow inflation story is currently intact. The question is the shelf life.
The ECB and the Fed just picked opposite sides of the 2008 argument. History already graded that exam once.