

Issue No. 11 · Tuesday · August 4, 2026
What’s Inside:
At a Glance - A “weight of the evidence” look at the current market environment, as well as my Regime map.
The Call - A deeper dive into what I am seeing
Under the Hood - Current market internals, sector breadth, and intermarket analysis.
Sector Watch - Which sectors pass/fail the screening process.
Current Screen - Which stocks pass the screening process.
What I Am Watching - Stocks I am watching that are approaching a passing grade in the screening process. Plus, what changed from last week.
(Current ARTAIS clients, please reach out to me for a free paid subscription)
At a Glance
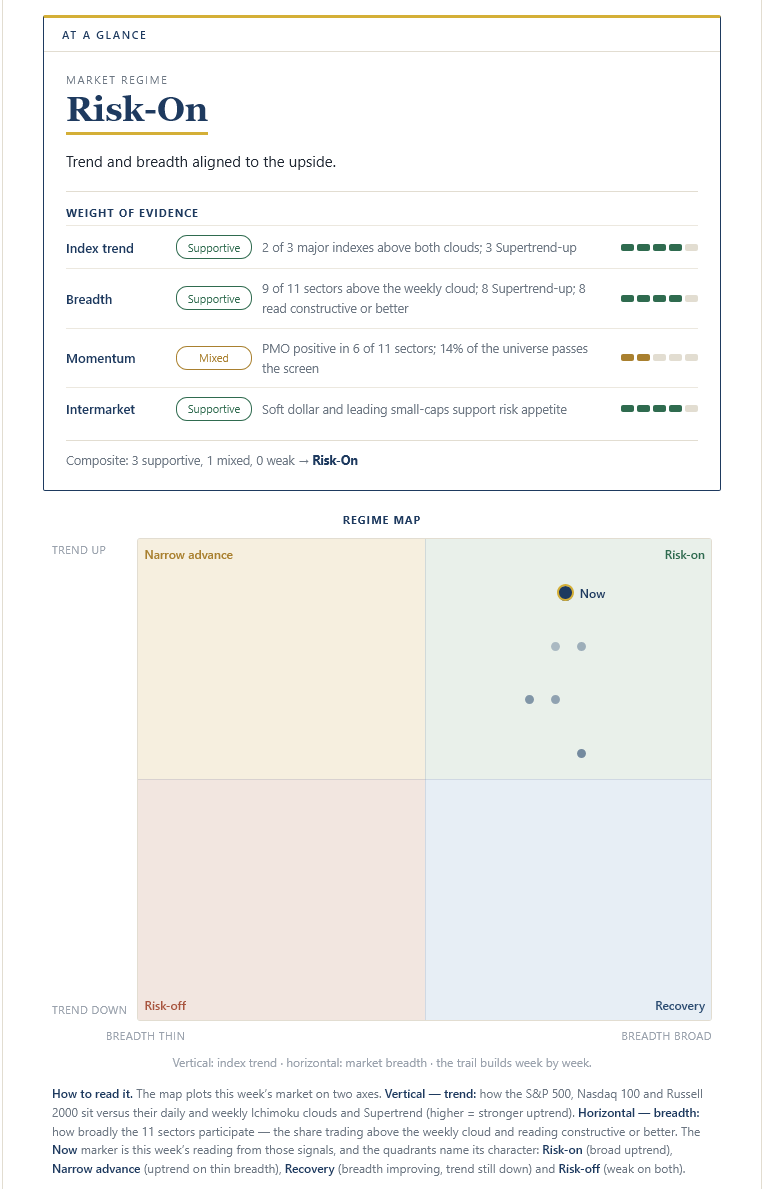
Market regime: Risk On
The Call
In last week’s report, I discussed the improving momentum in the Tech sector and how it was on the verge of turning positive.
This week, the momentum in the Tech sector has turned positive.
(Current ARTAIS clients, please reach out to me for a free paid subscription)
Below is a Relative Rotation Graph (RRG) of the 11 sectors that make up the S&P 500 Index.
Currently, the rotation is showing improving momentum in tech stocks and is indicating we are entering back into a “risk on” rotation for US equities.
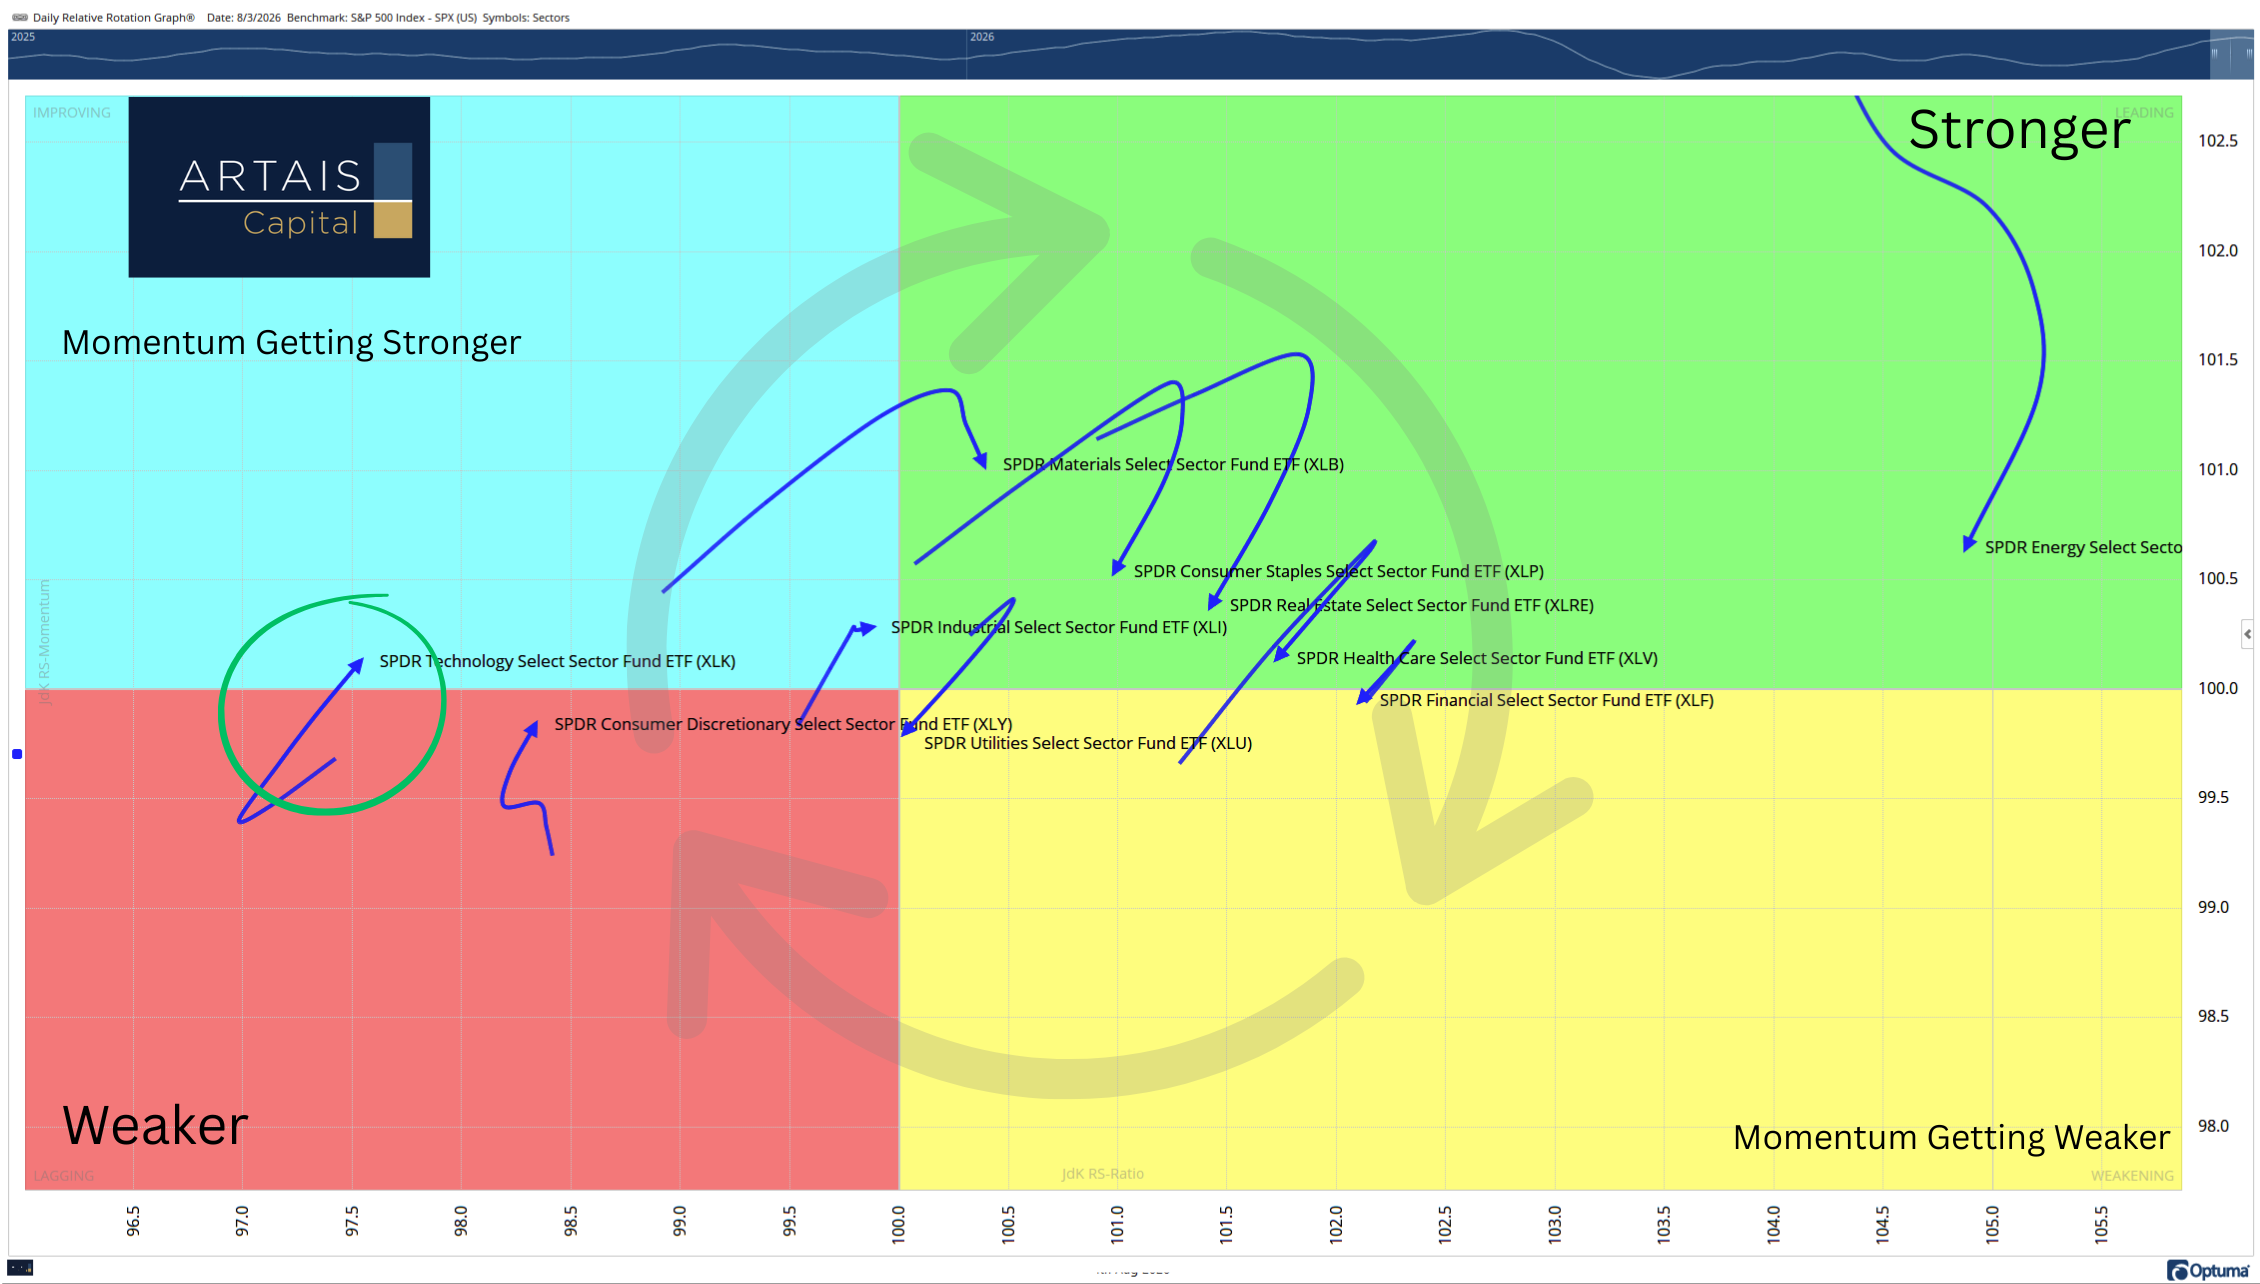
RRGs typically rotate in a clockwise direction. This allows us to see the rotation from “risk on” to “risk off” and back, in real time.
While I don’t have a magic crystal ball that tells me how long these conditions will last, I find it useful to look at the rotation of not just the sectors themselves, but the rotation of high vs low beta, value vs growth, and how overbought and oversold the areas of the market that investors typically label “offense vs defensive”.
To start, let’s take a look at the relationship between these “risk on” and “risk off” categories.
The below Relative Rotation Graph shows the rotation between high-beta vs low-volatility, growth vs value, and consumer discretionary vs consumer staples.
Why consumer discretionary vs consumer staples? Investors look at consumer’s behaviors and how their purchases affect earnings growth.
When a person feels good about the economy and their future job outlook, they tend to spend more on big-ticket items. Perhaps they upgrade their phone or buy a larger TV before football season starts.
When a person is worried about the economy, they tend to avoid these purchases. However, they still buy everyday necessities (staples), like groceries, toilet paper, and (hopefully) deodorant.
As a result, when markets are in a downtrend, many flock towards consumer staples, since the earning of these companies tend to be more stable during times of economic instability.
I’ve circled the “risk-on” asset classes in green and “risk-off” in red to highlight the improving momentum that favors the “risk-on” theme: