
Signal & Noise: Weekly Signal Report, July 28 2026
A weekly review of market regime, leadership, and which names are passing our screening process.

Issue No. 10 · Tuesday · July 28, 2026
What’s Inside:
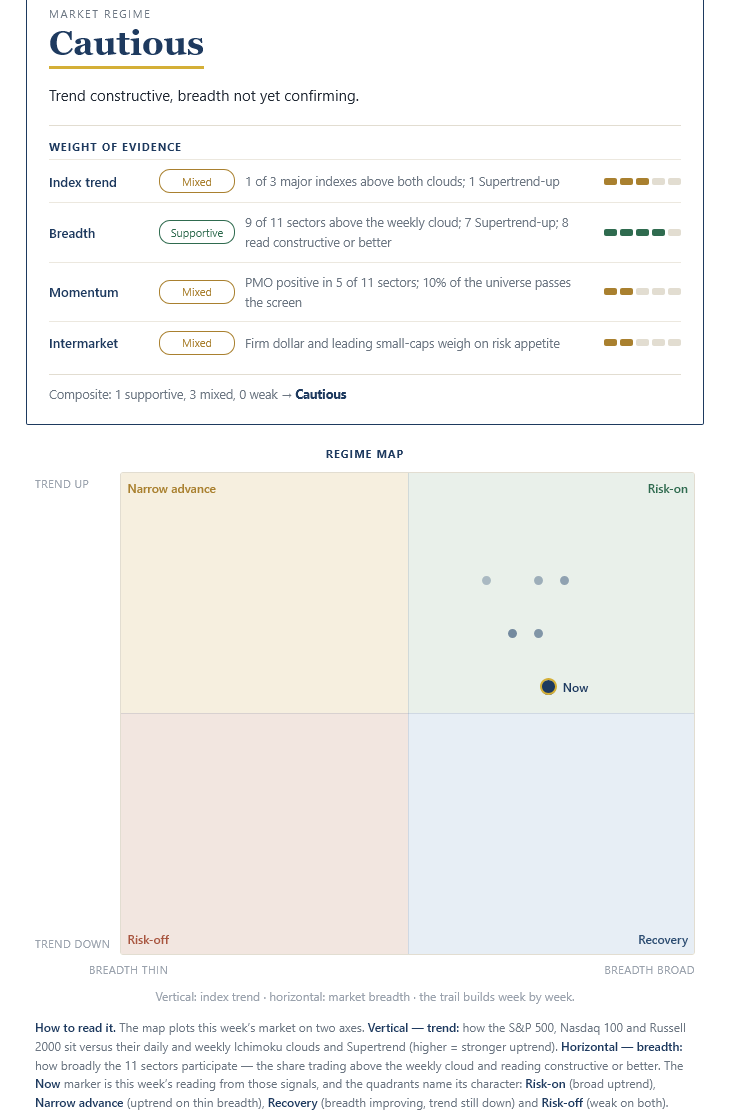
At a Glance - A “weight of the evidence” look at the current market environment, as well as my Regime map.
The Call - A deeper dive into what I am seeing
Under the Hood - Current market internals, sector breadth, and intermarket analysis.
Sector Watch - Which sectors pass/fail the screening process.
Current Screen - Which stocks pass the screening process.
What I Am Watching - Stocks I am watching that are approaching a passing grade in the screening process. Plus, what changed from last week.
At a Glance
Market regime: Cautious
The Call
For the past few weeks, I have been talking about the opportunity in Tech and the Semiconductor space.
However, the rotation from value back to growth has been slow, in part due to another wave of “disagreement” over opening the Strait of Hormuz, and waiting to hear what the Fed and its new Chair, Kevin Warsh, will say about inflation and interest rates.
(Current ARTAIS clients, please reach out to me for a free paid subscription)
If we take a look at the Relative Rotation Graph (RRG) of the sectors within the S&P 500 (I’ve added SOXX and SMH to help track semiconductor stocks), the momentum of the Tech sector is on the verge of switching over to positive.
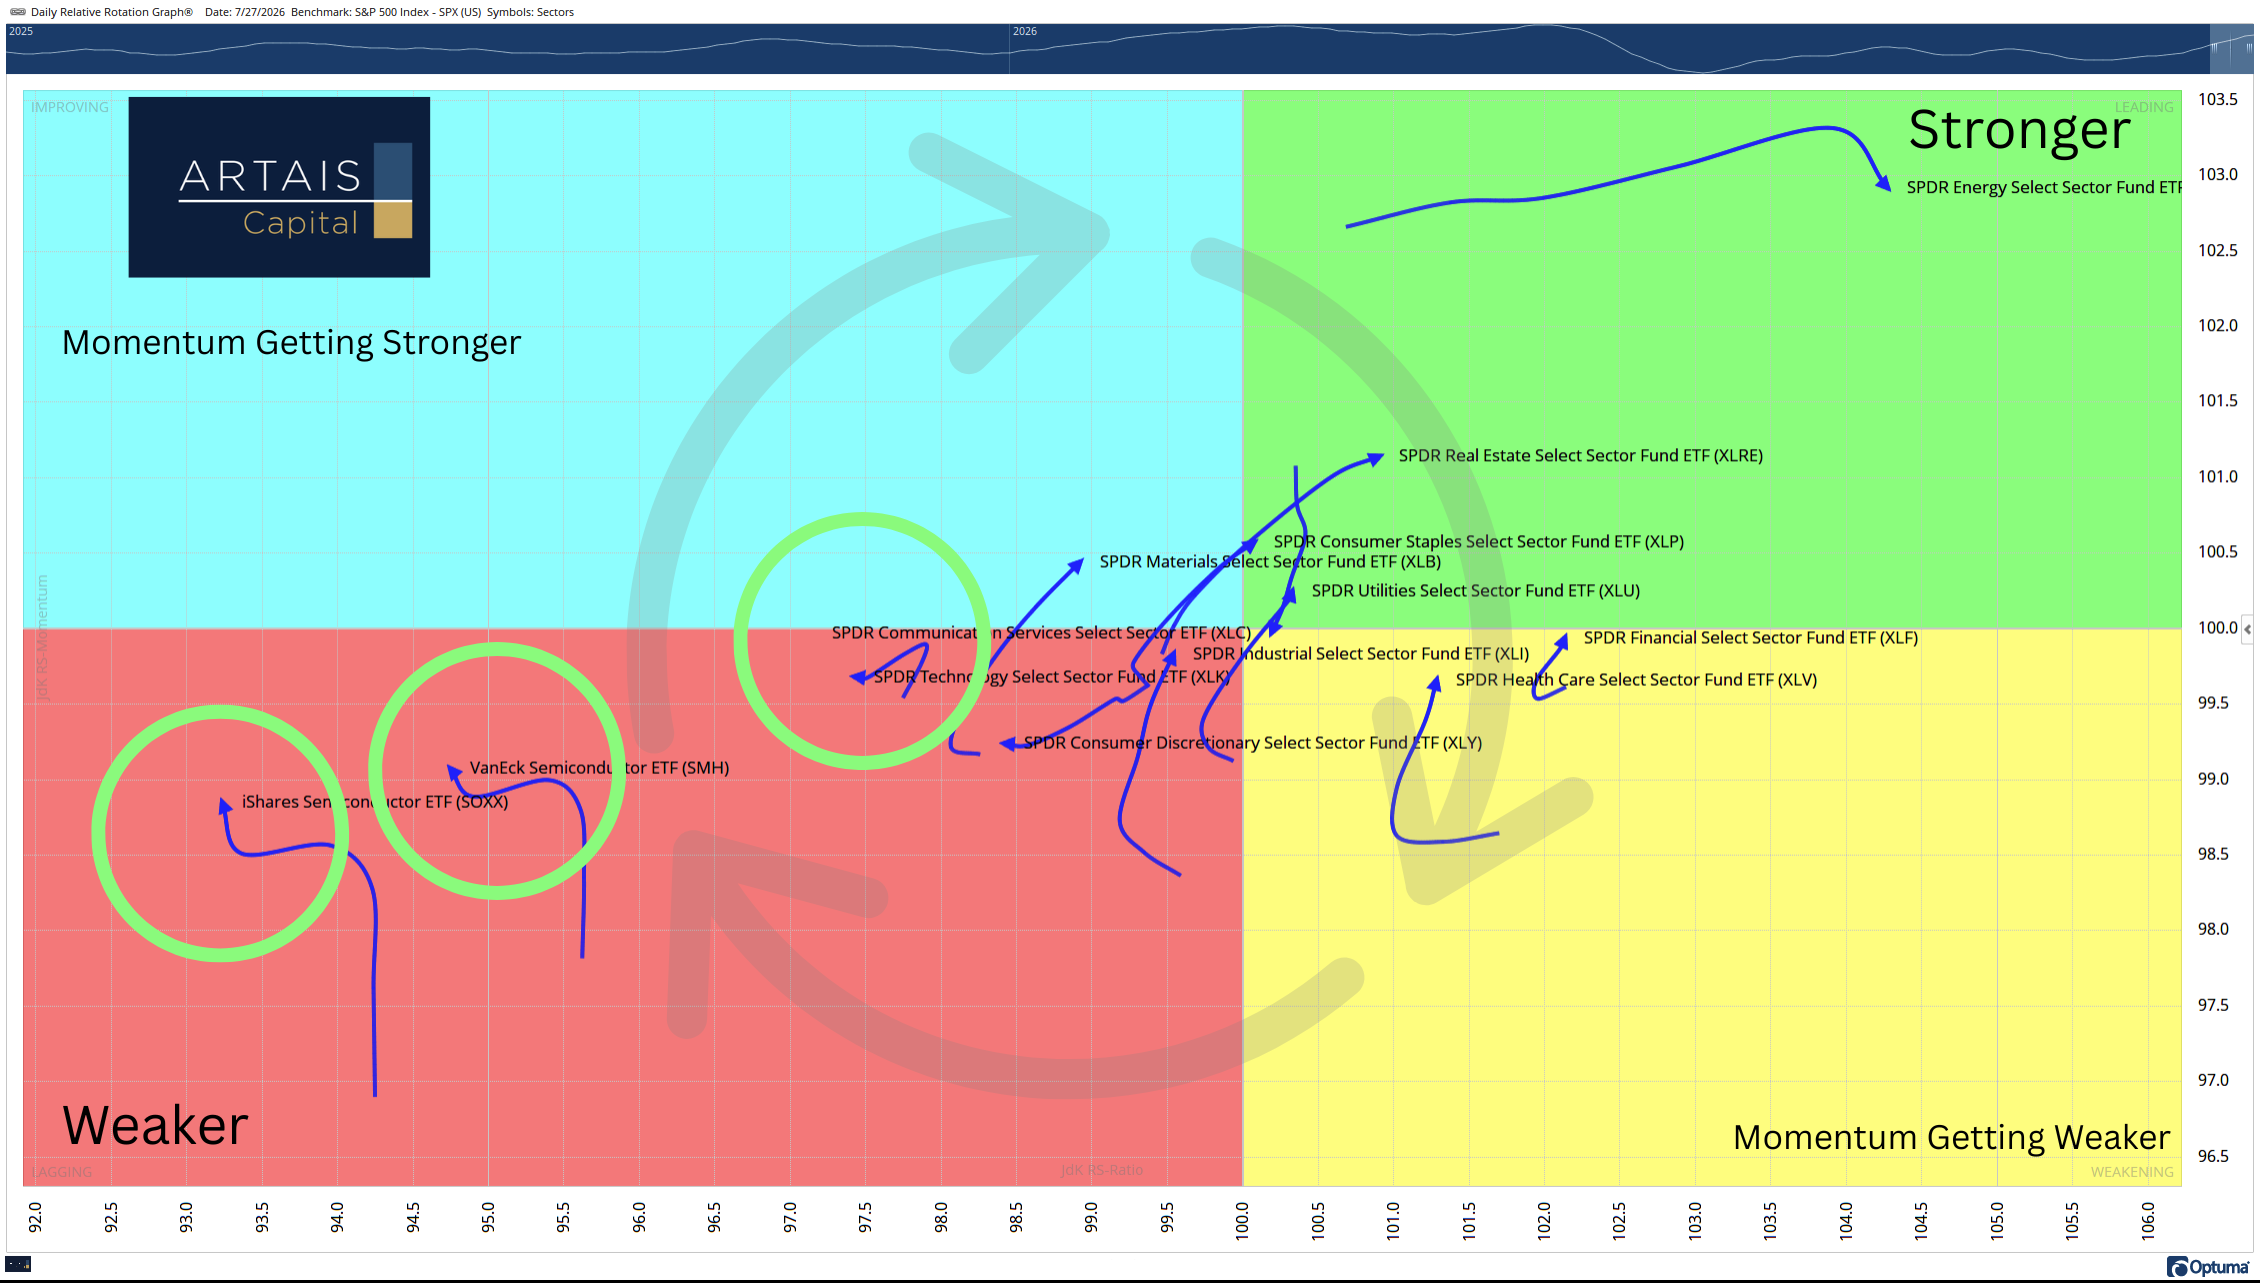
But investors are still hesitant. Similar to a person who is standing on the very edge of a diving board, hesitant to jump into the pool.
While we wait, there are already signs that some of the market is positioning itself for this (potential) next leg up.
Below is a Point and Figure (PnF) chart of the Bullish % Index of the Tech sector:
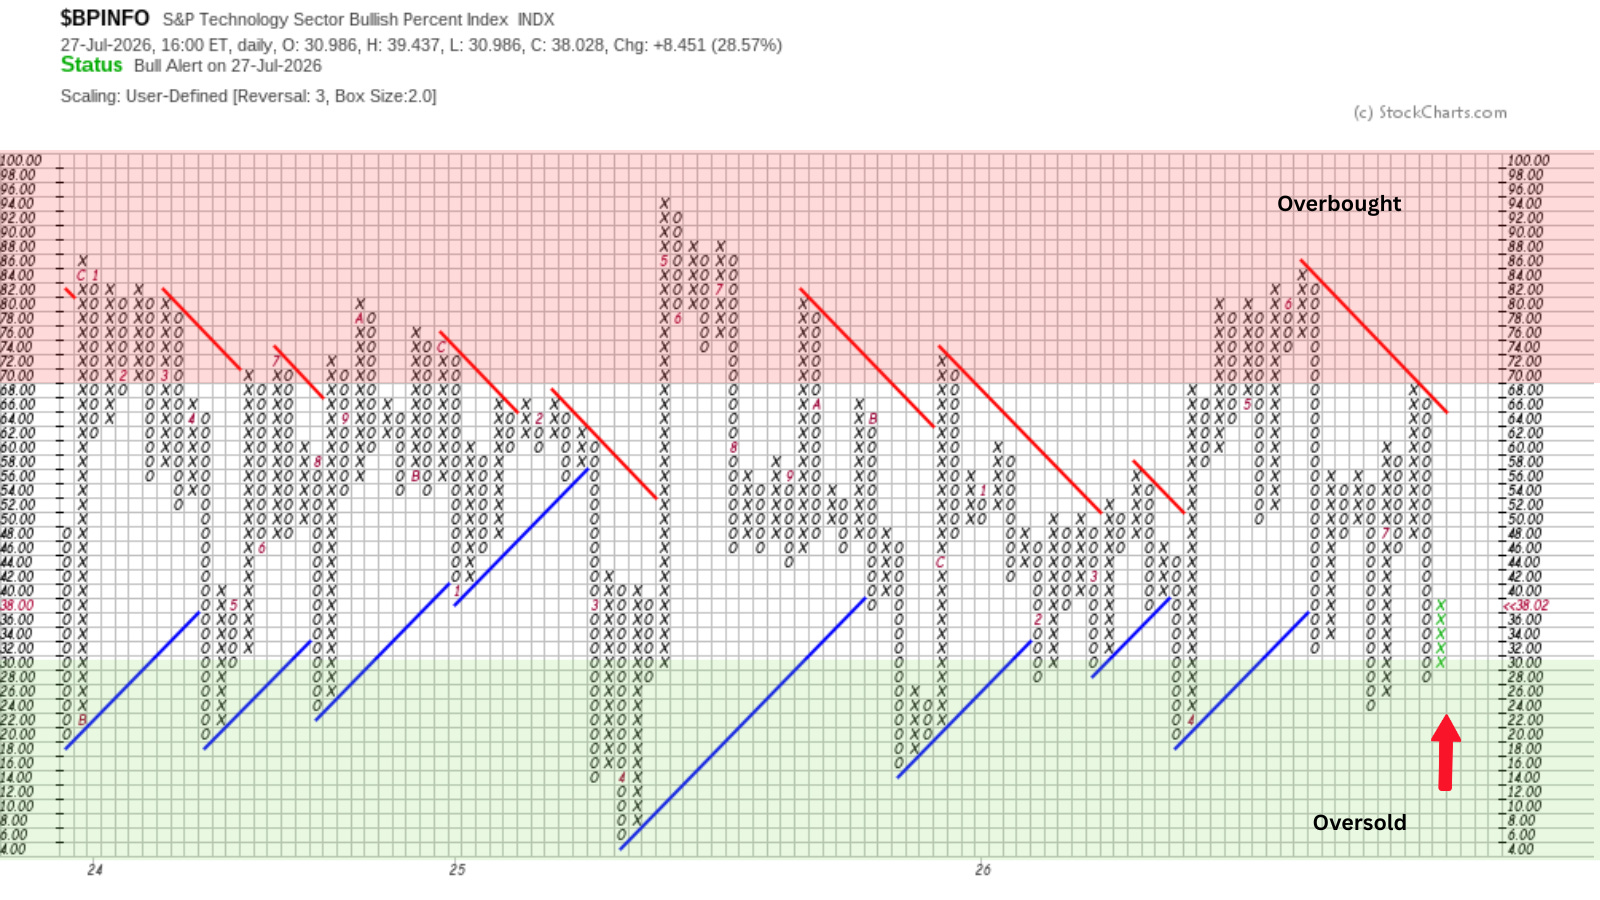
For those not familiar with PnF charts, they simply show price movement with time removed. Tom Dorsey, who built a research firm around Point and Figure, refers to the Xs and Os on the chart as offense and defense.
In other words, when the chart shows a column of Xs, the offense is on the field.
Bullish % Index charts show the percentage of stocks on a Point and Figure buy signal. These charts range from 0% to 100%. Anything below 30% is considered oversold, and anything above 70% is considered overbought.
So, in regard to the Tech sector, the offense just got back onto the field while the sector was in oversold territory.
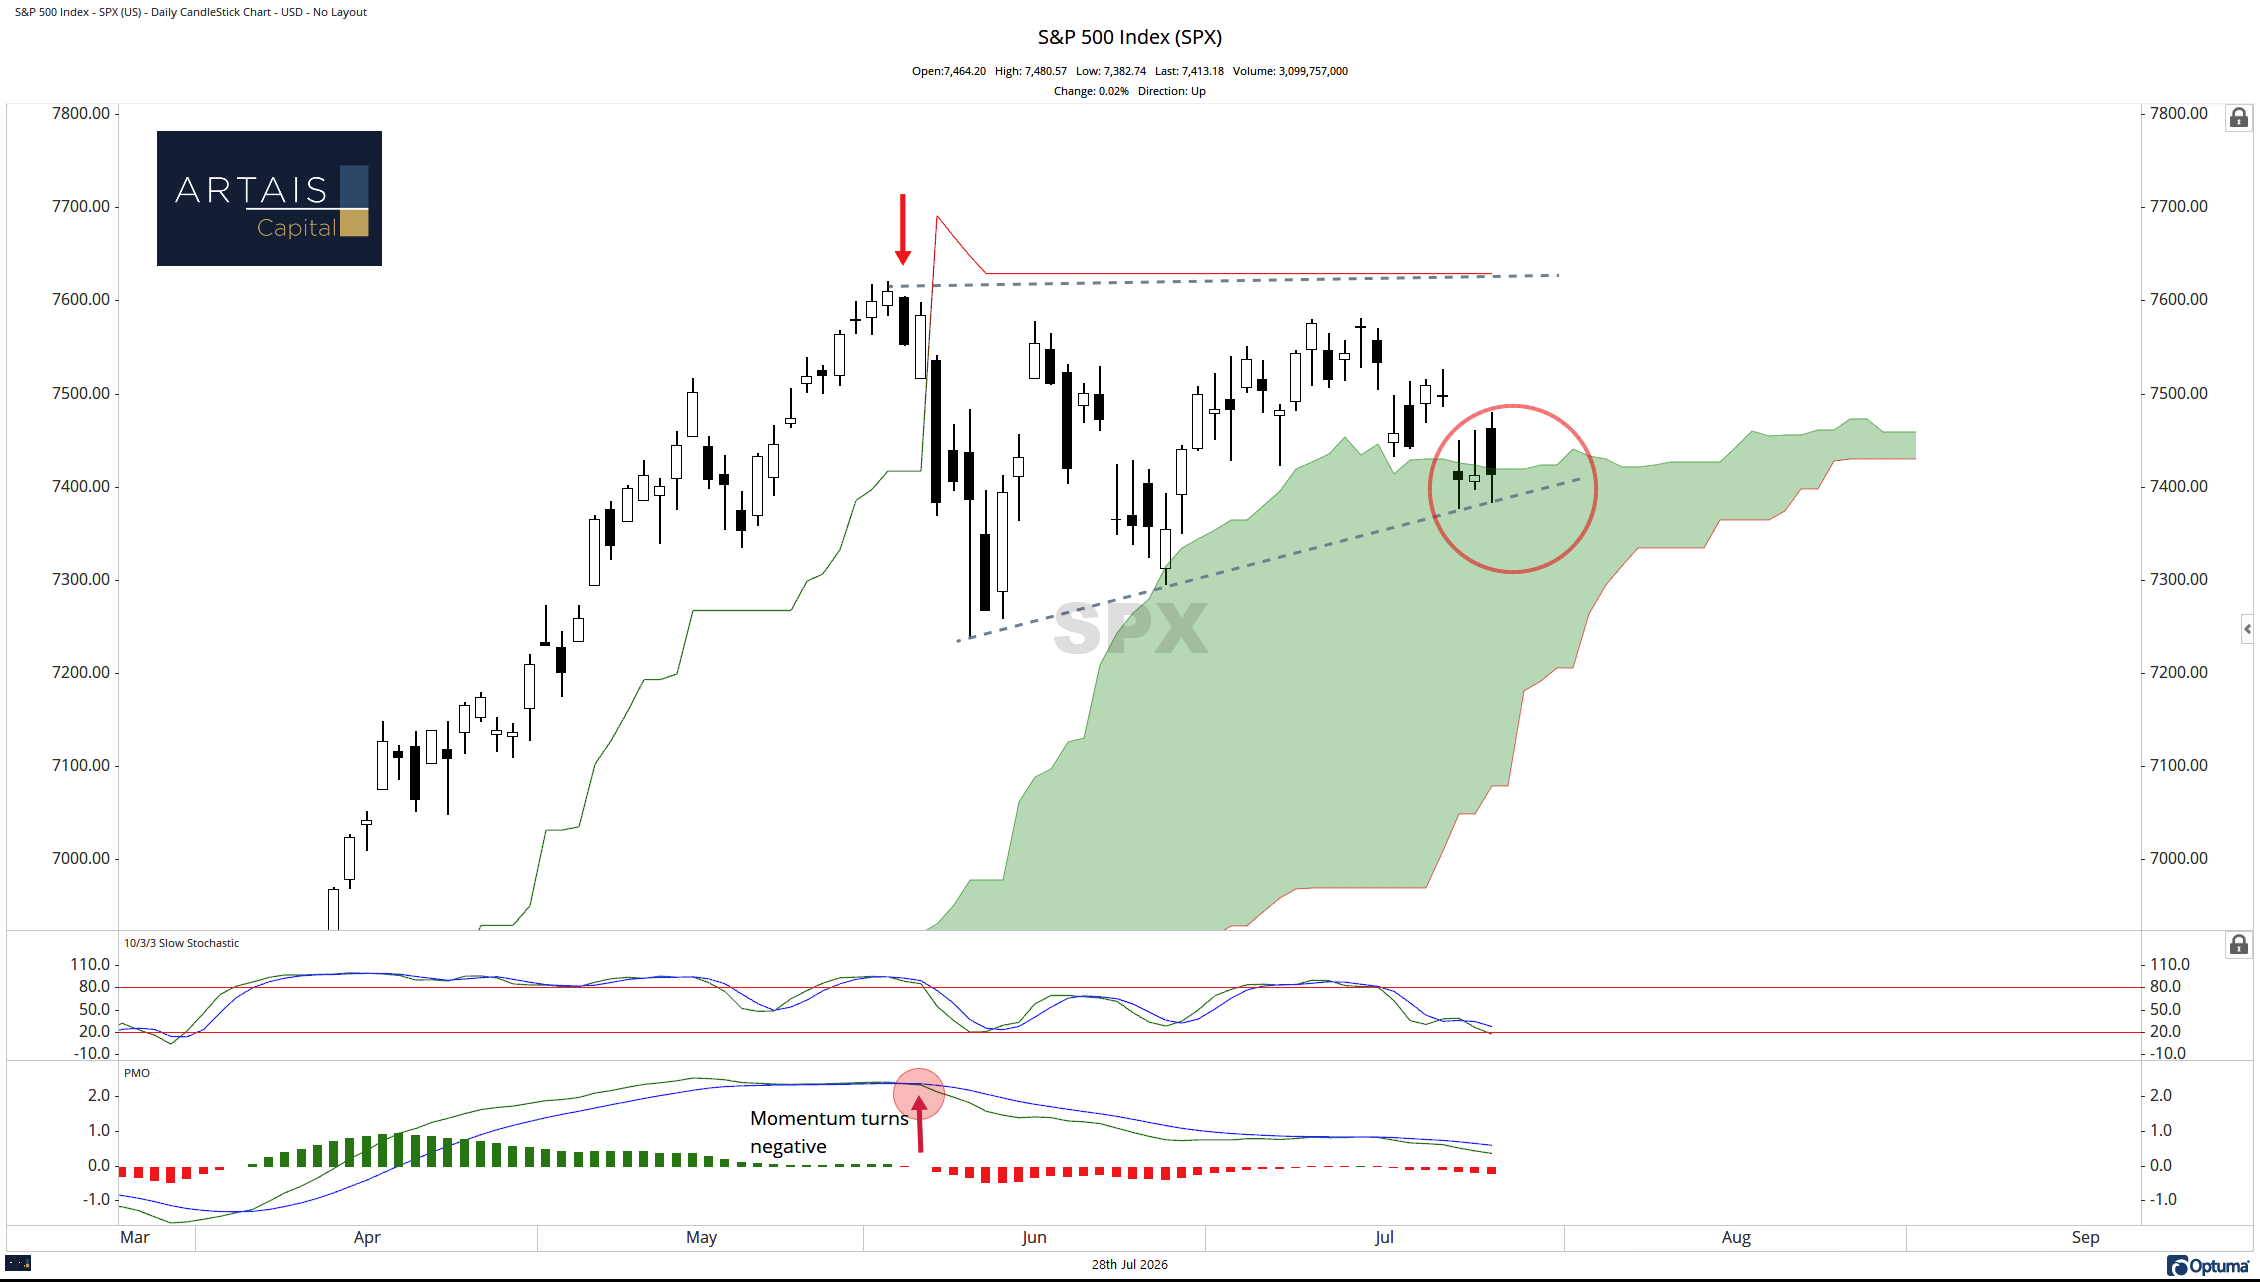
As the Tech sector is the largest component of the S&P 500 index, a rise in the sector may help push the S&P 500 index to higher levels:
(Current ARTAIS clients, please reach out to me for a free paid subscription)
Under The Hood
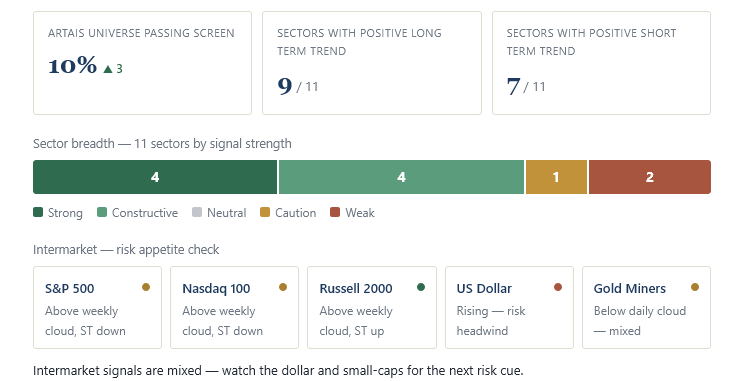
Sector Watch
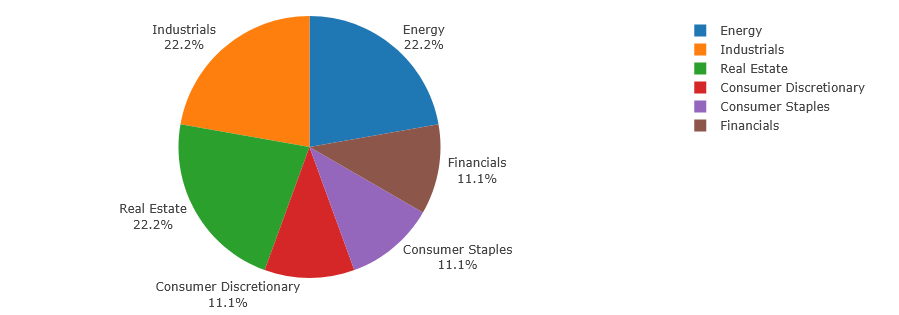
Current Sector weighting of ARTAIS names passing the screen
Keep reading with a 7-day free trial
Subscribe to Musings of a Money Manager to keep reading this post and get 7 days of free access to the full post archives.