Issue No. 8 · Tuesday · July 14, 2026
What’s Inside:
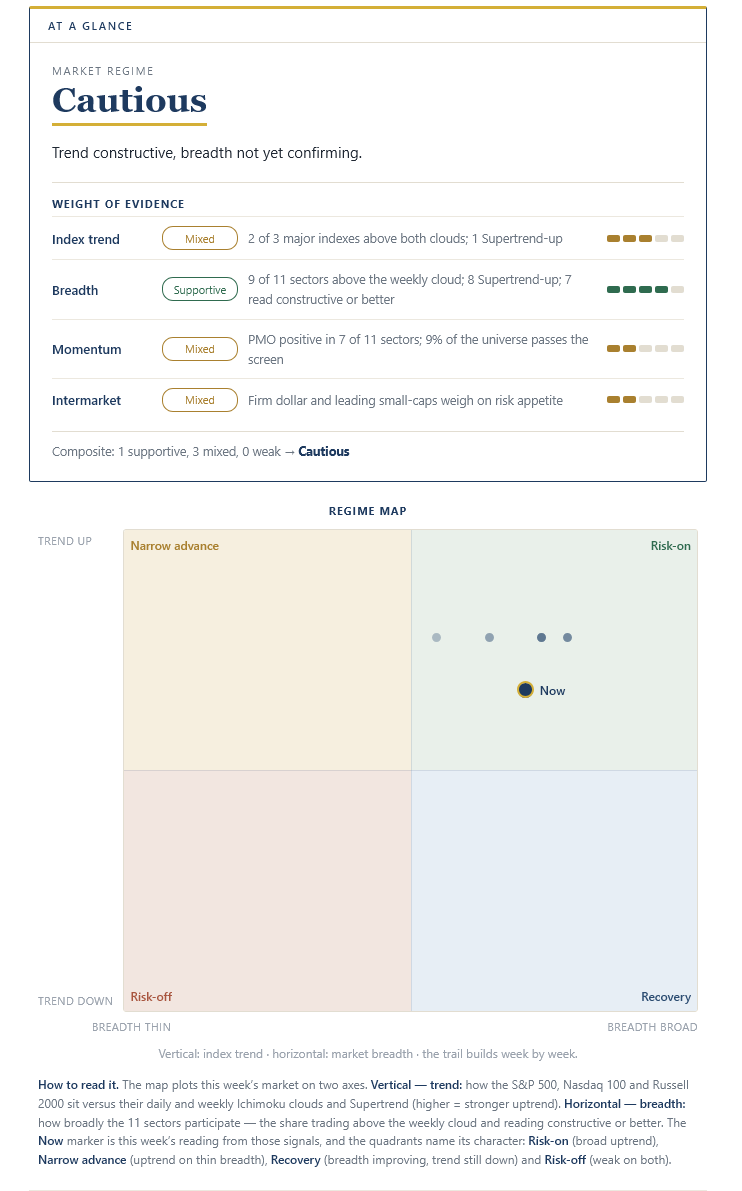
At a Glance - A “weight of the evidence” look at the current market environment, as well as my Regime map.
The Call - A deeper dive into what I am seeing
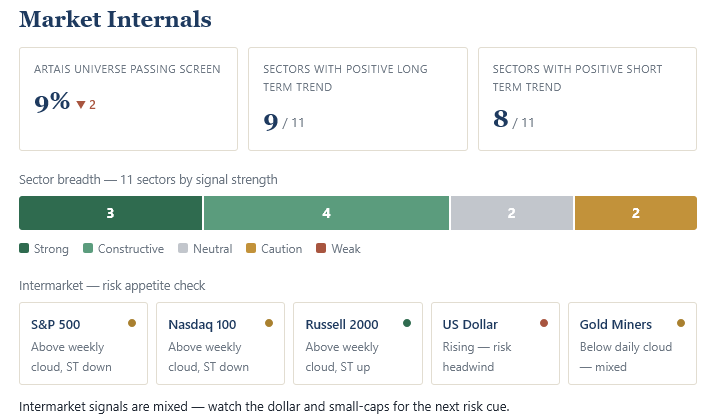
Under the Hood - Current market internals, sector breadth, and intermarket analysis.
Sector Watch - Which sectors pass/fail the screening process.
Current Screen - Which stocks pass the screening process.
What I Am Watching - Stocks I am watching that are approaching a passing grade in the screening process. Plus, what changed from last week.
At a Glance
Market regime: Cautious
The Call
The US market is still “risk-on”, but rotating based on geopolitical events and inflation data.
To start, intermediate and long-term trends are still positive:
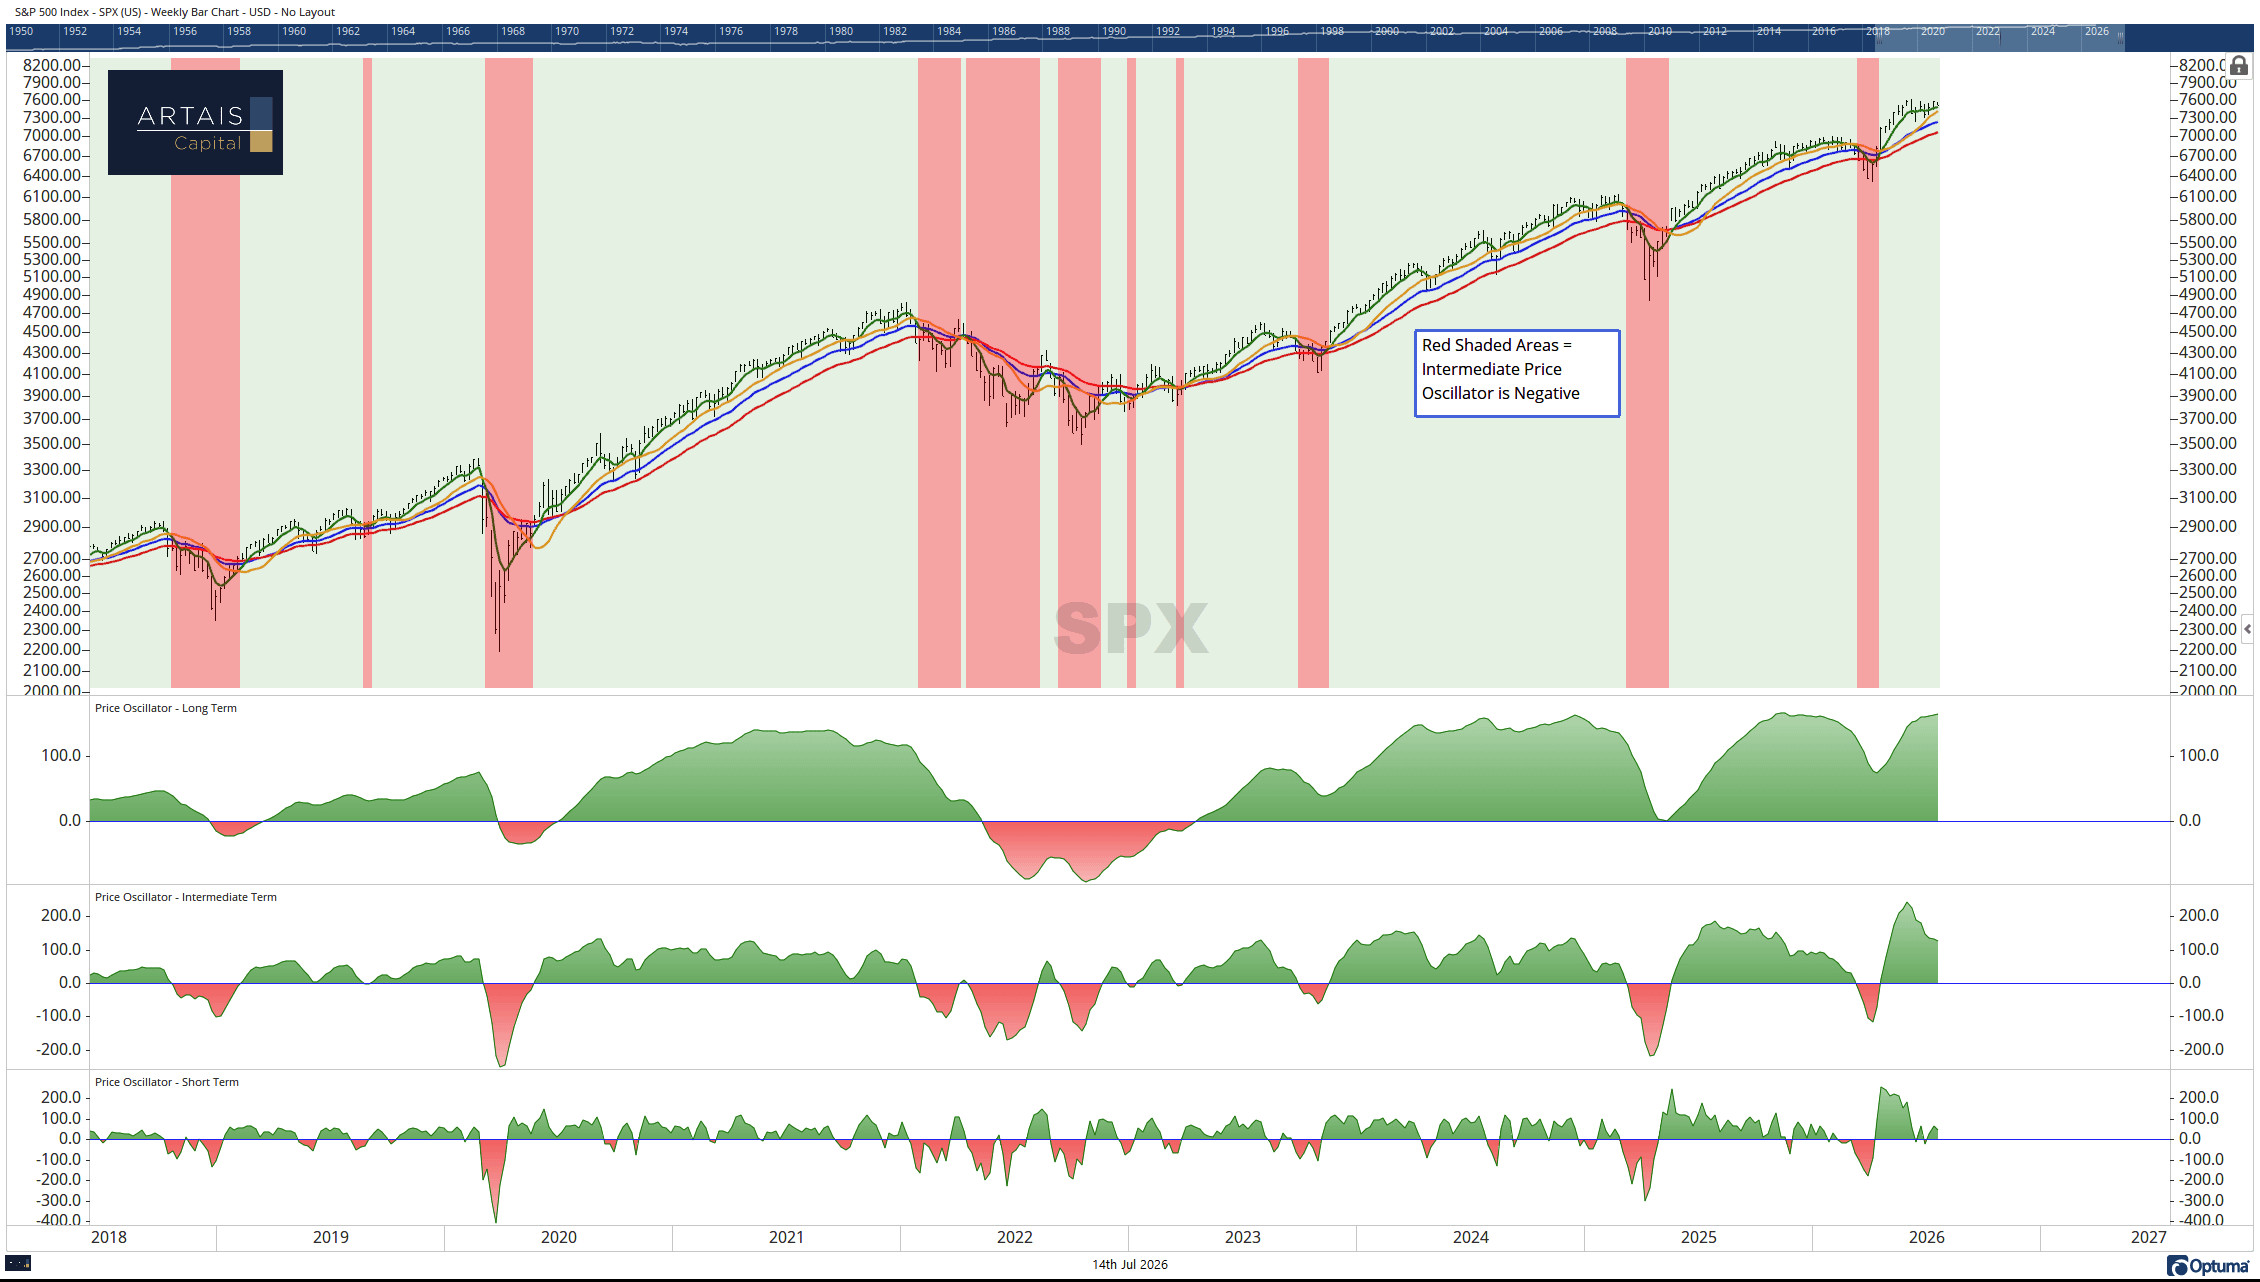
In the chart above, I have highlighted the S&P 500 in red and green. The red-shaded area is where the intermediate trend turns negative/bearish.
The strategy I manage at ARTAIS Capital is based on intermediate trends, so this is the time frame I tend to focus on most. (Think weeks to months instead of hours to days.)
(Current ARTAIS clients, please reach out to me for a free paid subscription)
While the trends are positive, the market is still rotating and has begun to favor large-caps over small-caps:
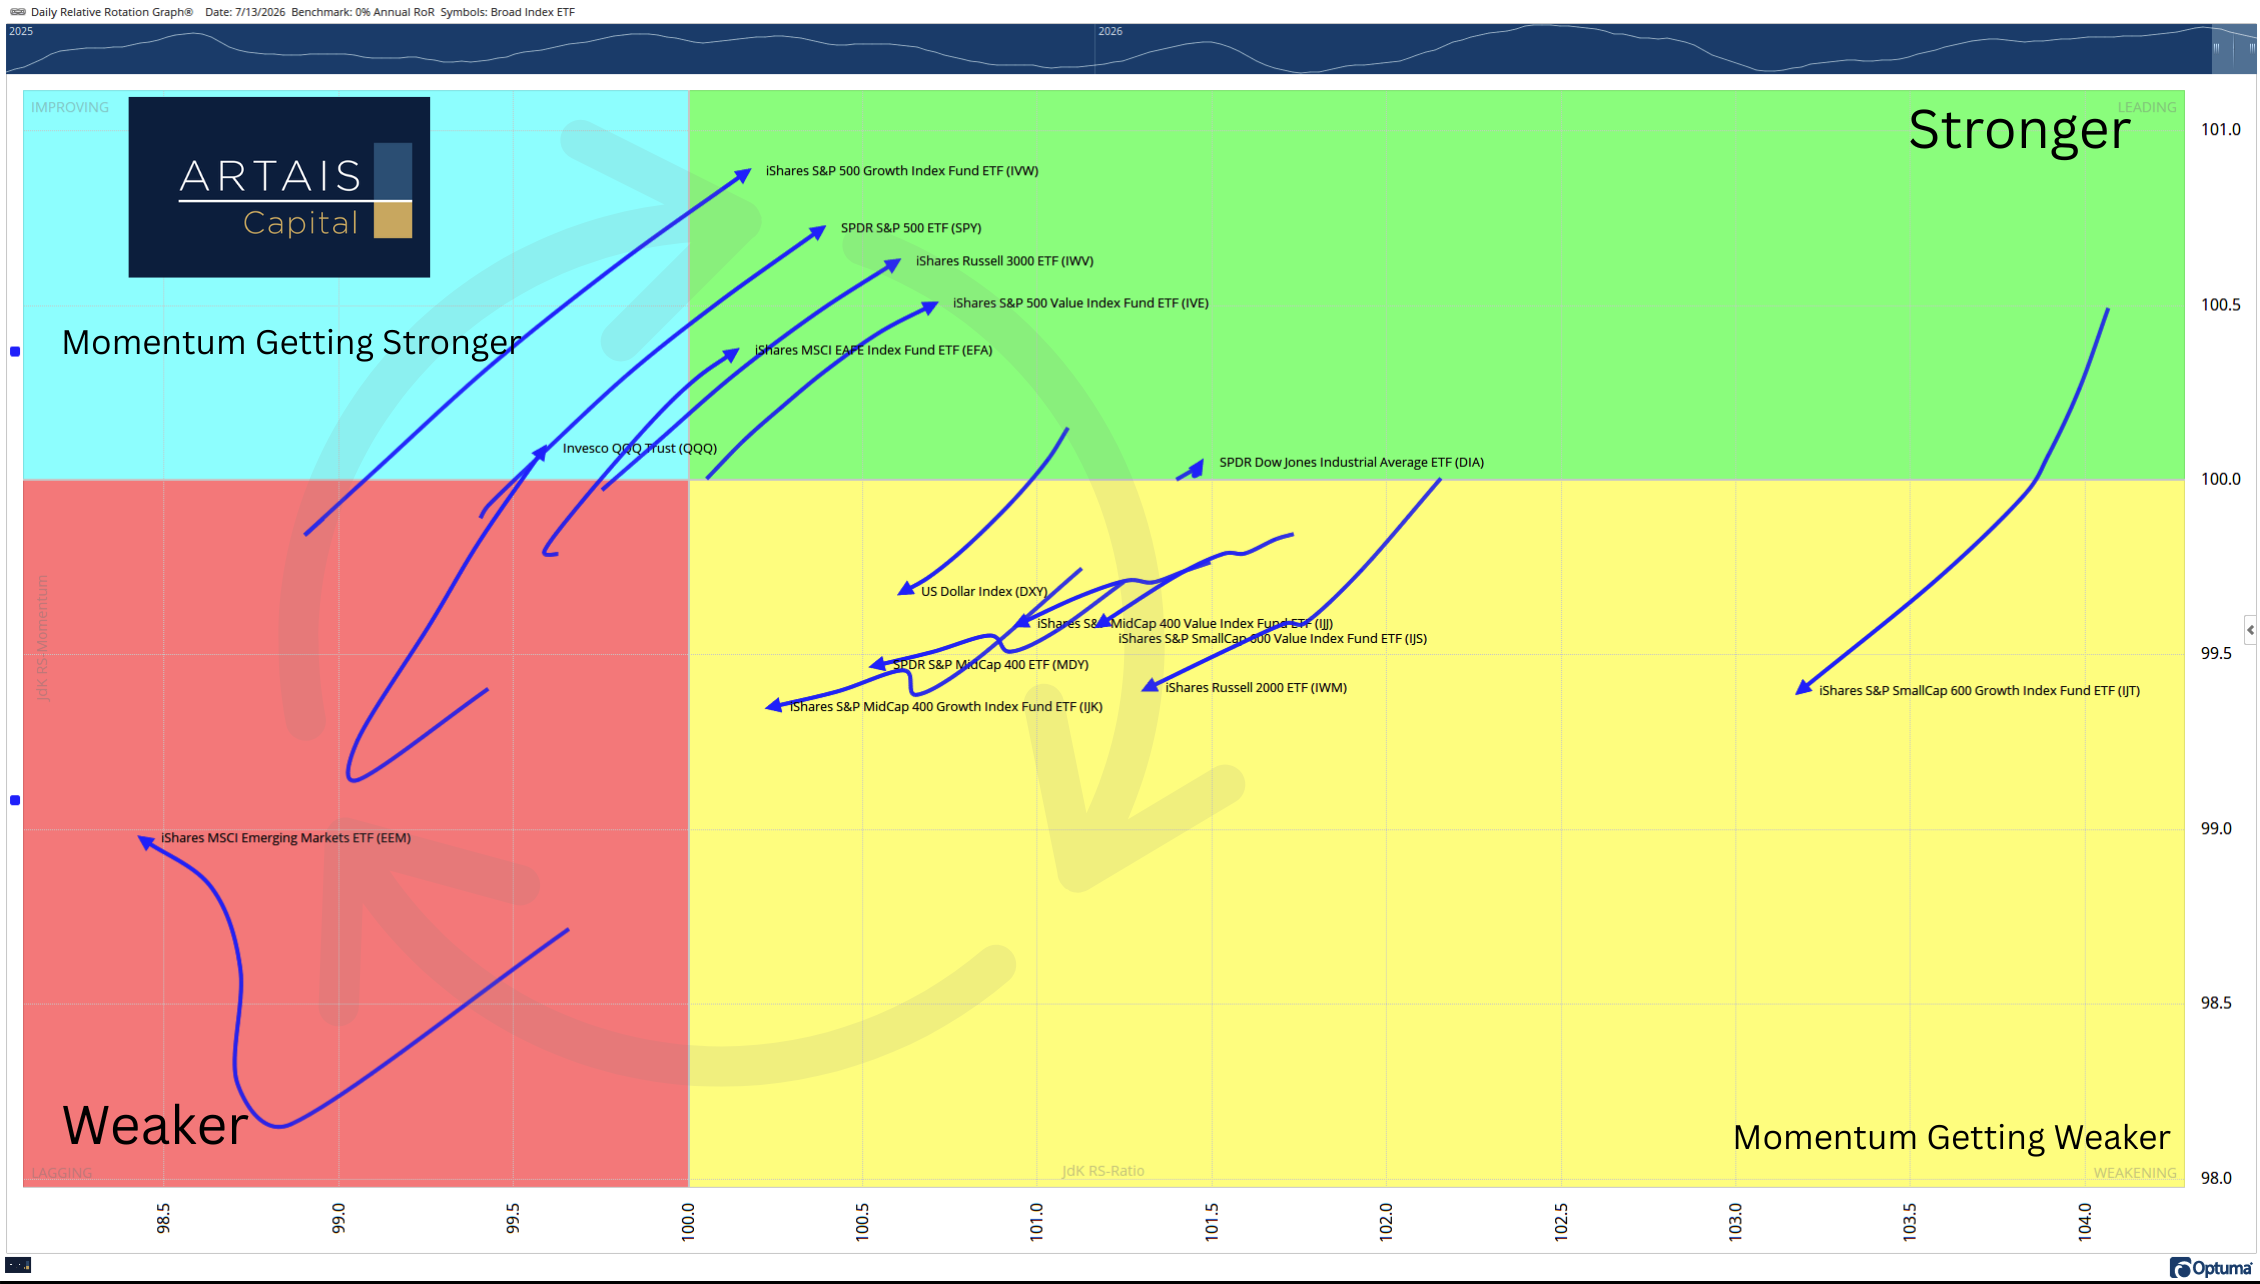
The above chart is called a Relative Rotation Graph (RRG). It measures both momentum and relative strength. RRGs typically rotate in a clockwise fashion and allow us to visualize market rotation in real time.
Currently, the RRG is showing improved strength in large-cap areas of the market relative to small and mid-cap areas.
This is in part due to the rotation of the large-cap-heavy tech sector:
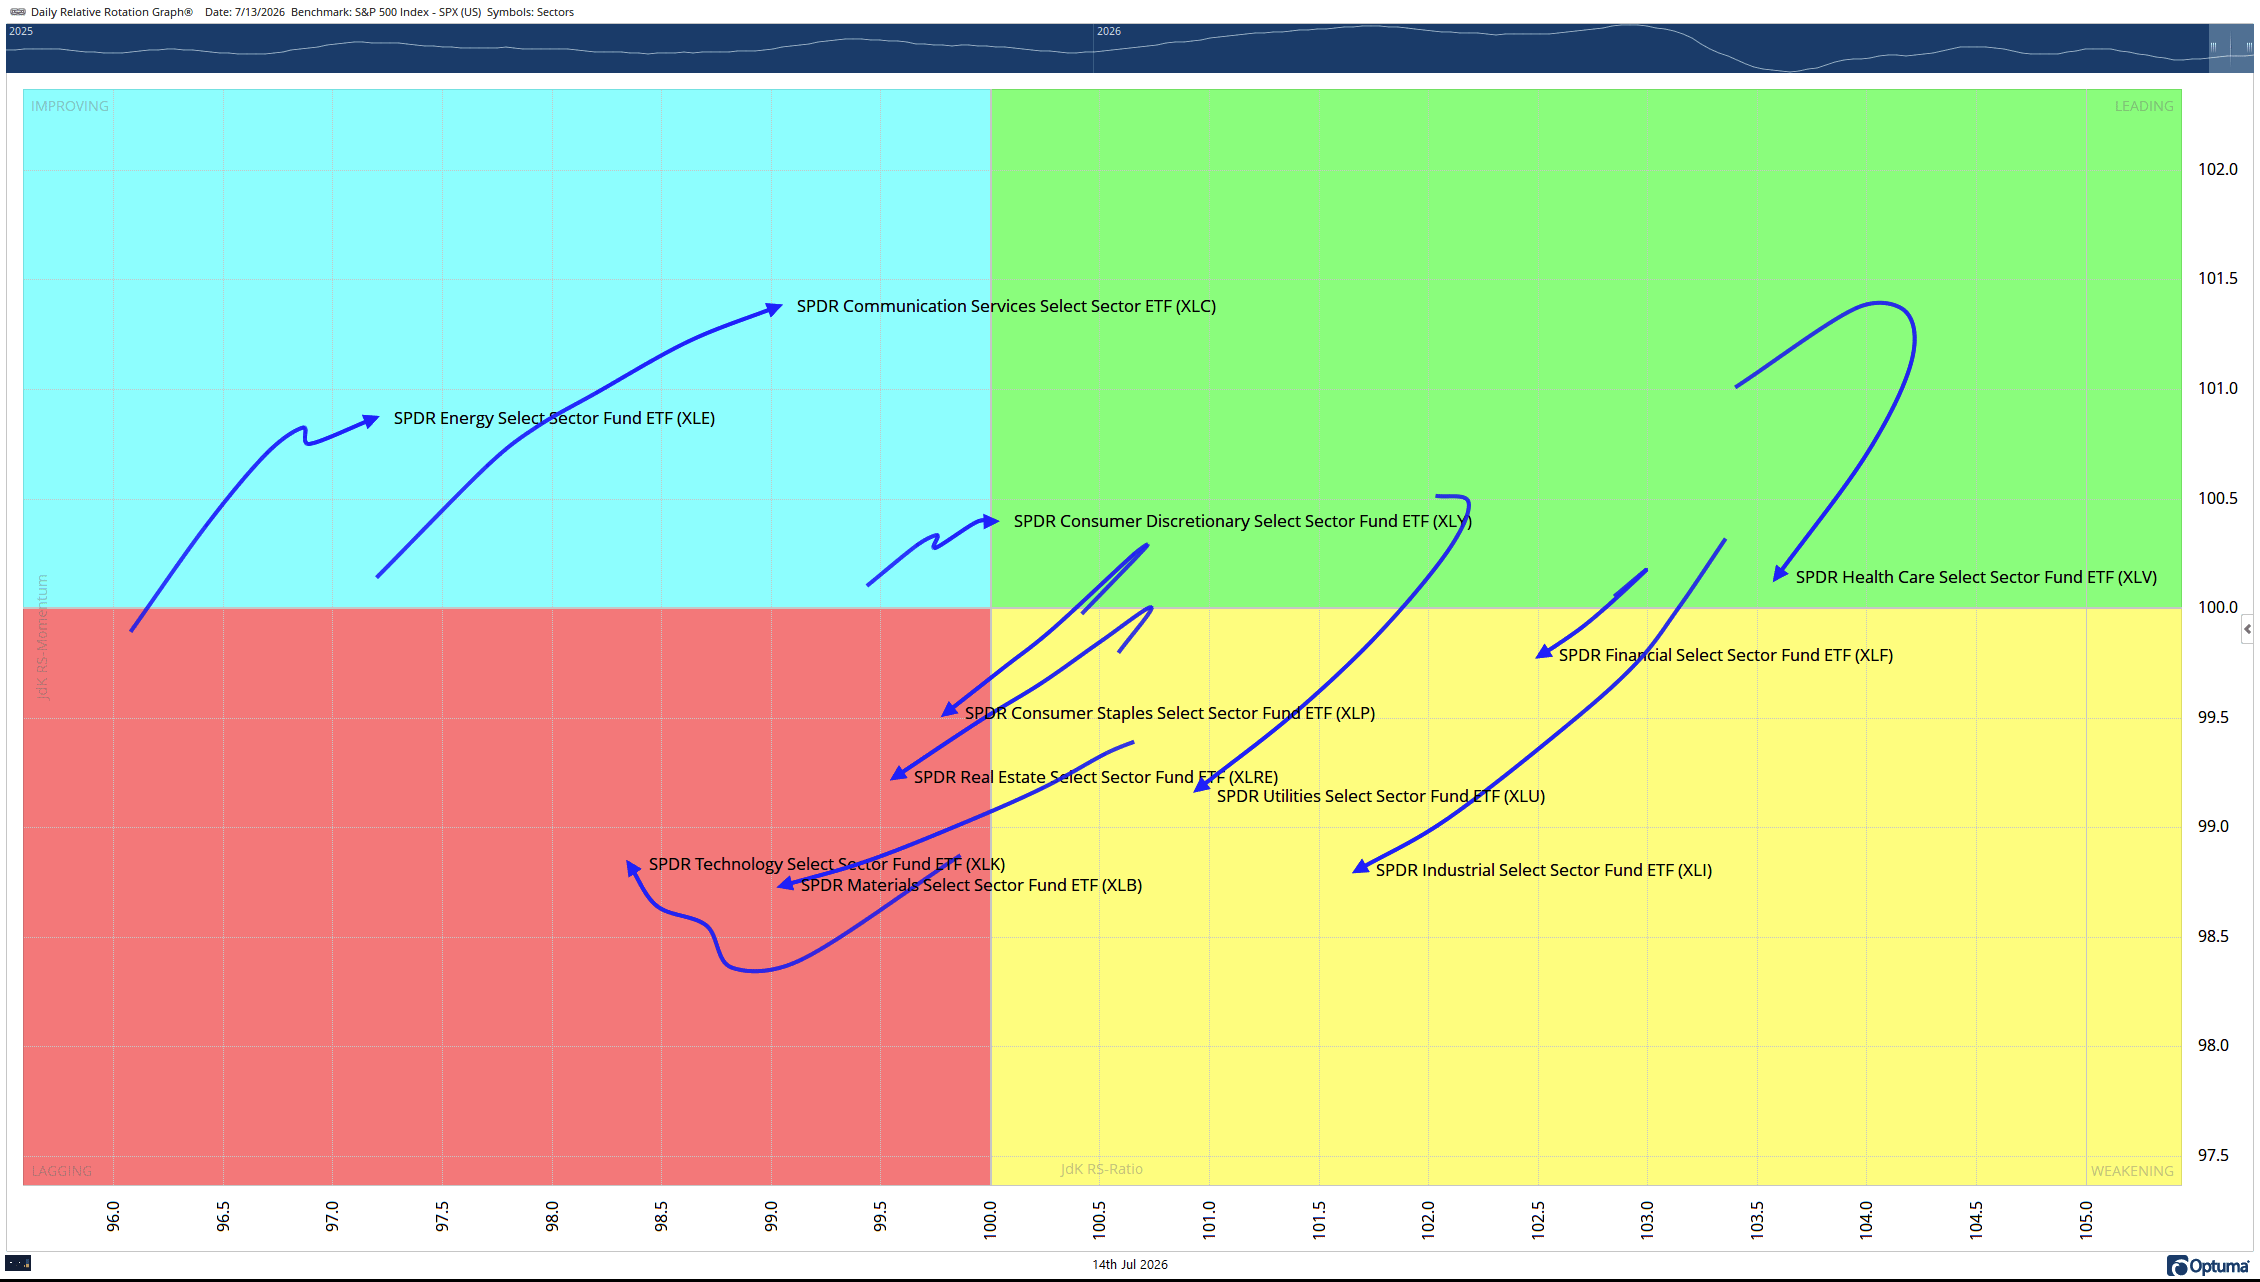
The tech sector is currently in the weakest quadrant as shown in the above Relative Rotation Graph; however, this is where many traders start to look for opportunities to enter names that have strong long-term growth, but at a cheaper price.
In his paper, “Buying Out Performers is Too Late,” Mathew Verdouw, CMT, CFTe, highlights that when stocks are in the Lagging Quadrant (the red, bottom-left quadrant), 90% of the time they continue to rotate to the Improving Quadrant:
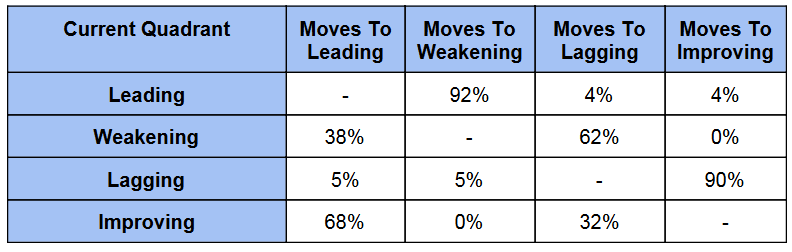
This means 90% of the time these stocks see a rise in positive momentum and relative strength.
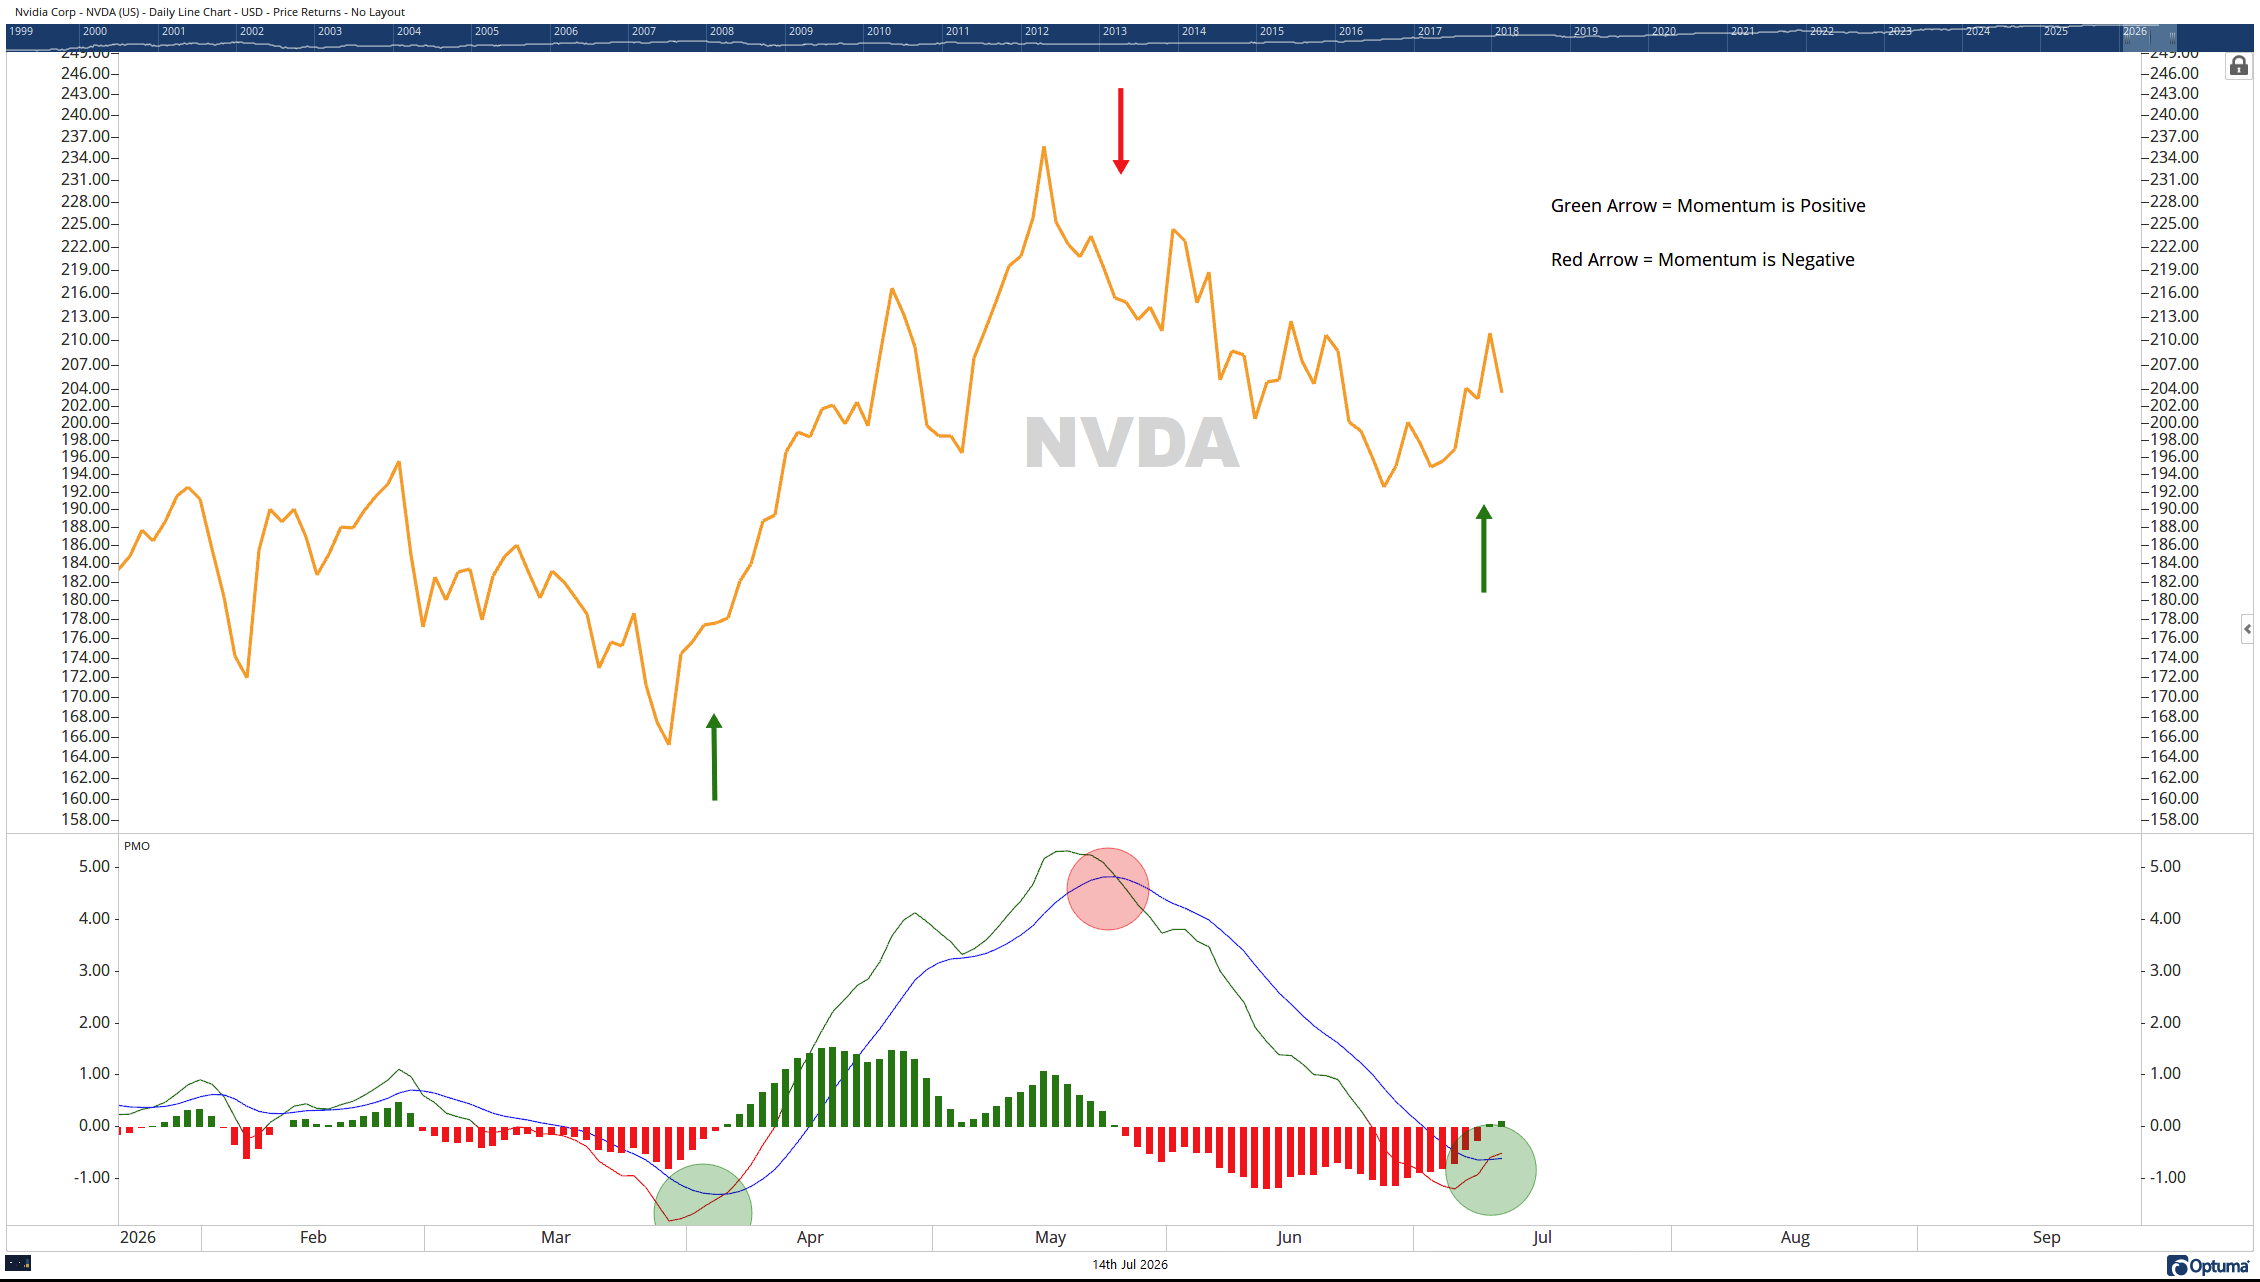
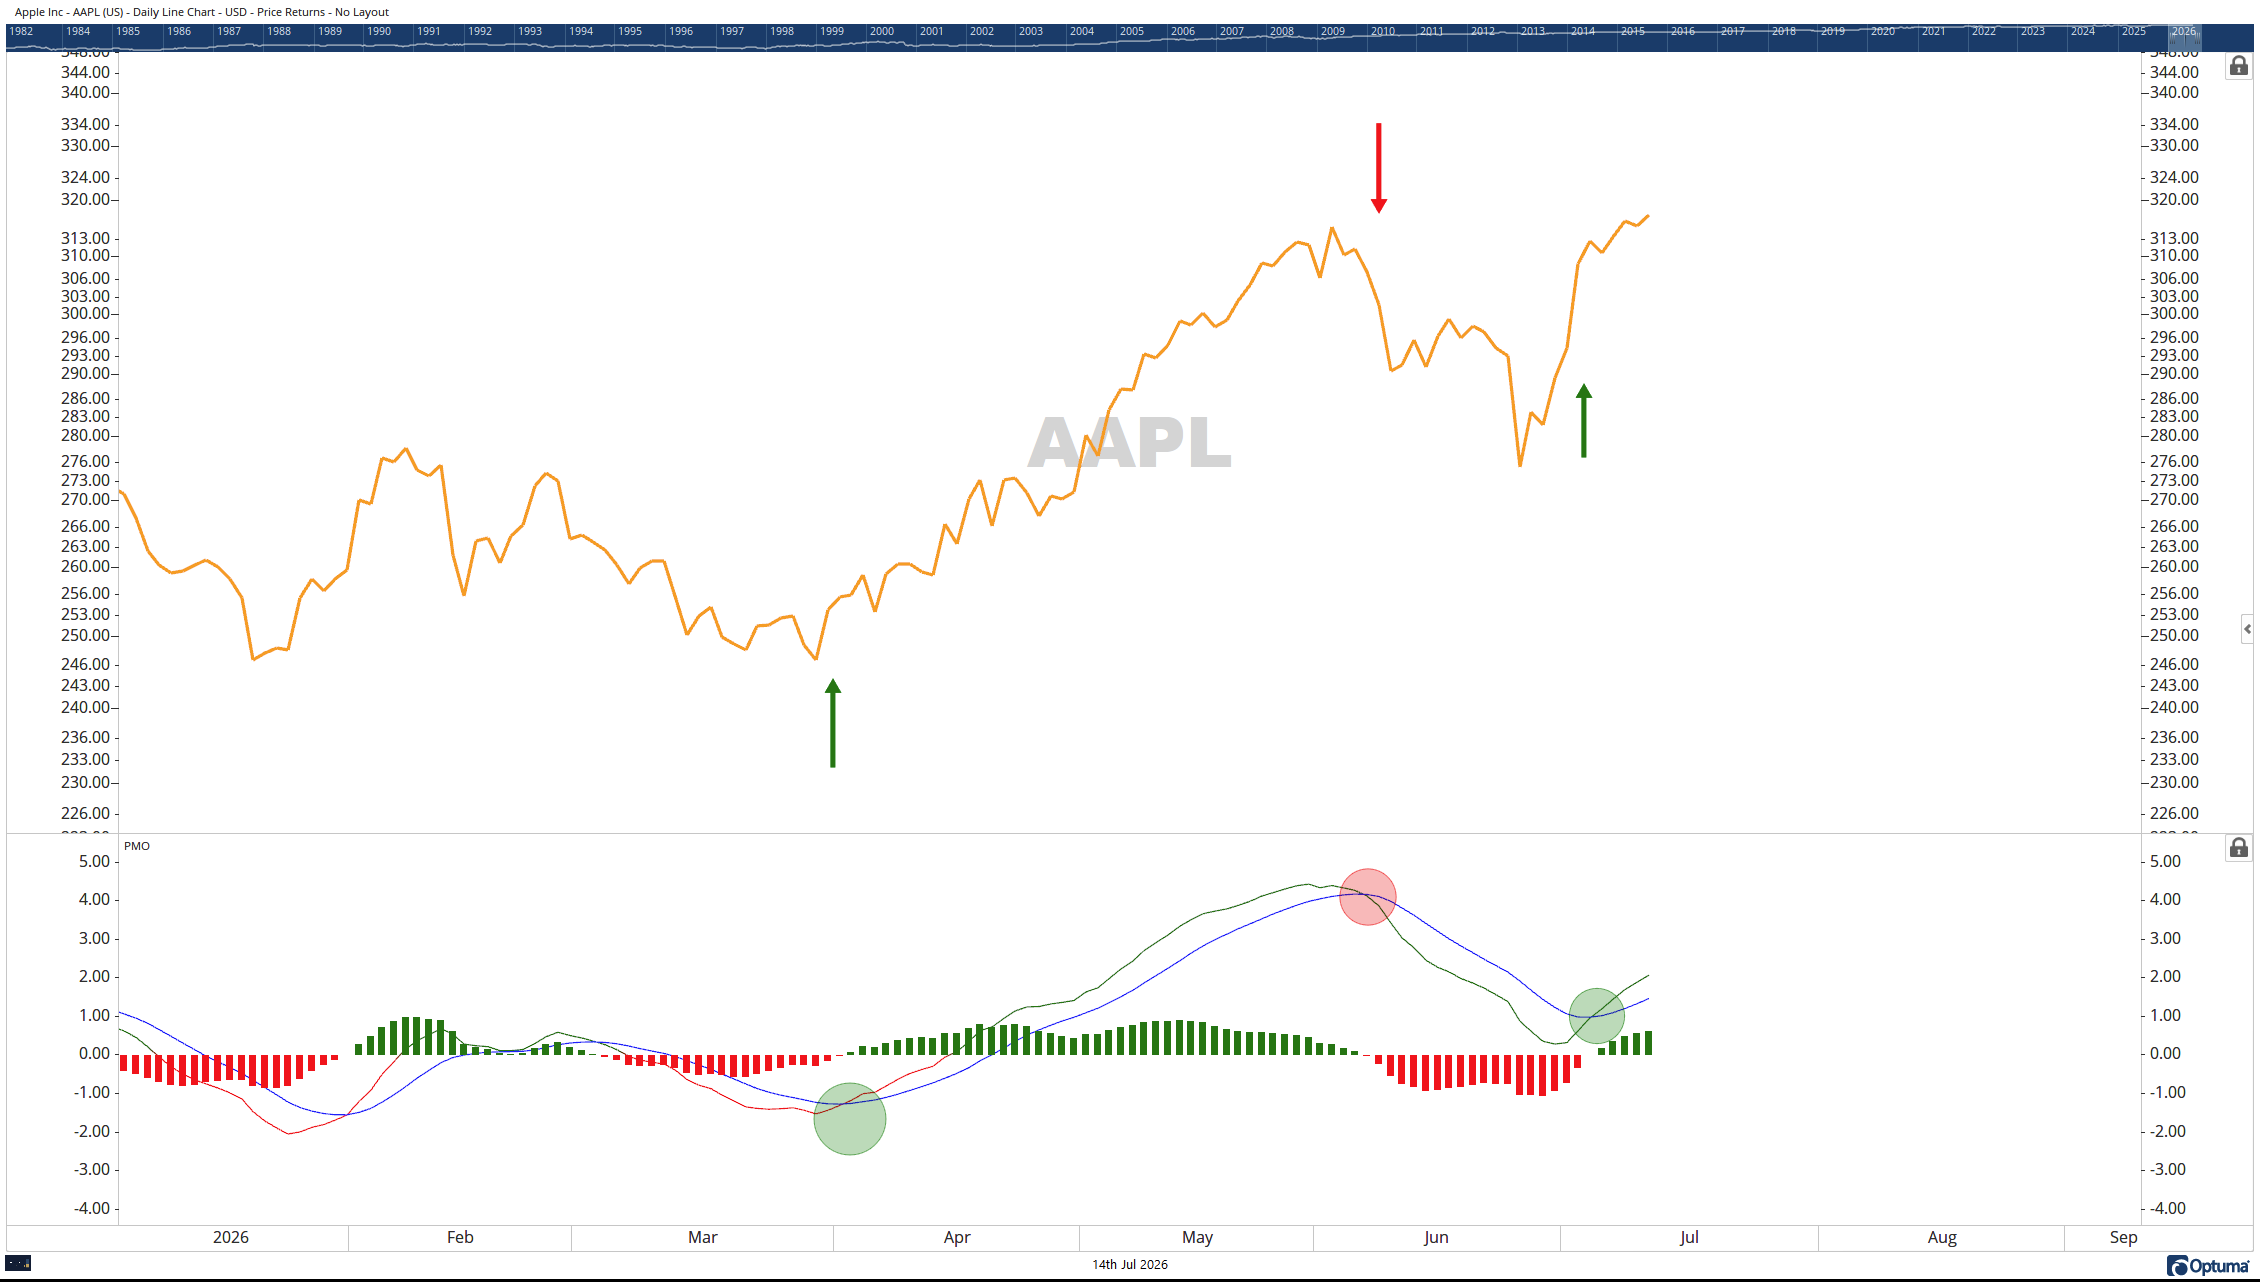
Large-cap tech leaders, like NVDA and AAPL, are showing signs of this improvement in momentum:
The rotation into Tech may also get a boost from today’s inflation data, which showed that inflation is starting to decline:
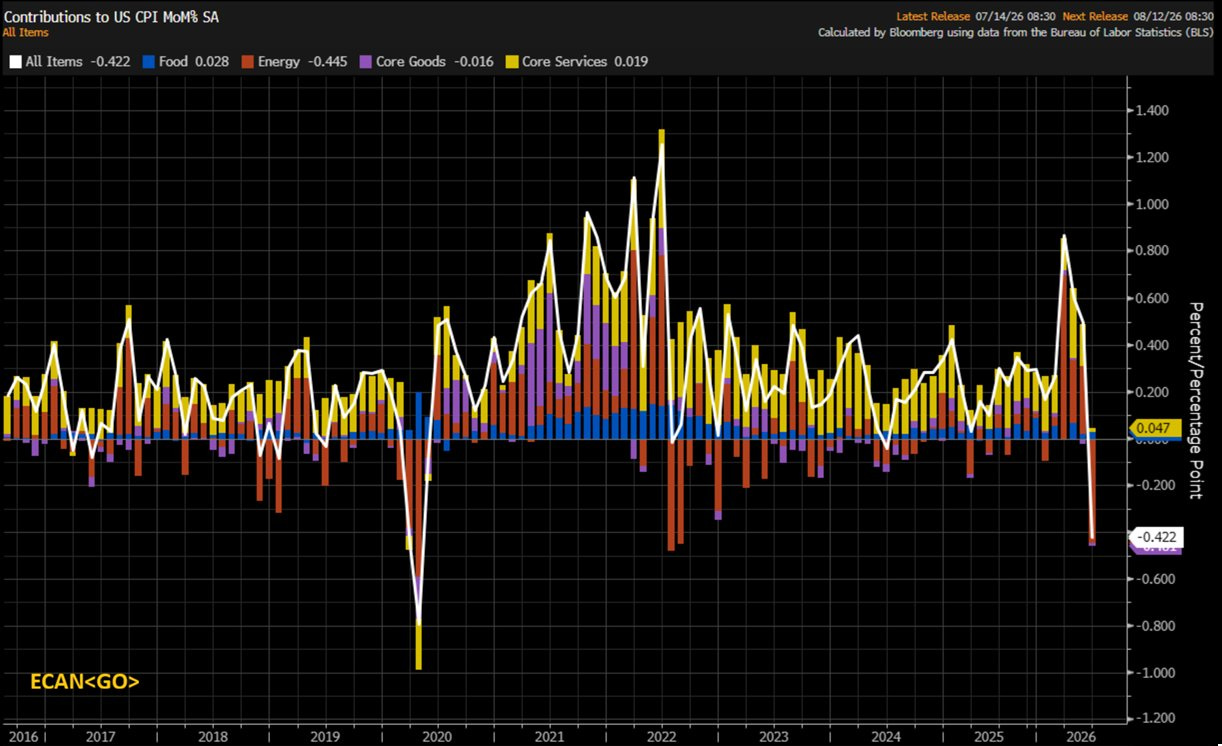
A big reason for the drop in inflation was lower oil prices:
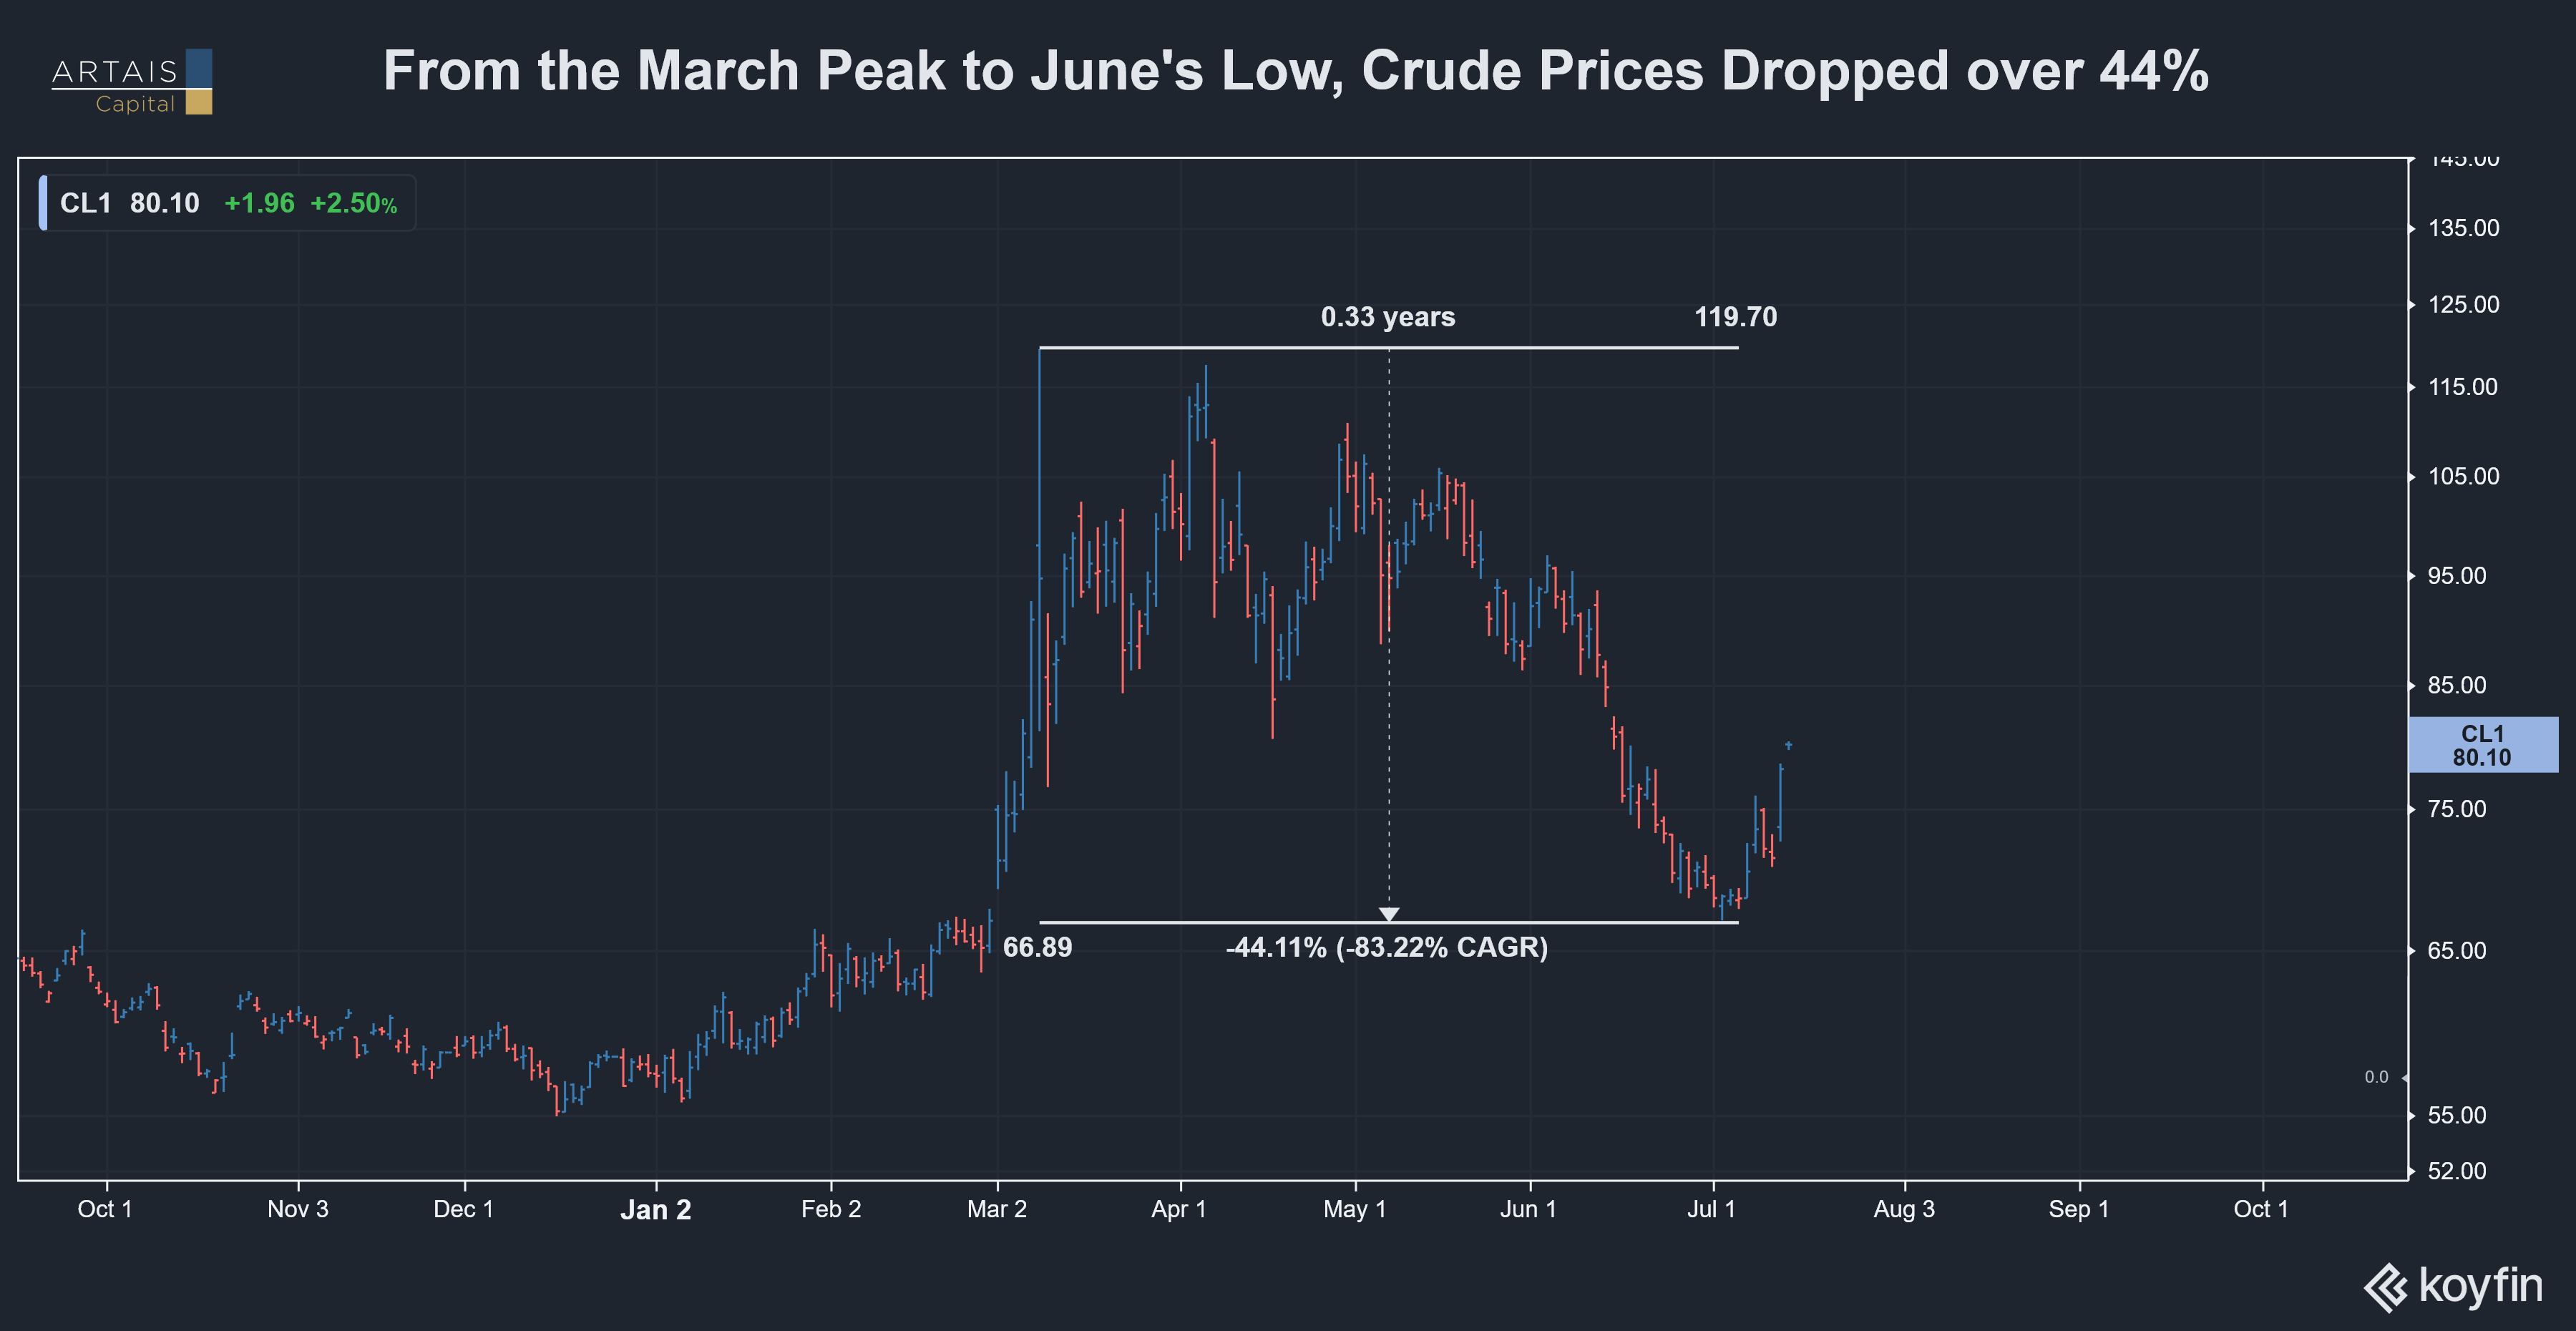
I wrote about the impact higher oil prices were having on inflation back in June:
https://www.johnrothe.com/p/inflation-just-hit-42-take-out-oil
…and how the market was too aggressive on its outlook for higher interest rates.
And after this morning’s inflation data, betting markets are now predicting low odds of a rate hike from the Fed during its July 29th meeting:
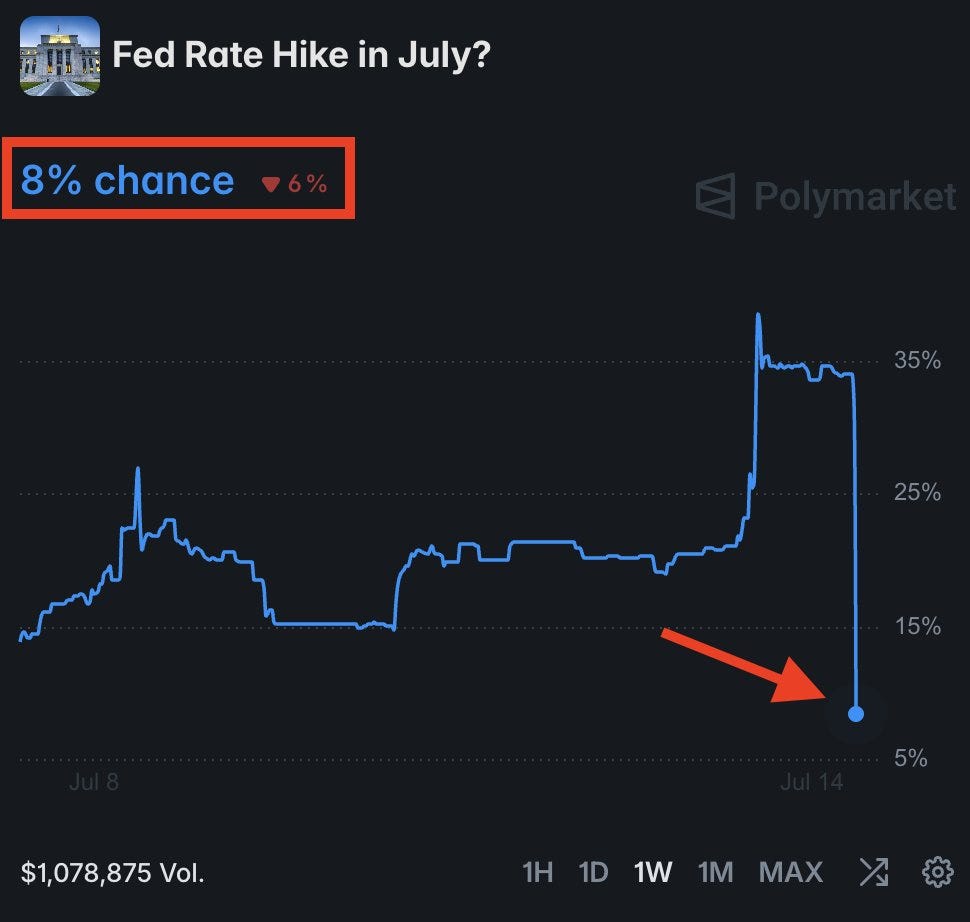
This is bullish for the market and bullish for AI, as lower short-term interest rates favor continued borrowing to fund AI growth.
Under The Hood