

Contents:
The 30,000 Foot View
S&P 500 Index: False Breakout?
Understanding How the S&P 500 Index is Constructed
Two Ways to View the S&P 500: Equal Weight vs Market Capitalization
Rotation from Overbought to Oversold
Four Scenarios I Am Closely Watching
Signs That Bond Yields May Start to Fall
Pass/Fail Screen for AI Universe
The 30,000 Foot View
I have been talking ad nauseam about the rise in yields in the bond market and how bond investors may be sending a signal to the Fed that they are not happy with how the Fed is handling inflation.
If you are new here (welcome!), you can catch up by reading last week’s research note: The 30,000 Foot View: The S&P 500 Looks Fine. Under the Hood, It Isn’t
S&P 500 Index: False Breakout?
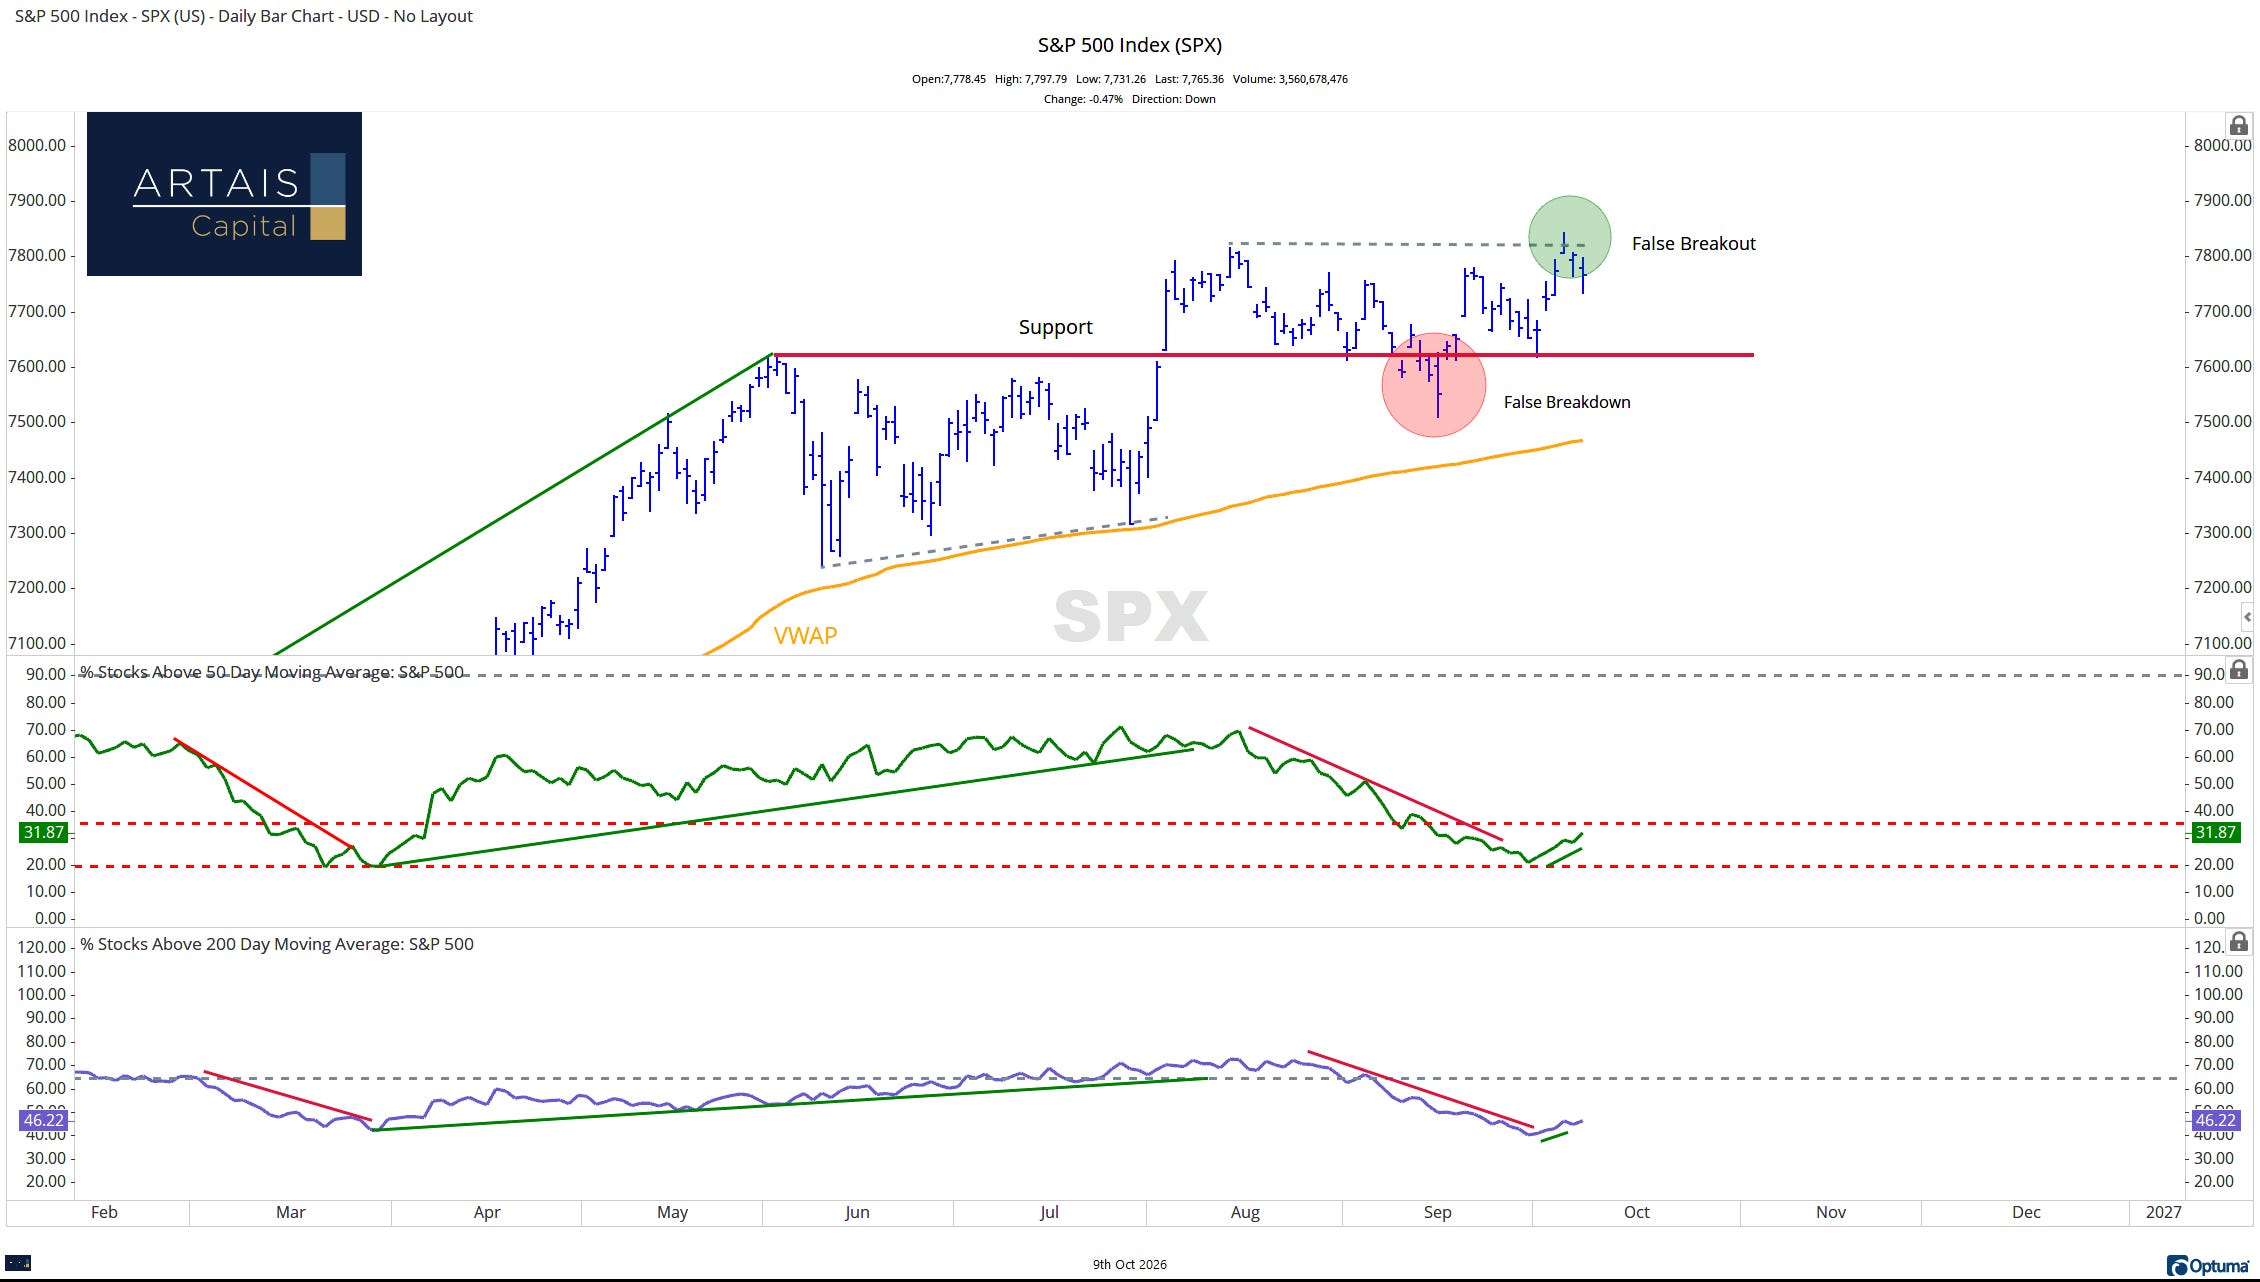
Currently, the S&P 500 is pulling back from all-time highs, as the index failed to break out above overhead resistance:
Does this mean that equity investors are starting to agree with the bond market?
From my viewpoint, not necessarily yet.
The above chart of the S&P 500 index includes two panels showing market breadth. This includes the number of stocks trading above their 50- and 200-day moving averages.
Roughly only 31% of stocks are trading above their 50-day moving average, and less than half are trading above their 200-day moving average.
In a rising market, you would expect to see more and more stocks in the index rising, but breadth has been showing the exact opposite.
Since late summer, the majority of stocks in the index have been declining. So how has the index still been rising?
Understanding How the S&P 500 Index is Constructed
The S&P 500 index is just that, an index. The index is owned and managed by S&P Dow Jones Indices, a joint venture that is 73% owned by S&P Global and 27% owned by CME Group.
The index has specific criteria too:
“To qualify for the S&P 500, companies must meet specific requirements—including U.S. domicile, a minimum market capitalization (reviewed quarterly, currently set at $22.7 billion), a public float of at least 10%, sufficient trading liquidity, and positive earnings over the most recent quarter and trailing four quarters.” (source: Investopedia)
Why bring this up?
It is important to understand how the various indexes that track the stock market are constructed, so we can better understand what is causing the index to rise or fall.
The S&P 500 index is a market capitalization index, which simply means the larger the company, the larger the allocation in the index. Right now, the 10 largest holdings are all technology companies:
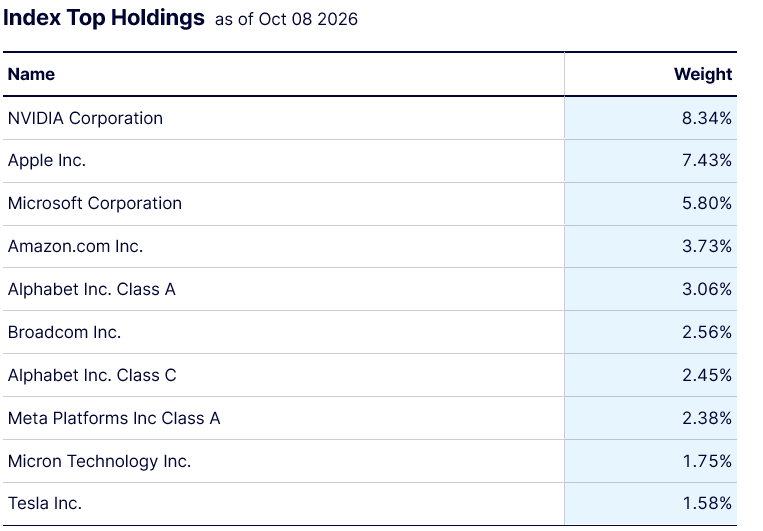
source: State Street
“John, you are rambling again.”
Stay with me. I am going somewhere with this…
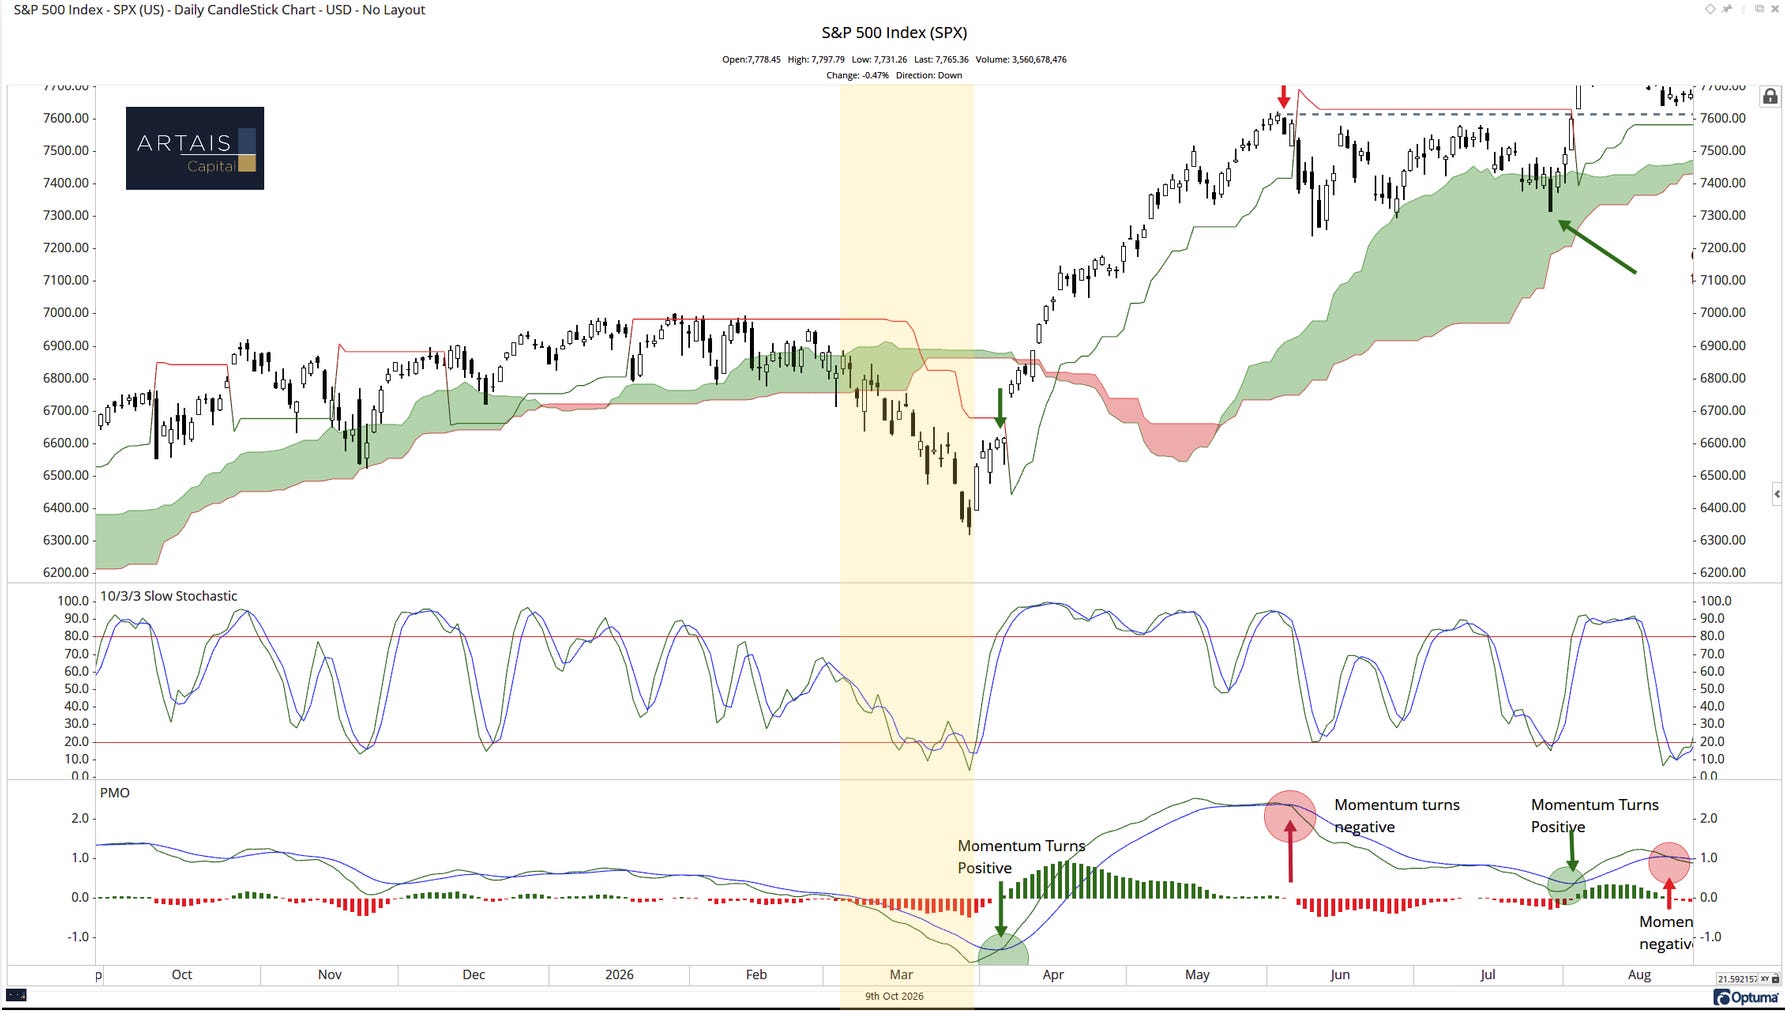
Currently, the S&P 500 index is showing weak positive momentum and is starting to decline after signs of buying exhaustion.
Also, note that the index is still trading above the Ichimoku cloud (more on that in a second):
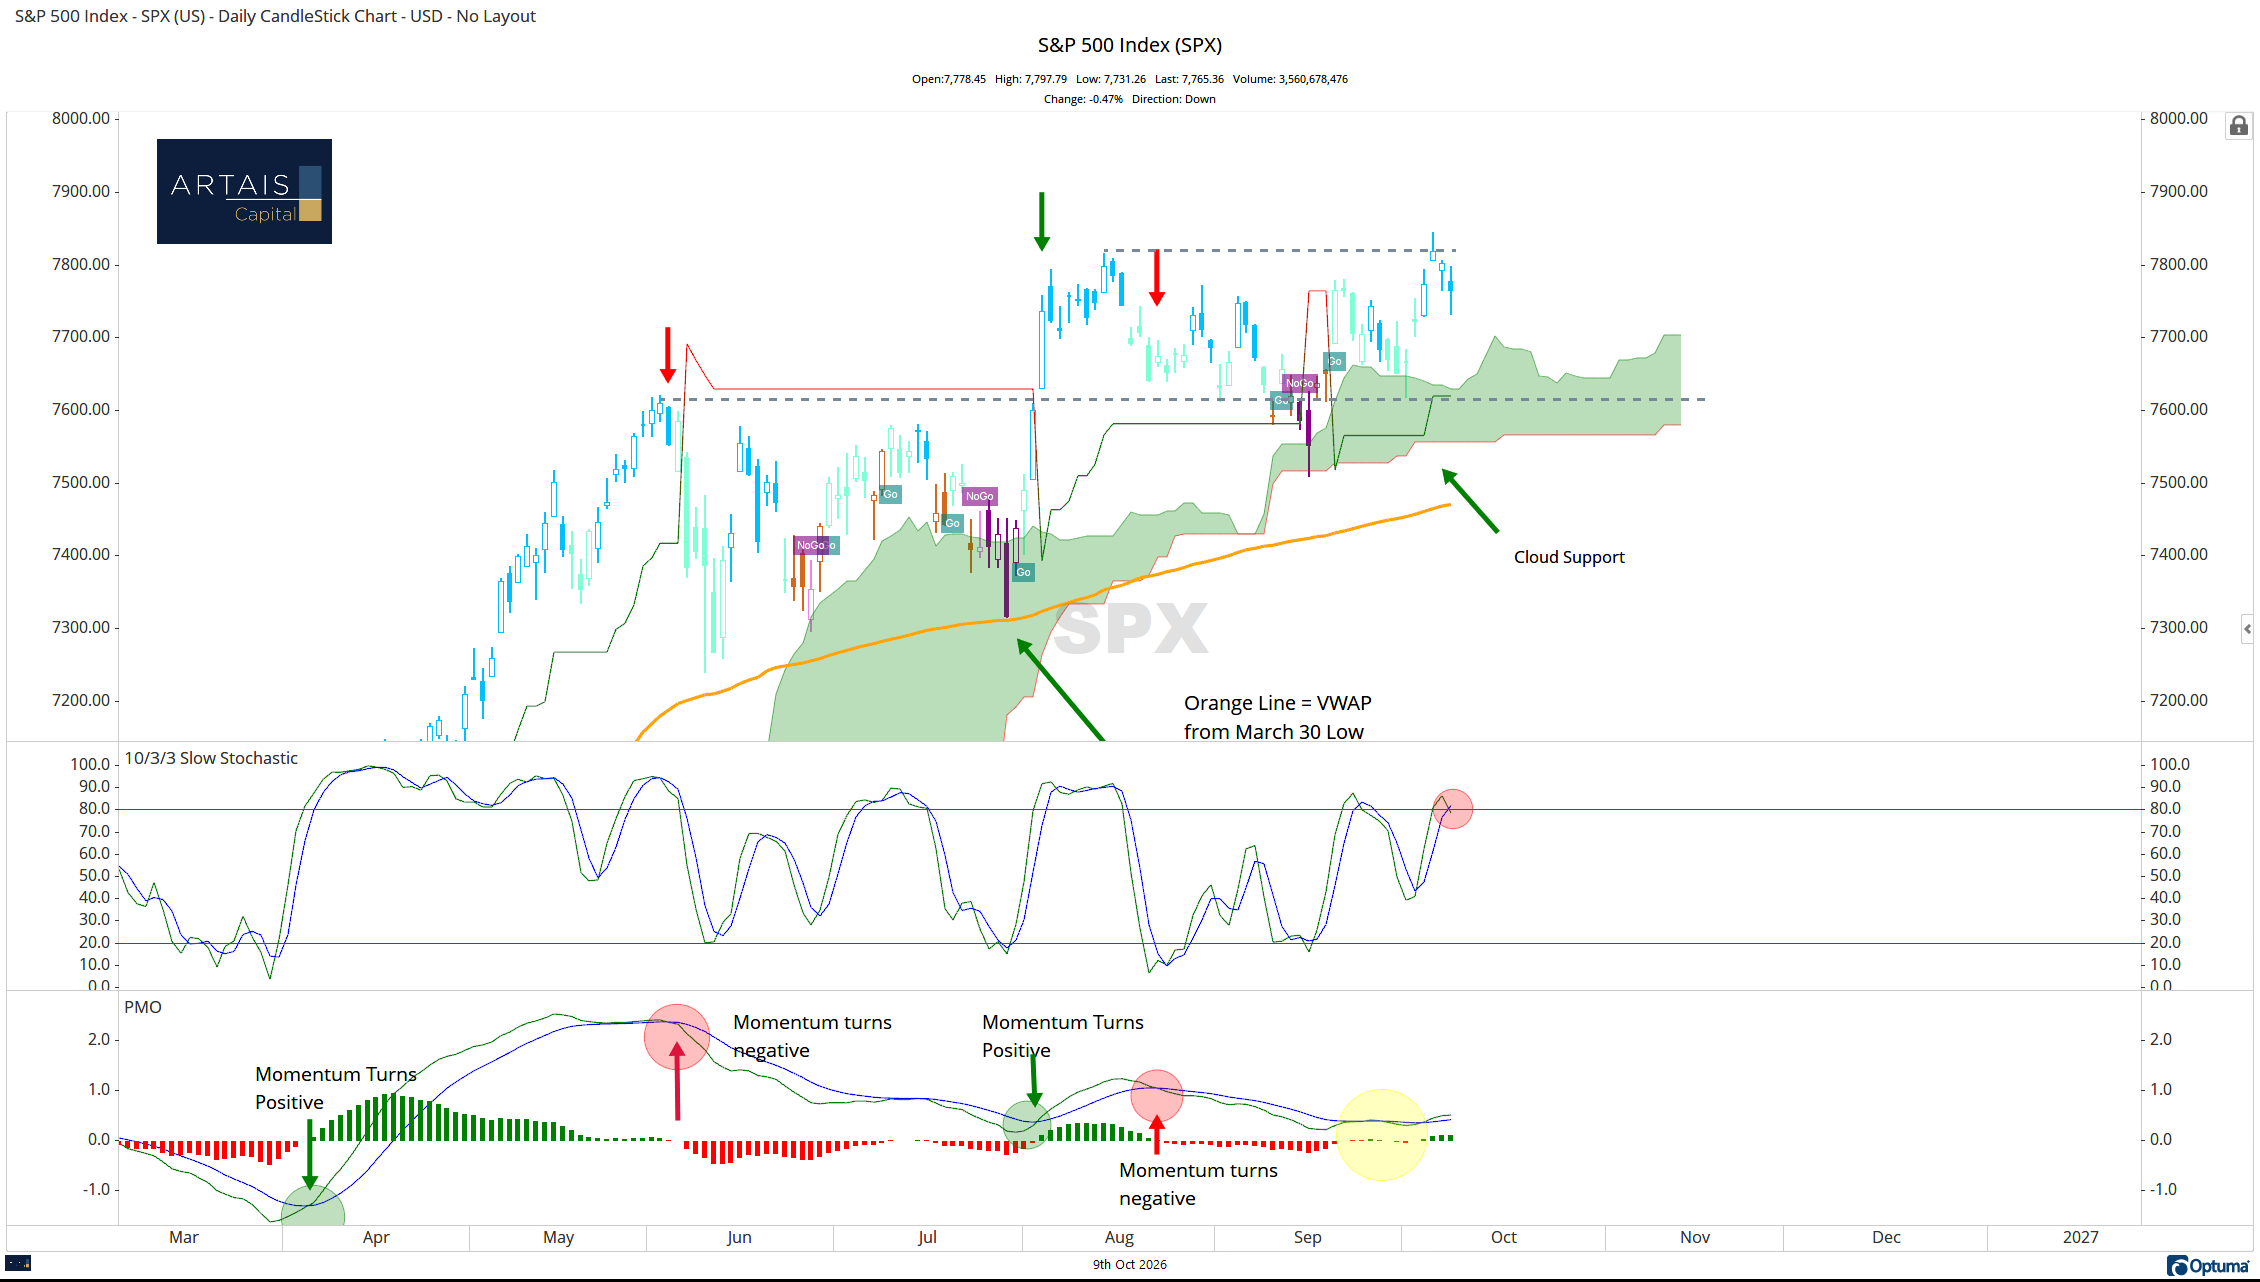
BUT there is more than one index and more than one methodology to measure the stocks that are included in the S&P 500.
Two Ways to View the S&P 500: Equal Weight vs Market Capitalization
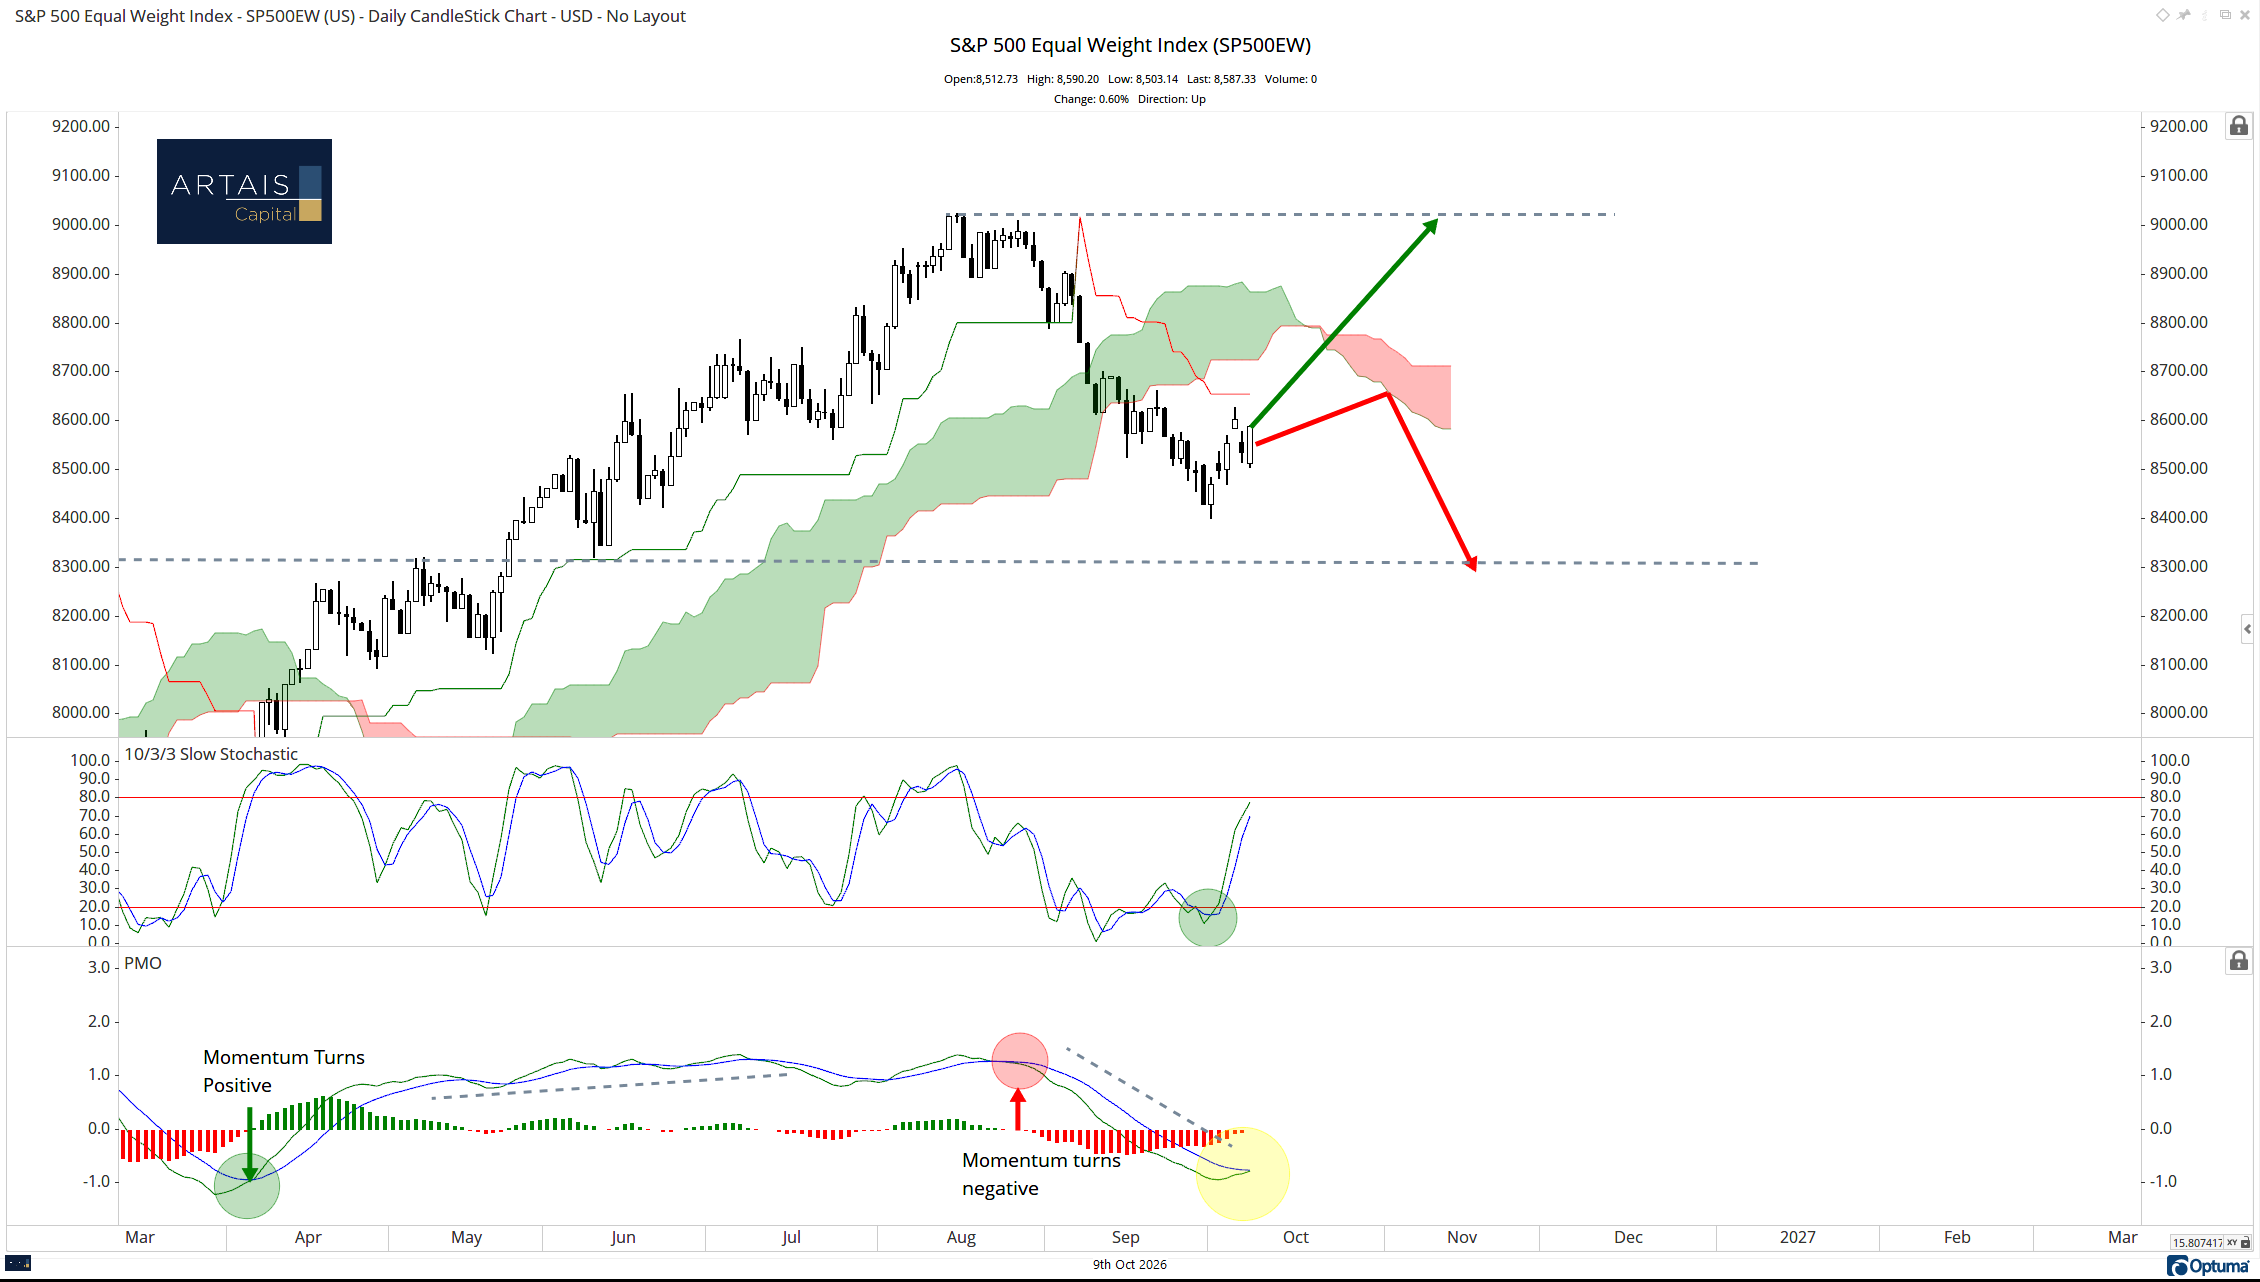
The Equal Weight (EW) S&P 500 index gives an equal weighting to each stock in the index, and it is painting a very different picture, as the EW index is showing signs of improving upside momentum:
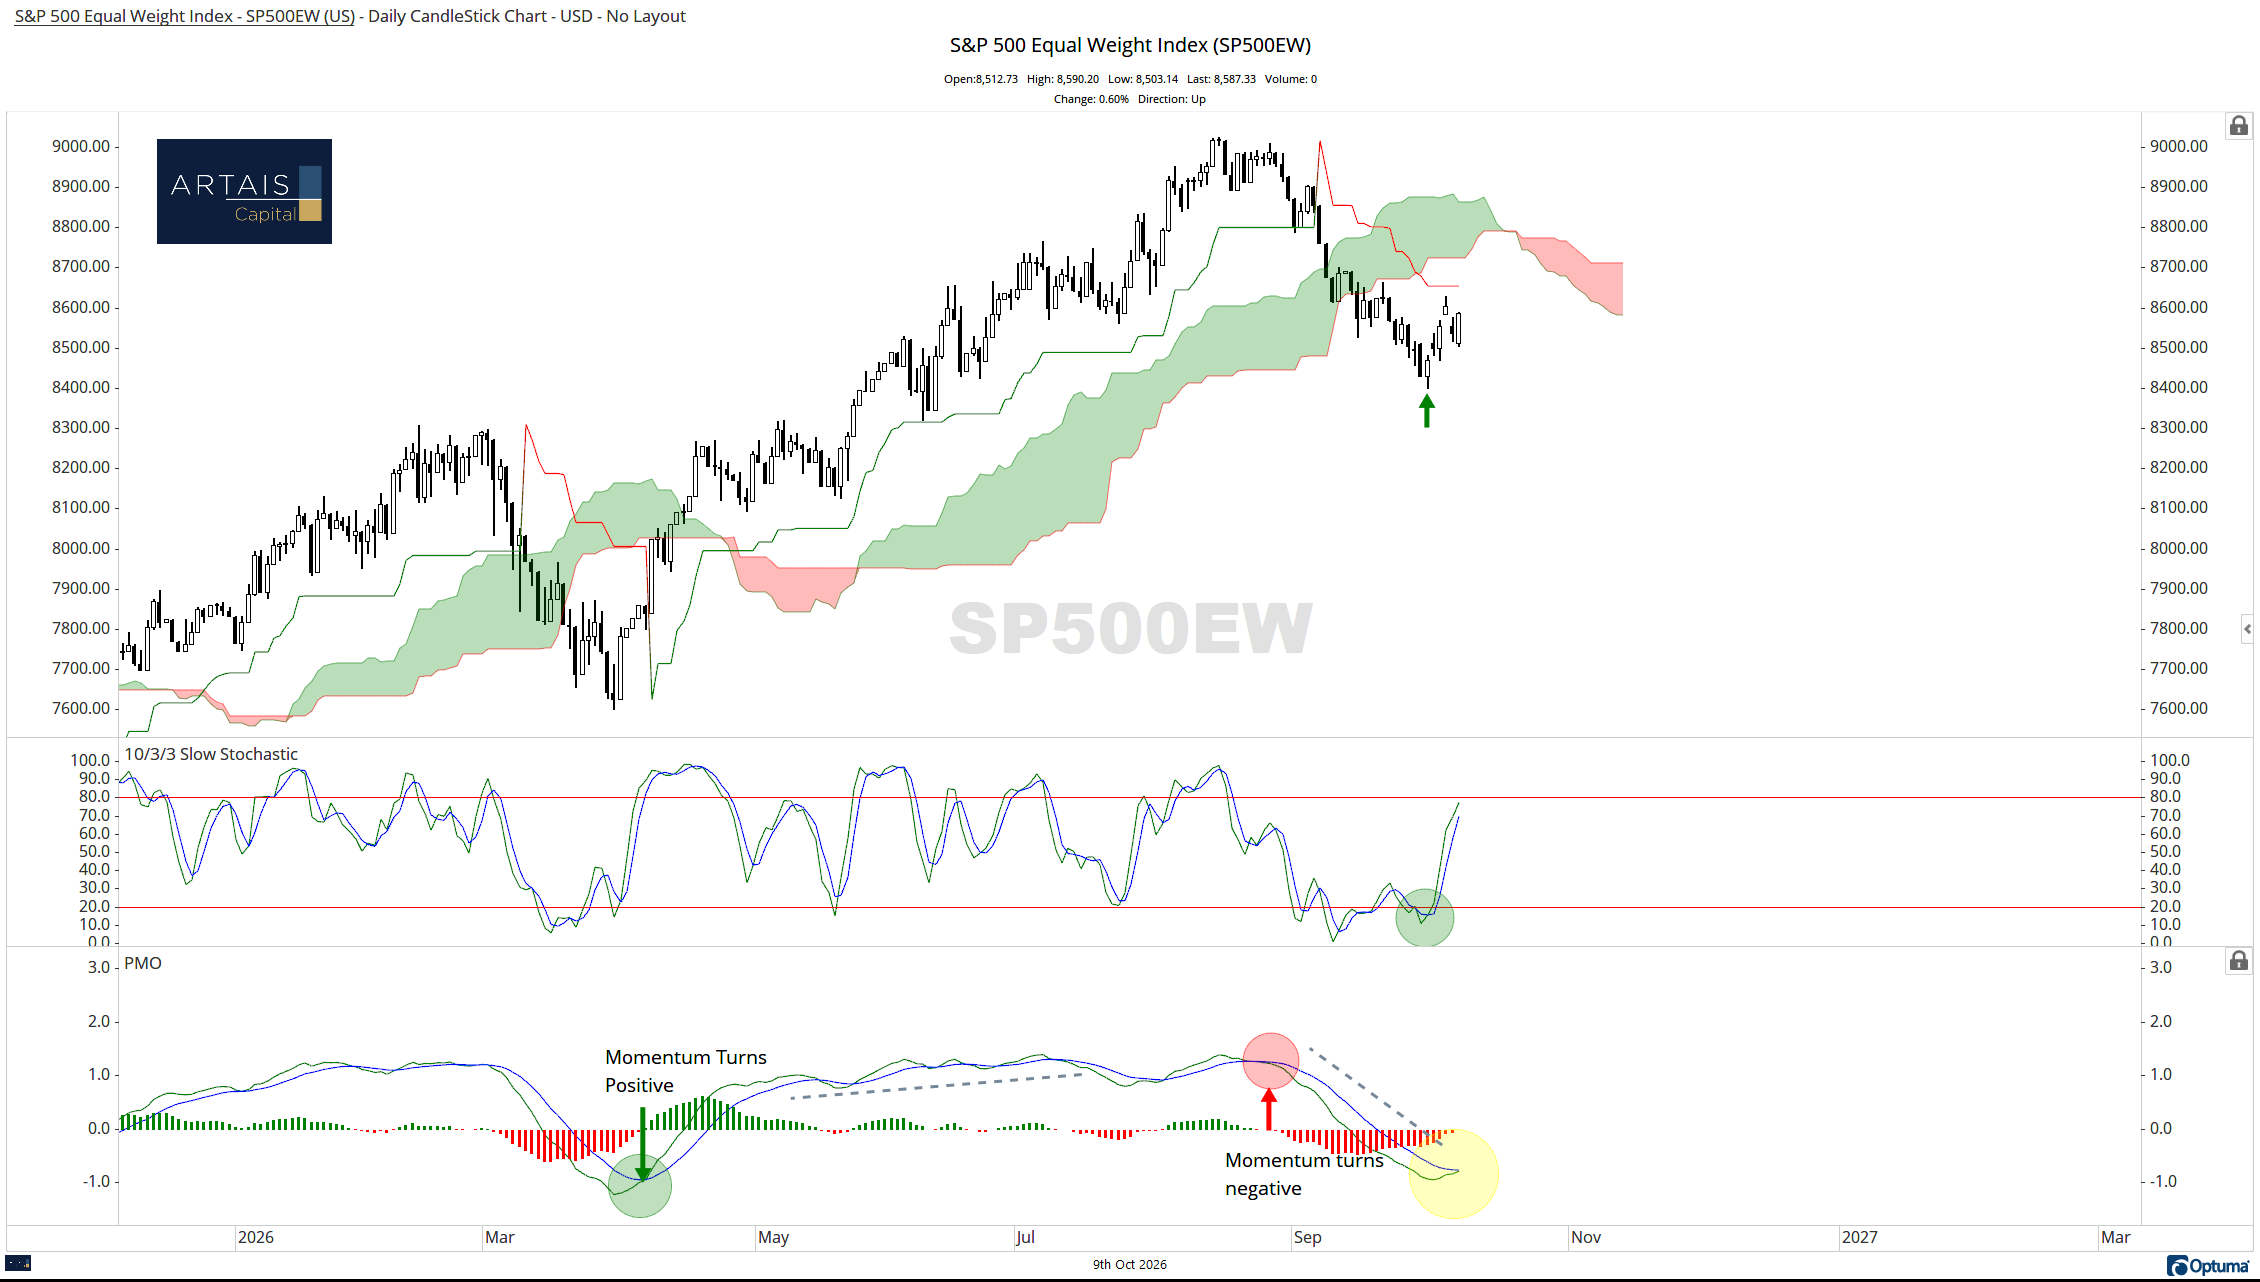
The Ichimoku cloud helps us better visualize whether an index, sector, or stock is in a longer-term uptrend or downtrend. As you can see in the two charts, the EW index is still trading below the cloud, while the market-cap S&P 500 is trading above.
What this tells me is that investors don’t seem to be moving out of equities, since both indexes are not trading below the cloud.
Rotation from Overbought to Oversold
Instead, in the short term, investors are either moving away from high-beta names to control risk as bond yields rise, or simply rotating from an overbought sector (technology) into oversold sectors.
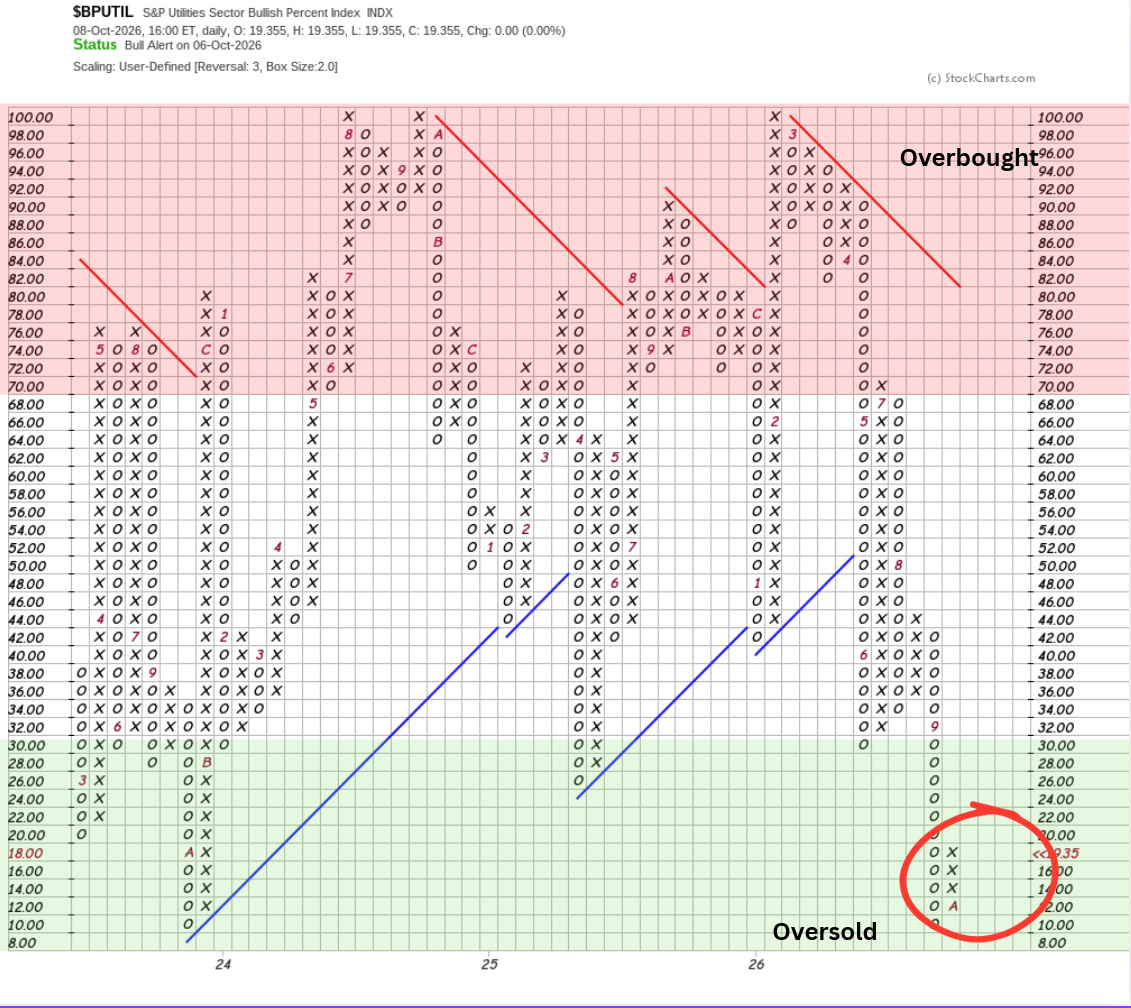
The bell curves below compare each sector’s Bullish Percent Index within the S&P 500. Currently, a large part of the market is sitting near or at oversold levels:

Sectors like utilities are deeply oversold, and mean-reversion traders are taking advantage of it:
Four Scenarios I Am Closely Watching
Obviously, investors have plenty to worry about: rising yields, the midterm elections, inflation, a growing deficit, and the impact AI may have on the job market.
These are the four scenarios I am watching for insight into how the market is weighing these worries:
Technology and the majority of the other S&P 500 sectors’ Bullish Percent Indexes reverse and begin to decline.
This indicates that investors are abandoning equities and no longer care about searching for oversold opportunities in strong names.

The S&P 500 Index falls below the Ichimoku Cloud
This is a sign that the trend in the market-weight index has reversed, and we may see the selling in equities accelerate, similar to what happened earlier this year:
The Equal Weight S&P 500 Index nears the cloud (overhead resistance) and turns back down.
This would signal that either equity investors don’t want to own stocks (especially if accompanied by either scenario 1 or 2) - or - the market is rotating back into tech and high-beta names.
4. Bond yields start to fall, AND equities rise.
The rise in yields in the US Treasury market has been viewed by many, including myself, as warranting caution in the stock market.
If yields start to decline, a big concern to equity investors is removed. At that point, we may start to see the market embrace the seasonality theme, which tells us that historically, we are entering a strong period for stocks.
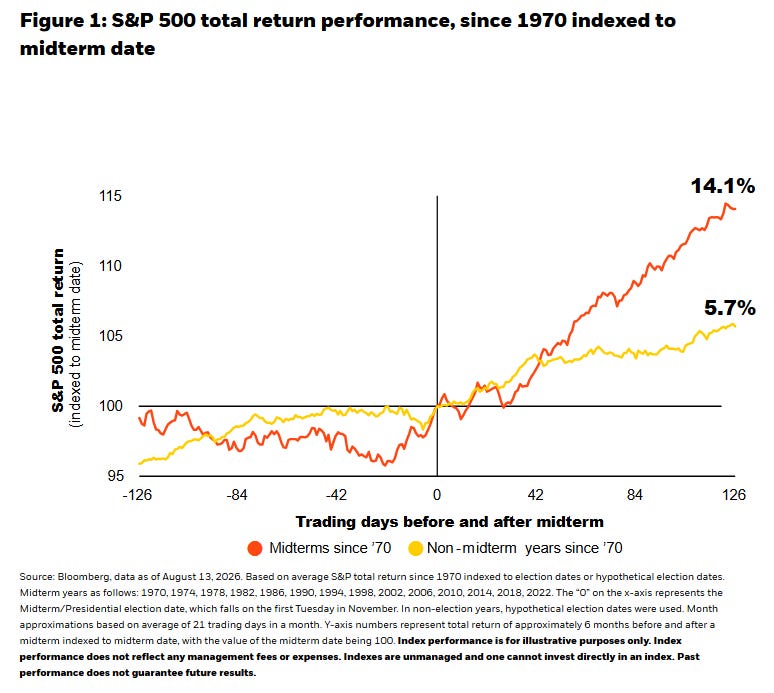
source: Blackrock
Signs That Bond Yields May Start to Fall
As I mentioned, one of the biggest worries on investors’ minds is the rise in US Treasury yields. Signs are emerging that this rise may be nearing an end:
Magazine covers as a contrarian signal
One of my favorite contrarian signals has nothing to do with charts. It’s the magazine rack.
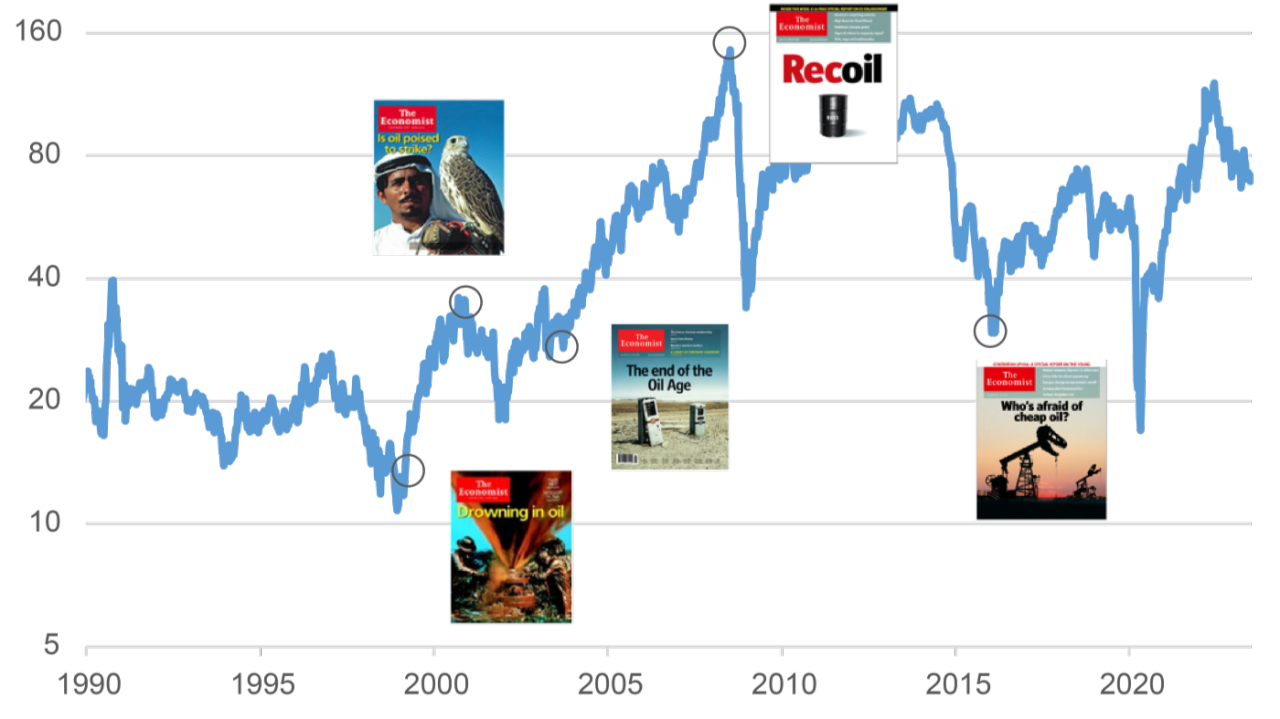
By the time a market theme makes it onto the cover of a major news magazine, the story is usually well known, the easy money has already been made, and the last of the buyers (or sellers) are already in.
The editors aren’t wrong about the trend. They are just late.
A cover story is written for the general public, and the general public tends to show up at the end of a move, not the beginning.
The classic example is BusinessWeek’s “The Death of Equities” cover in August 1979.
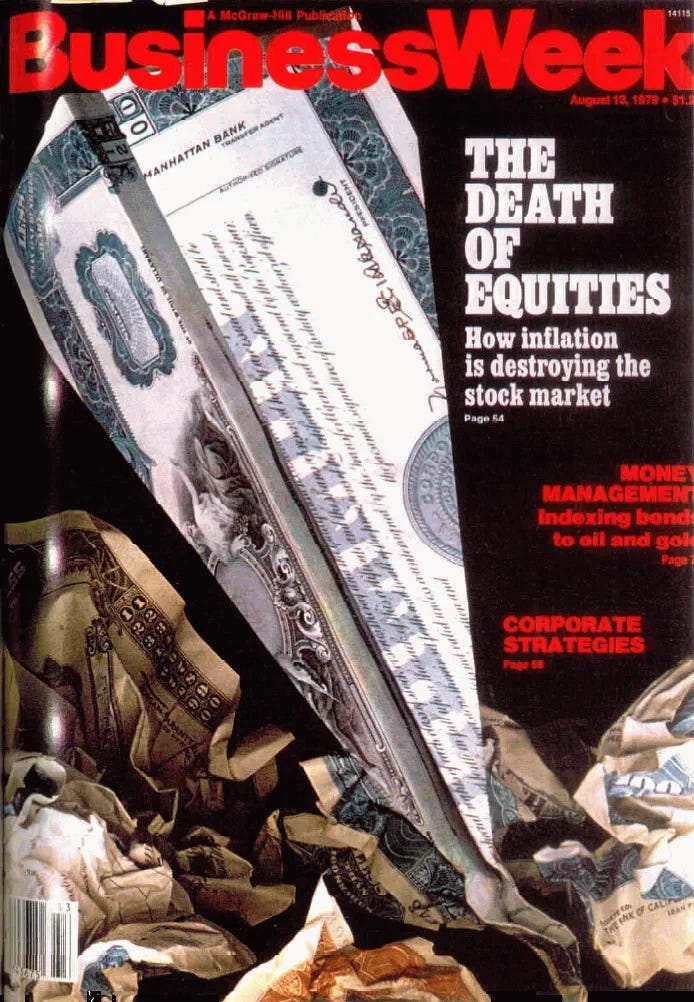
Stocks had gone nowhere for over a decade, and the cover declared that the asset class was finished. Three years later, one of the greatest bull markets in history began.
Even Fidelity’s legendary chart room has a section dedicated to this phenomenon:

source: Smith + St John
Well, look what The Economist put on its cover this week:
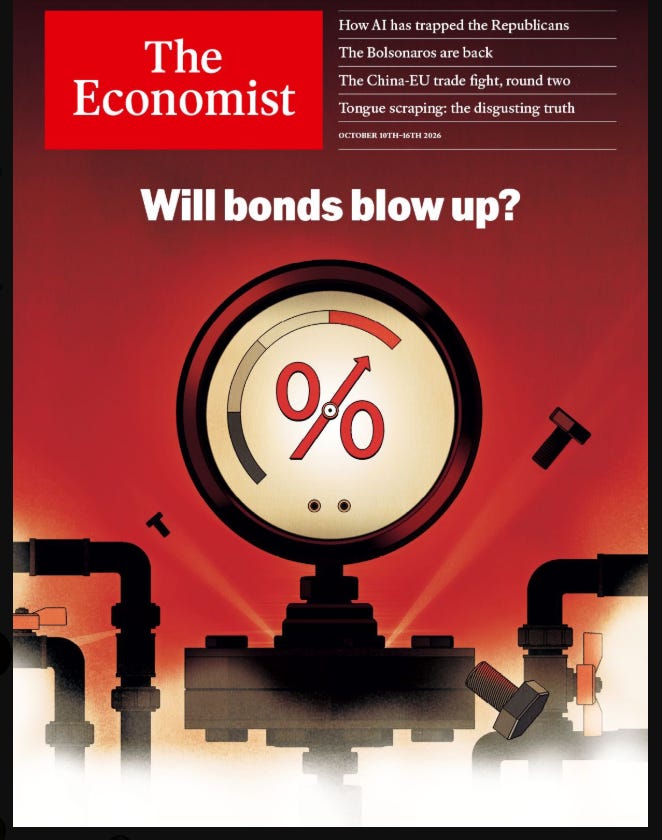
Economists Are Turning Bullish on Bonds
Economist Jim Bianco has been (correctly) one of Wall Street’s biggest bond market bears. For the first time in 6 years, he has changed his view:
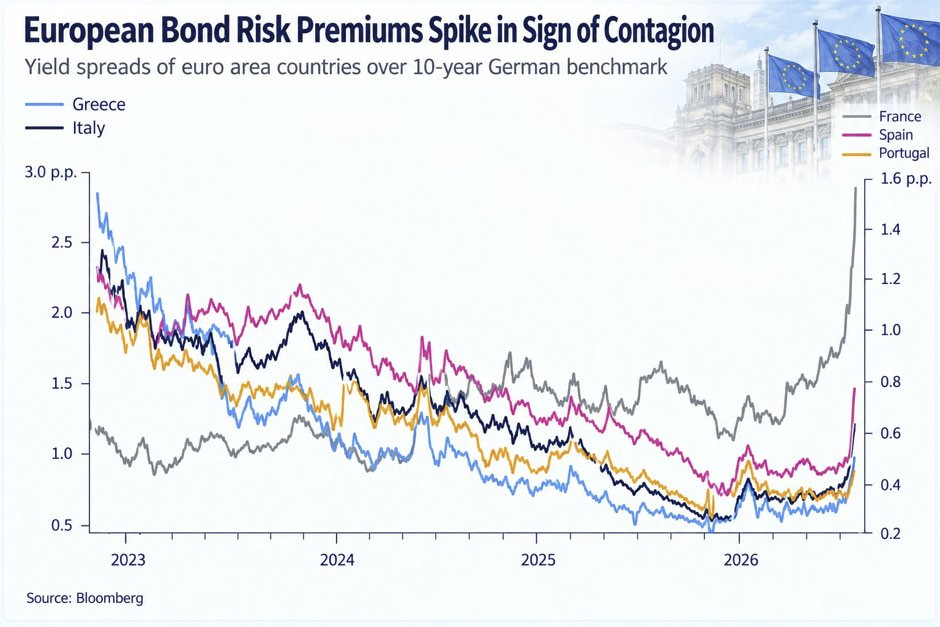
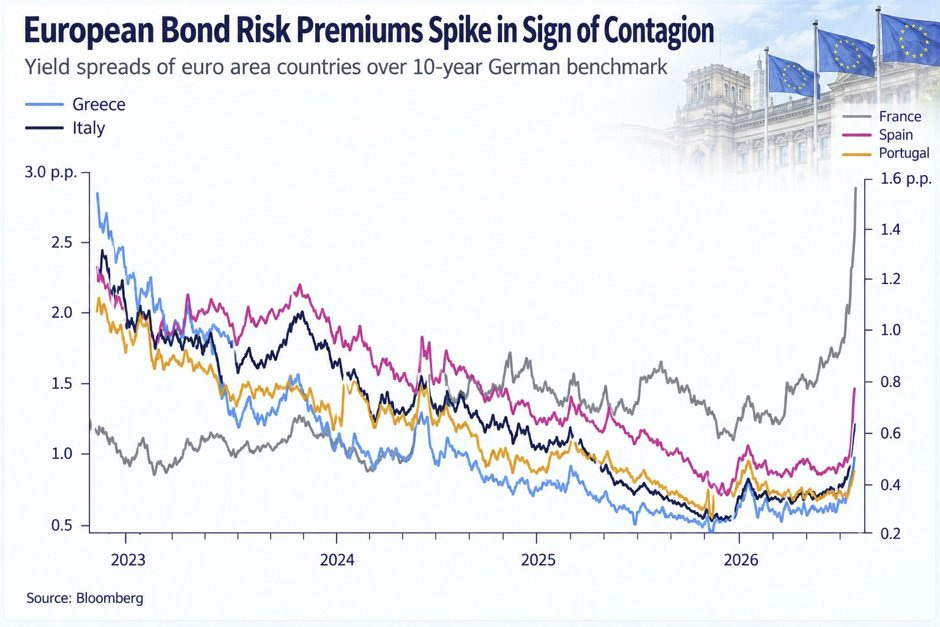
France is Having Its Own Bond Market Issues
The bond market is losing confidence that France can fix its deficit.
France has run a deficit every year since 1973. Debt is ~119% of GDP and still rising. Interest costs are ~€65 billion this year and could top €90 billion next year, so the debt is compounding faster than the economy.
As a result, investors in French bonds are now demanding a higher yield than on Greek and Italian bonds.
This means they are viewing French bonds as RISKIER than Greek bonds.
We may start to see foreign investors move to US bonds in a flight to safety. This will cause bond prices to rise and yields to fall. (Bond yields and prices trade inversely.)
Summary
The S&P 500 is pulling back from all-time highs, but under the hood, this looks more like a rotation than an exit.
The market-cap index is weakening because tech is weakening. The equal-weight index is improving because the oversold sectors are catching a bid.
Both are still trading above the cloud. Until that changes, I don’t think equity investors have thrown in the towel.
The bigger question is still the bond market.
Yields have been the main reason I have been cautious, and for the first time in a while, I am seeing signs that the move may be running out of steam: a magazine cover, a well-known bond bear changing his mind, and a French debt problem that could push foreign money into US Treasuries.
None of these are signals on their own. But if yields start to fall, the biggest headwind for stocks is removed, and we walk into the strongest seasonal window of the year with a lot of sectors sitting at oversold levels.
