

In rules-based investing, the goal is to identify shifts in momentum before they are fully reflected in price. I am a big fan of Relative Rotation Graphs (RRG) and how they can help to visualize how different assets are performing compared to a benchmark like the S&P 500.
Current data suggests a notable shift in the precious metals space.
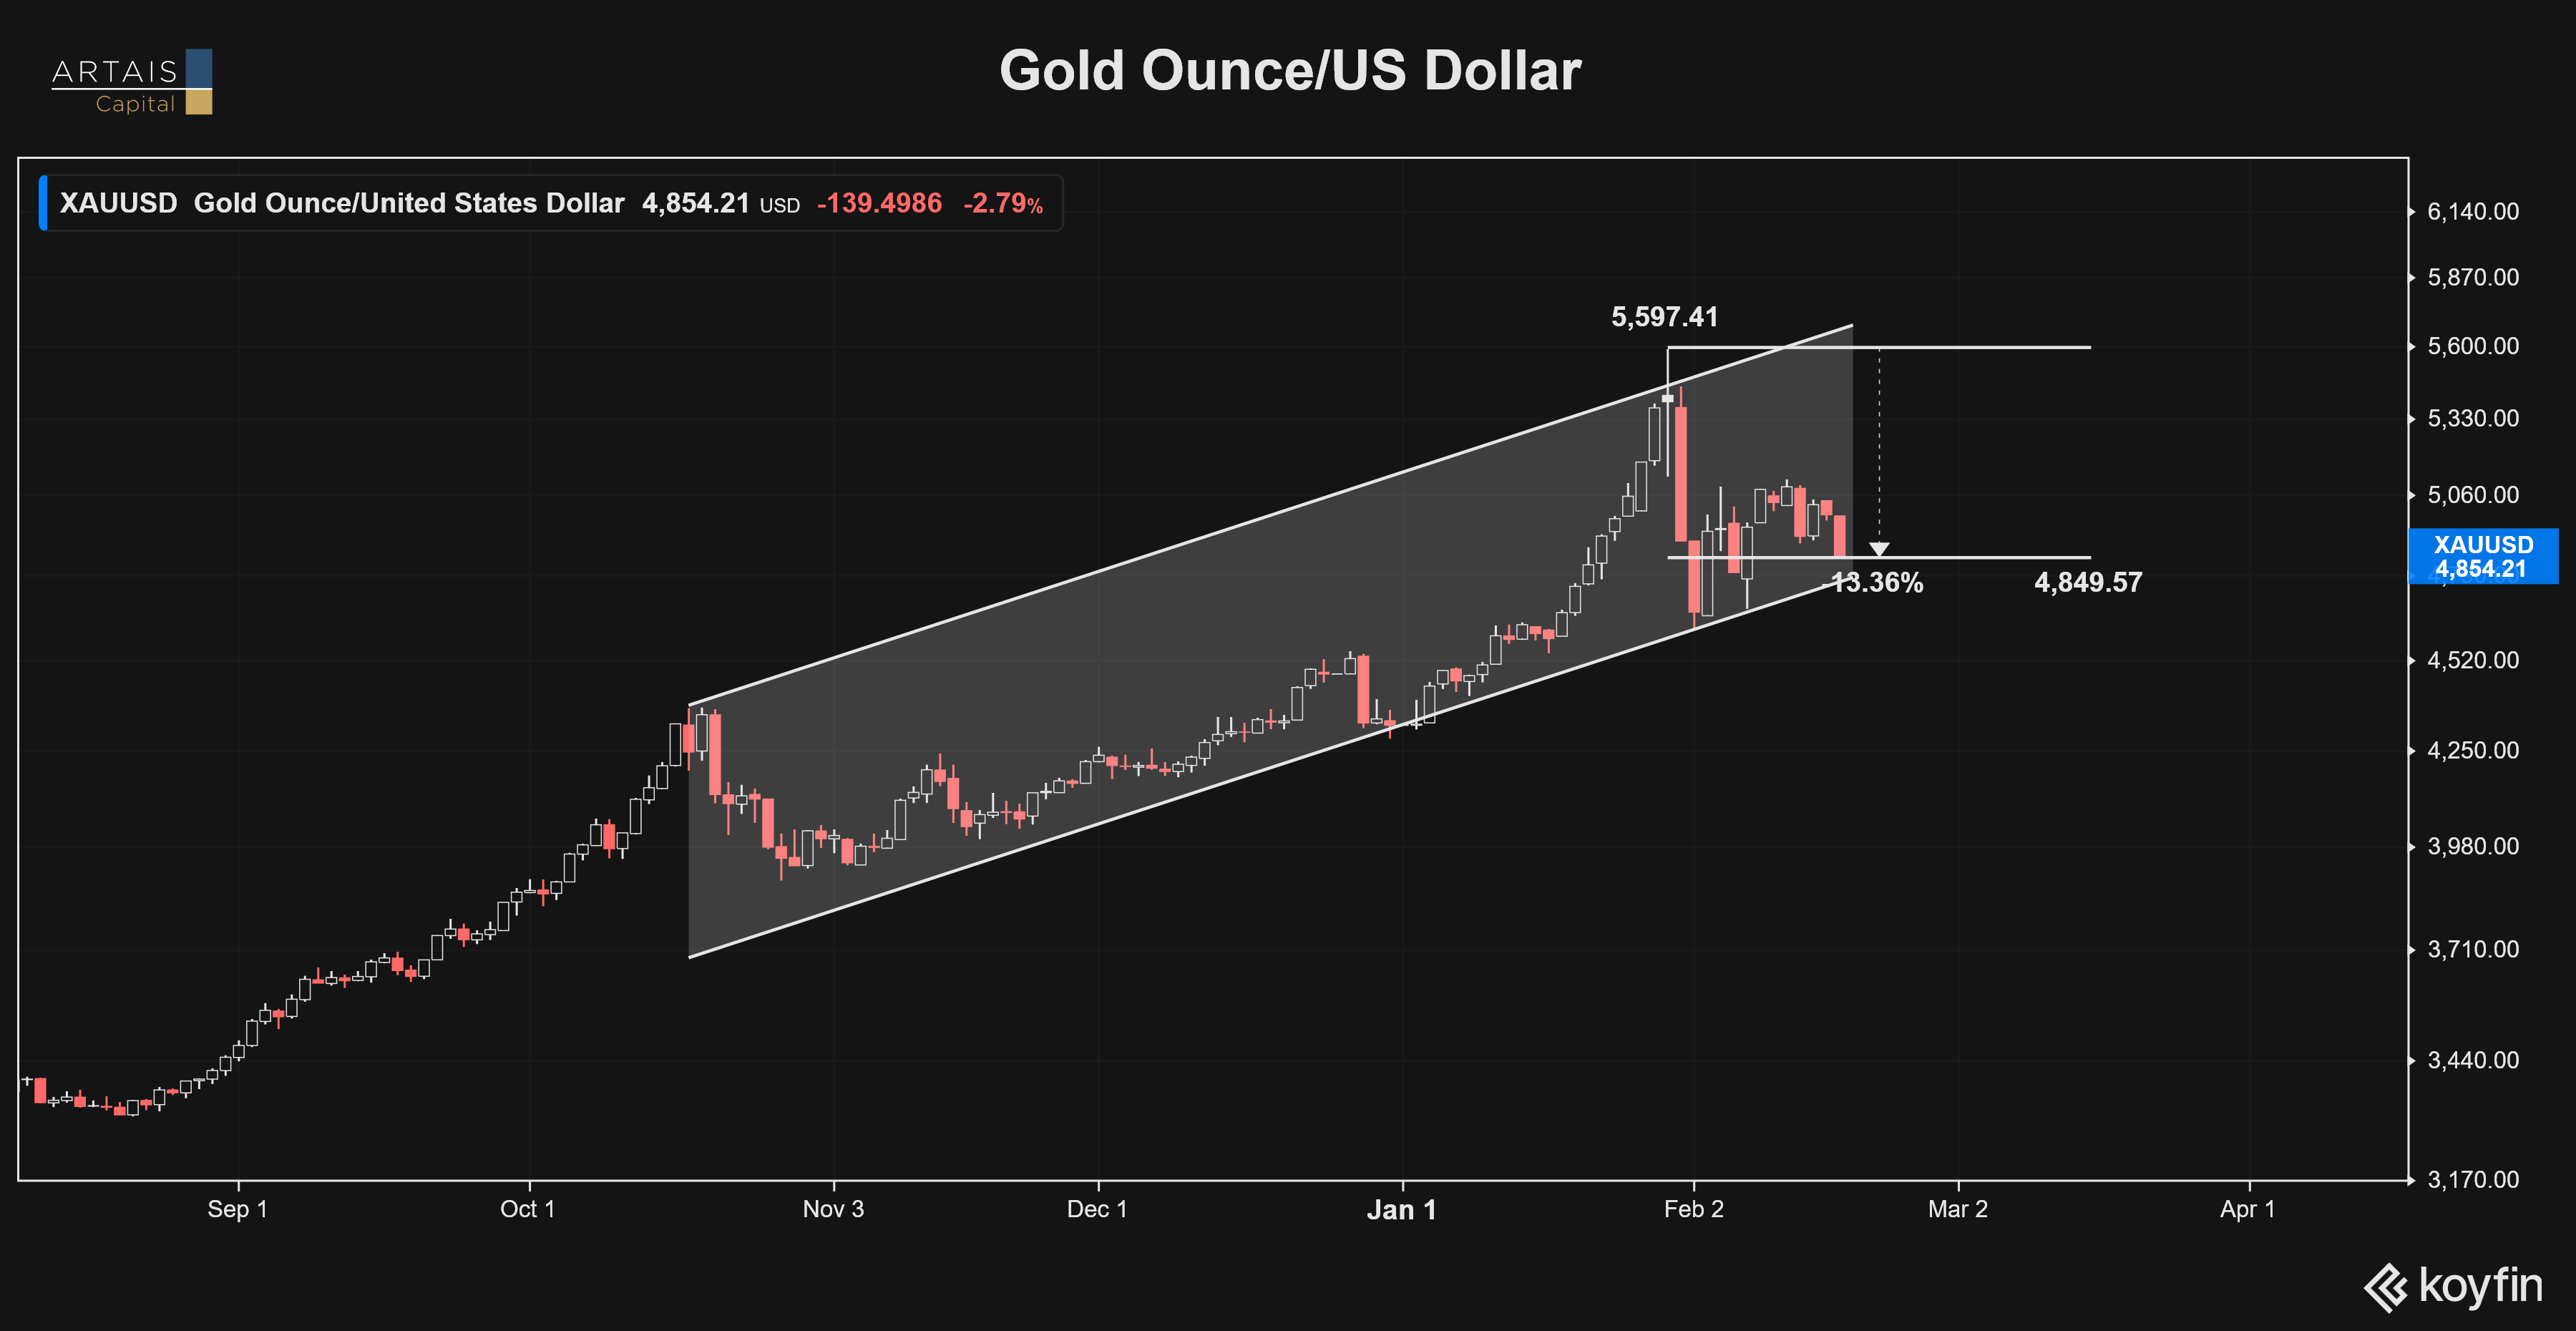
Specifically, SPDR Gold Shares (GLD) and miners like GDX and XME are exhibiting a technical pattern known as a “higher low” on the RRG.
While this is often viewed as a bullish signal by technical analysts, it is important to evaluate this rotation within the context of overall market risk and the limitations of momentum-based indicators.
What the RRG Tells Us (And What It Doesn’t)
An RRG plots assets across four quadrants based on Relative Strength (RS-Ratio) and Momentum (RS-Momentum). Assets typically rotate clockwise:
Leading: Strong relative trend and accelerating momentum.
Weakening: Strong relative trend, but decelerating momentum.
Lagging: Weak relative trend and decelerating momentum.
Improving: Weak relative trend, but accelerating momentum.
Risk Note: It is important to remember that RRG is a lagging indicator based on historical price data. Past performance, and past rotations, do not guarantee future results. An asset can “stall” in any quadrant or reverse its course unexpectedly due to macro shifts.
The Current Observation: A “Hook” in Weakening
As of mid-February 2026, GLD has been moving through the Weakening quadrant. In a standard cycle, we might expect it to continue into the Lagging zone.
However, the current “tail” (the path of the asset’s movement) has begun to curl back toward the Leading quadrant:
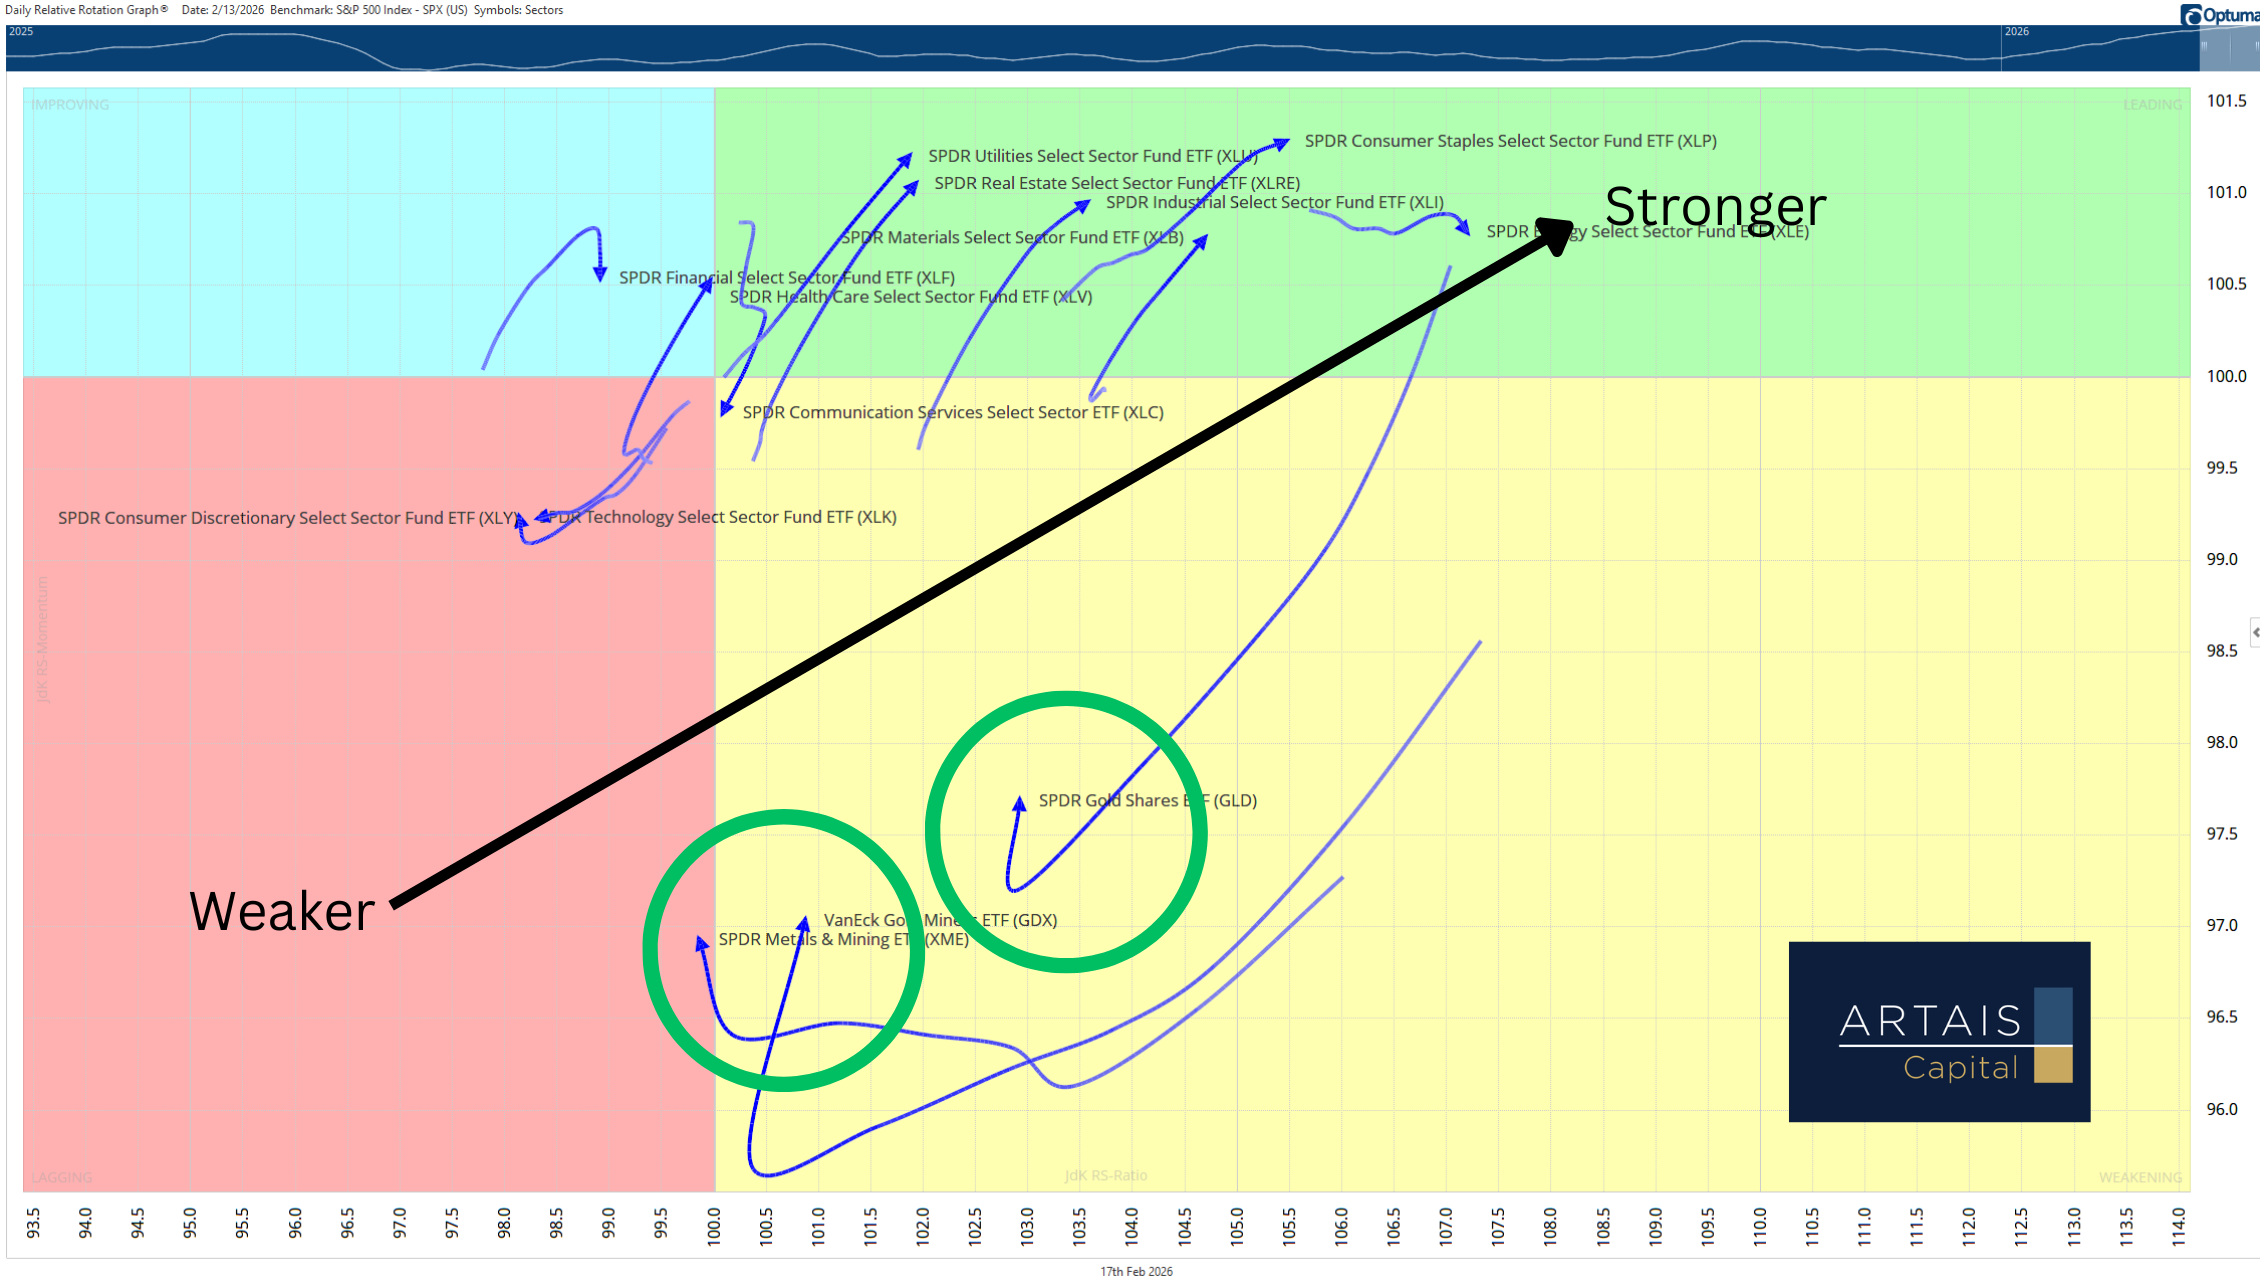
In technical analysis, this “hook” is interpreted as a higher low in relative momentum.
This suggests that while Gold’s outperformance slowed down, it did not drop below the benchmark’s performance before momentum began to pick up again.
Why this is monitored:
Trend Persistence: It indicates the primary uptrend in relative strength may be resuming.
Momentum Shift: It suggests buyers are stepping in earlier than they did in previous cycles.
Balancing the Bullish View with Market Reality
While the “hook” toward the Leading quadrant is a constructive technical sign, investors must consider the risks:
Whipsaw Risk: Momentum indicators can produce “false starts” where a tail hooks upward only to reverse sharply if market conditions change (e.g., an unexpected shift in interest rate policy).
Benchmark Dependency: Because RRG is relative, Gold can look “strong” simply because the S&P 500 is exceptionally weak, even if Gold’s absolute price is flat or declining.
Volatility in Miners: While GDX and XME are showing similar momentum hooks, mining stocks carry significantly higher idiosyncratic risk and volatility than physical gold or GLD.
Historical Correlation and the S&P 500
The current RRG setup for Gold represents a high-interest inflection point for technical traders. The refusal to enter the Lagging quadrant demonstrates significant resilience in the current environment.
While we do not hold precious metals in our equity strategy at ARTAIS Capital, the strength in this category cannot be ignored, as it can have an impact on other sectors within the S&P 500:
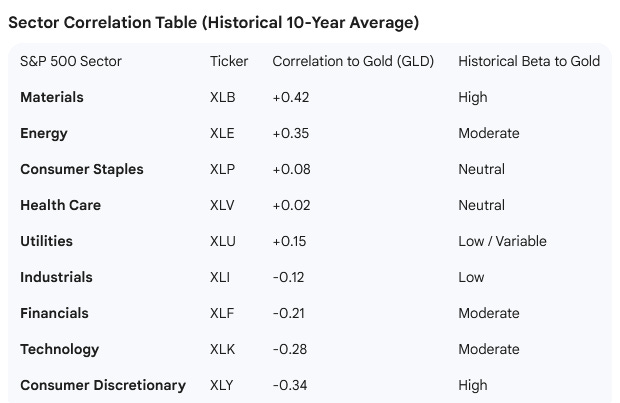
Source: Bloomberg, S&P Dow Jones Indices, and State Street Global Advisors, ARTAIS Capital
Conclusion: The Strategic Signal in the Golden Hook
At ARTAIS Capital, our rules-based approach isn’t just about what we own, but what the broader market is signaling.
The “hook” we are currently observing in GLD is more than just a technical curiosity; it’s a reflection of shifting capital flows.
Historically, when gold exhibits this level of relative resilience, it often acts as a precursor to broader sector rotations, specifically benefiting the Materials and Energy sectors while acting as a potential headwind for more rate-sensitive areas like Technology.