


The US stock market is nearing an inflection point. In previous research notes, I have argued that investors are waiting on the results of three key catalysts:
Tech earnings. Starting this week, major tech companies begin reporting earnings. Investors will watch closely to see whether AI growth continues to accelerate.
The Federal Open Market Committee (FOMC) meets October 27-28. Investors, especially bond investors, are worried about inflation and believe the Fed may be making a policy mistake by not raising rates.
The midterm elections. As I have discussed numerous times, the fourth quarter of a midterm year and the following year have historically been a very good time to own equities. However, it is understandable if investors are worried about future ramifications, considering the current political environment.
As we near the answers to these questions, short-term trends are about to affect longer-term trends in numerous sectors.
Current Sector Rotation
Momentum and relative strength continue to improve in the majority of the sectors within the S&P 500 index, with the exception of technology:
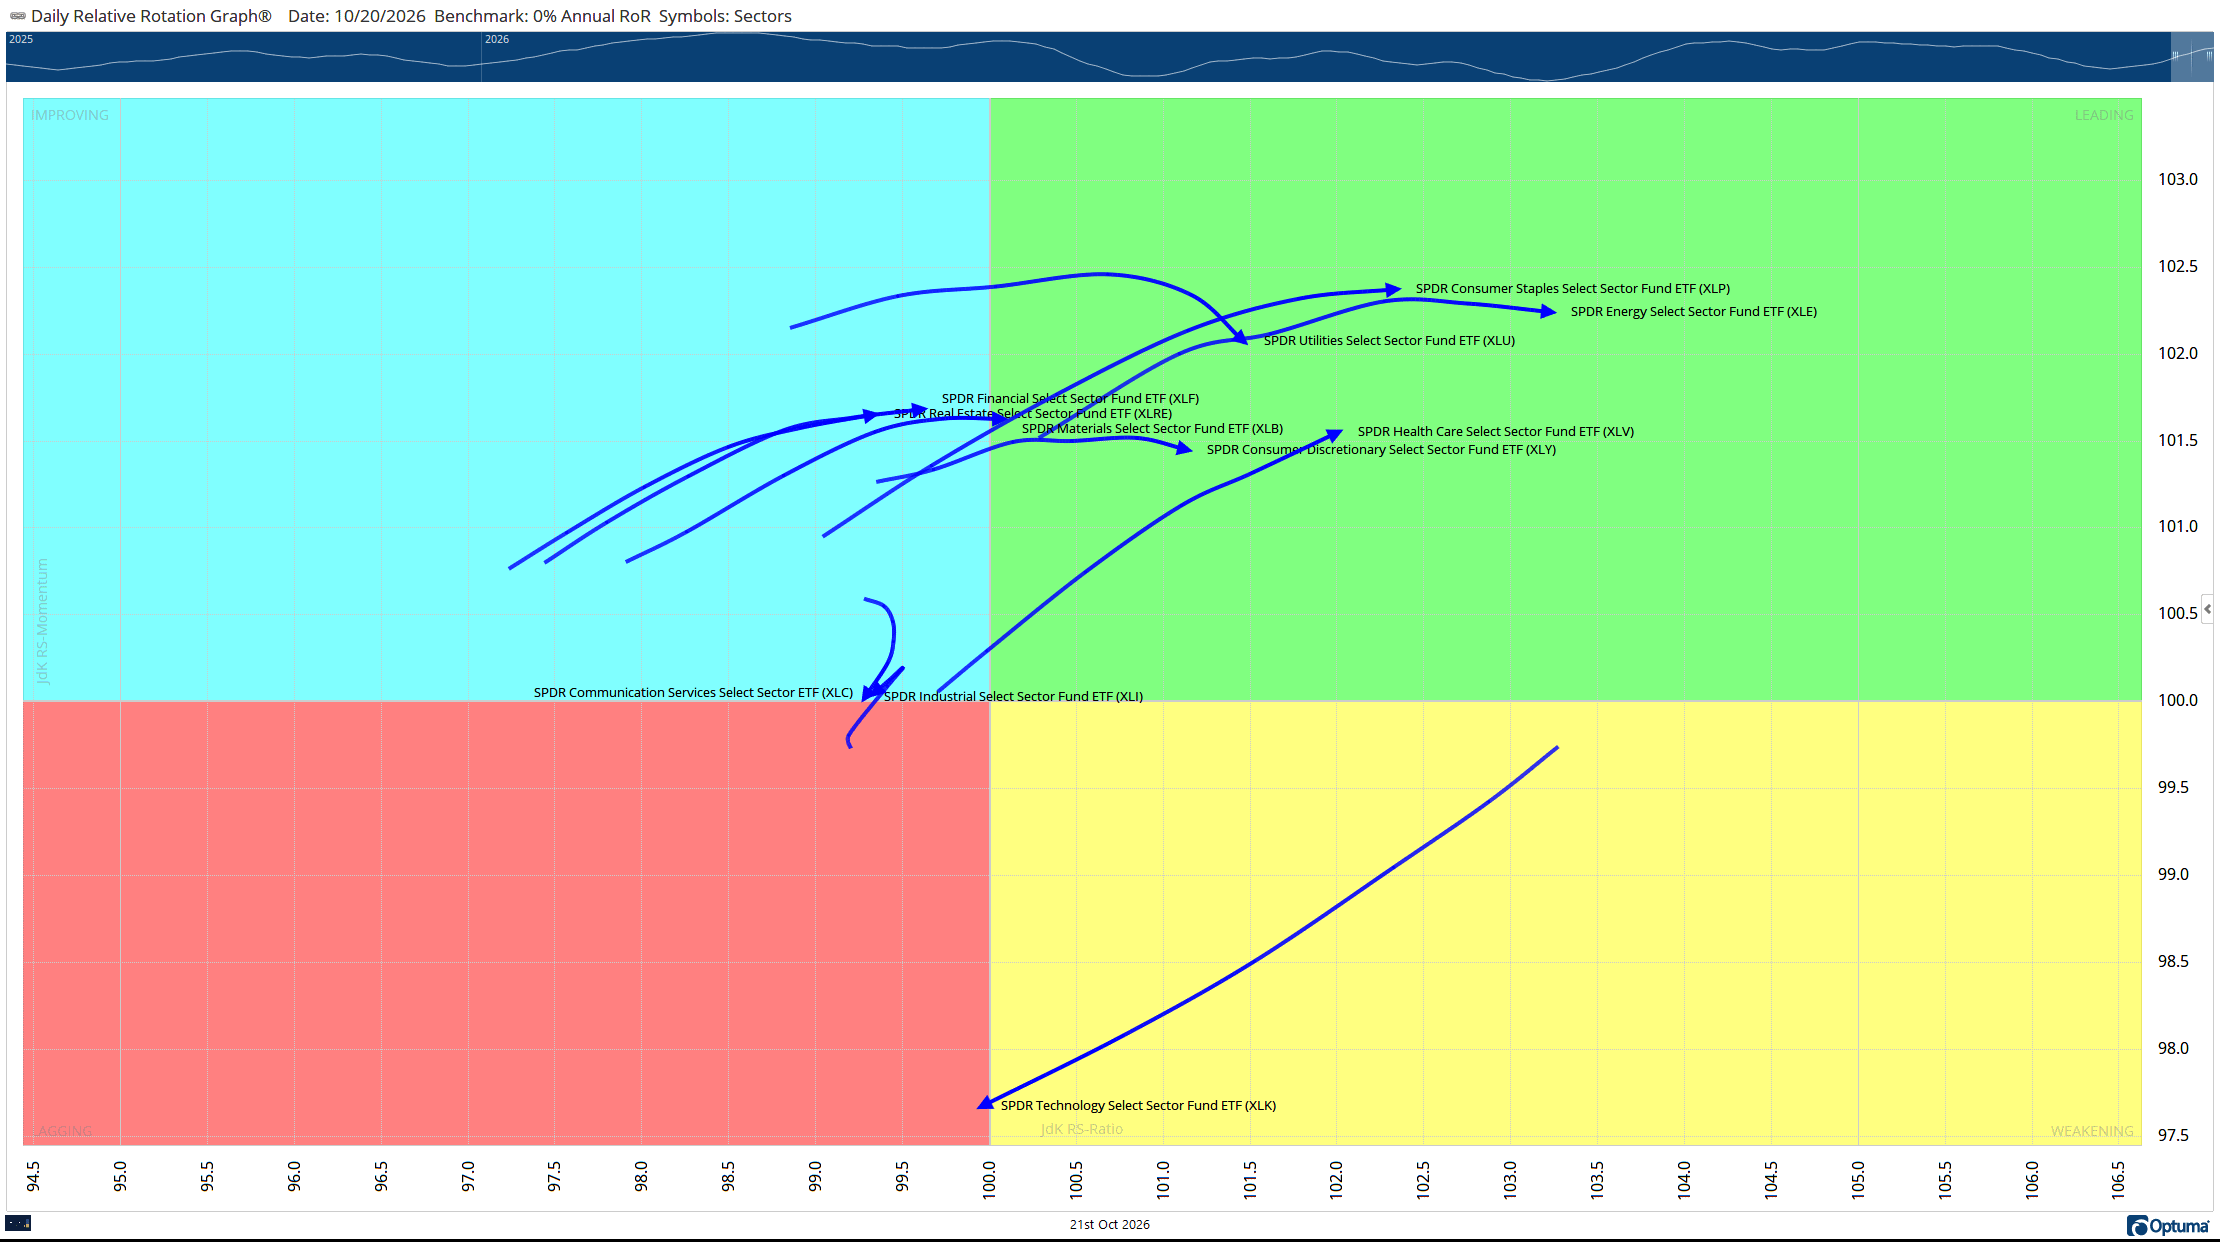
This trend has been in place since the start of October, as the daily rotation below shows:
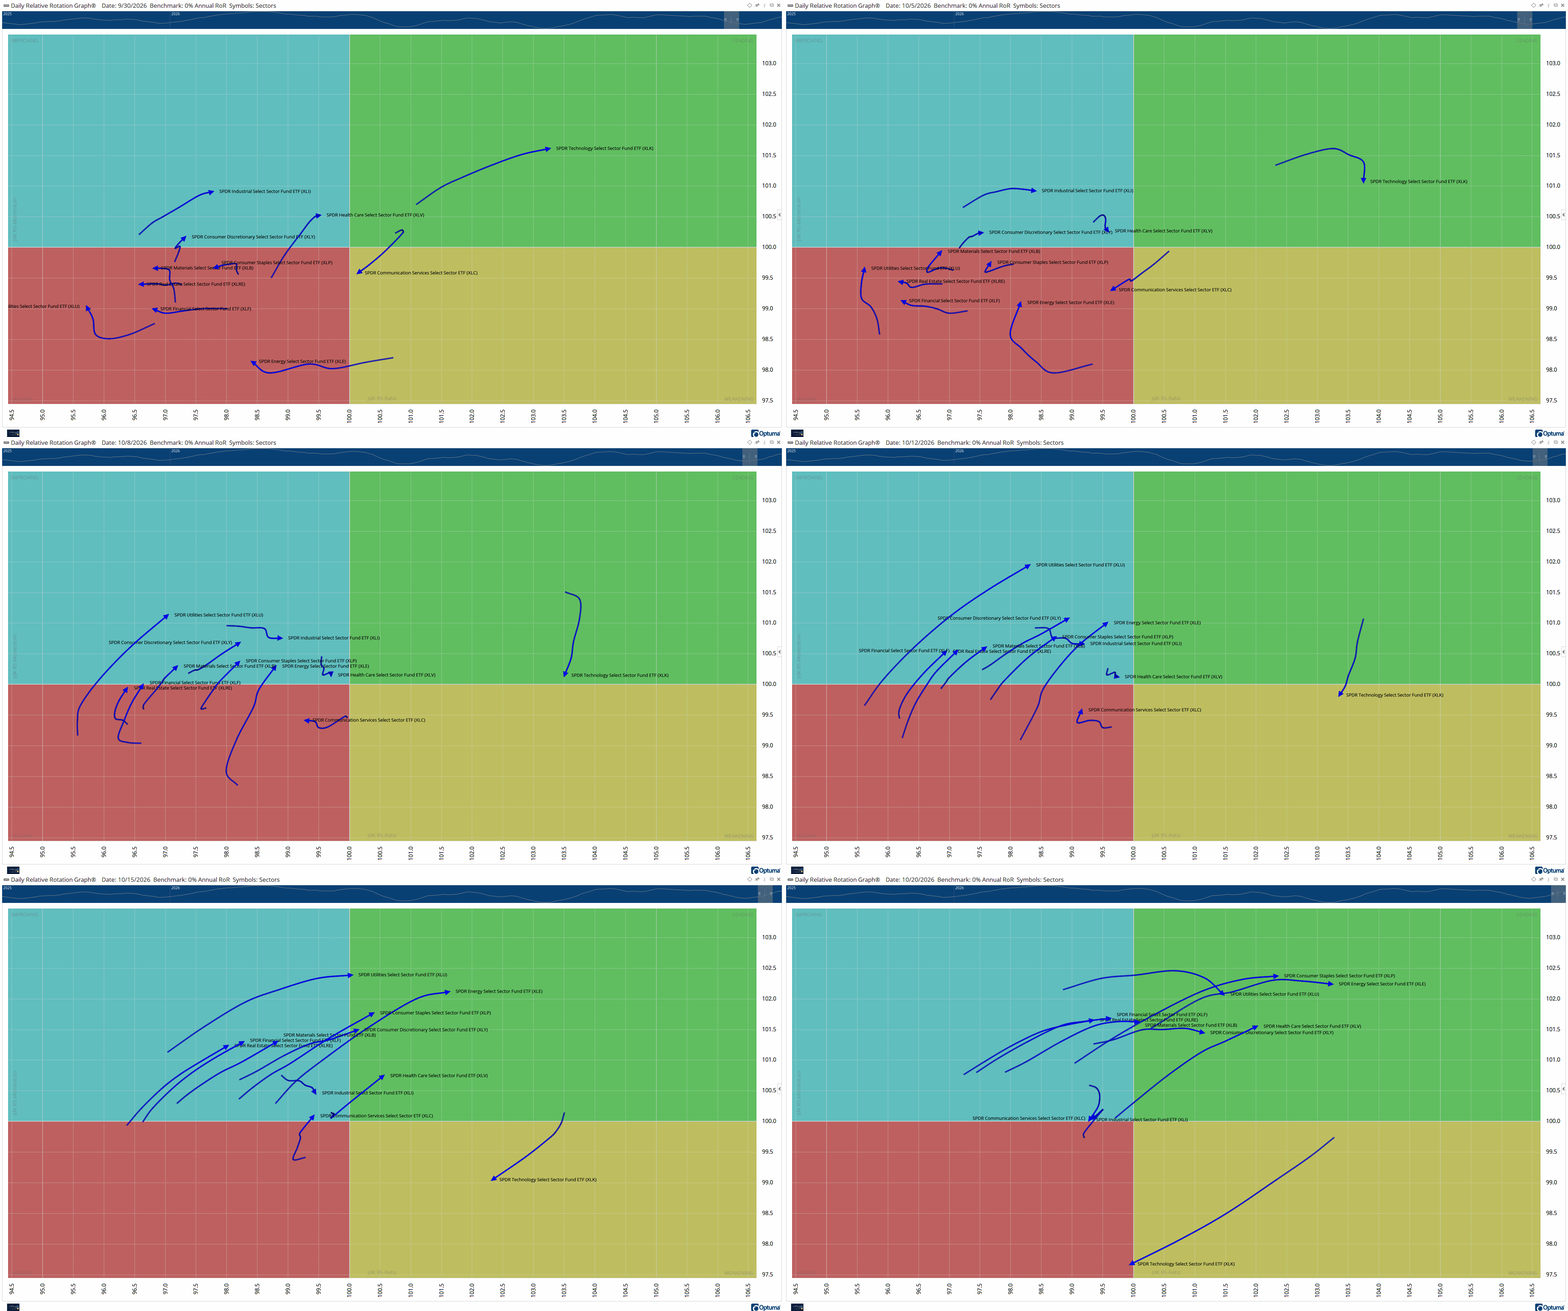
But it is the strength of this rotation that is leading us to an inflection point in the market.
The technology sector has the largest weighting within the S&P 500:
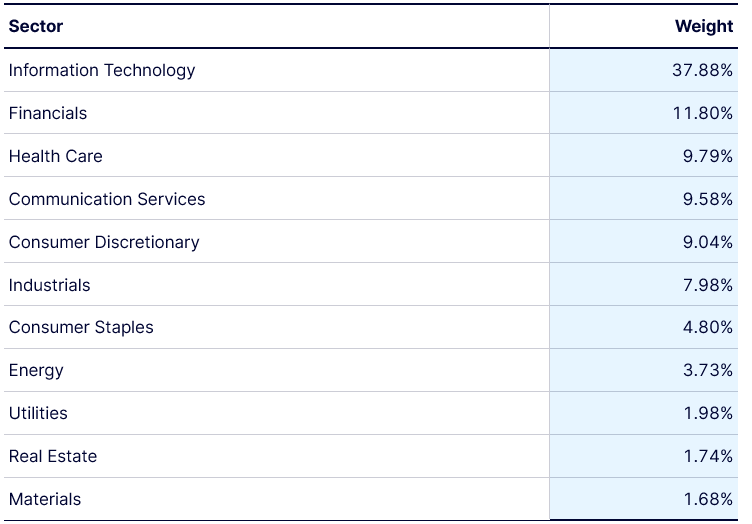
As of 10/20/26, Source: State Street
As history has taught us, the market will rebalance these weightings at some point.
In 2000, the technology sectors made up approximately 35% of the index. By the end of 2010, it was 18%.
During the period from 12/31/1999 to 12/31/2010 period, the S&P 500 Index declined 14%:
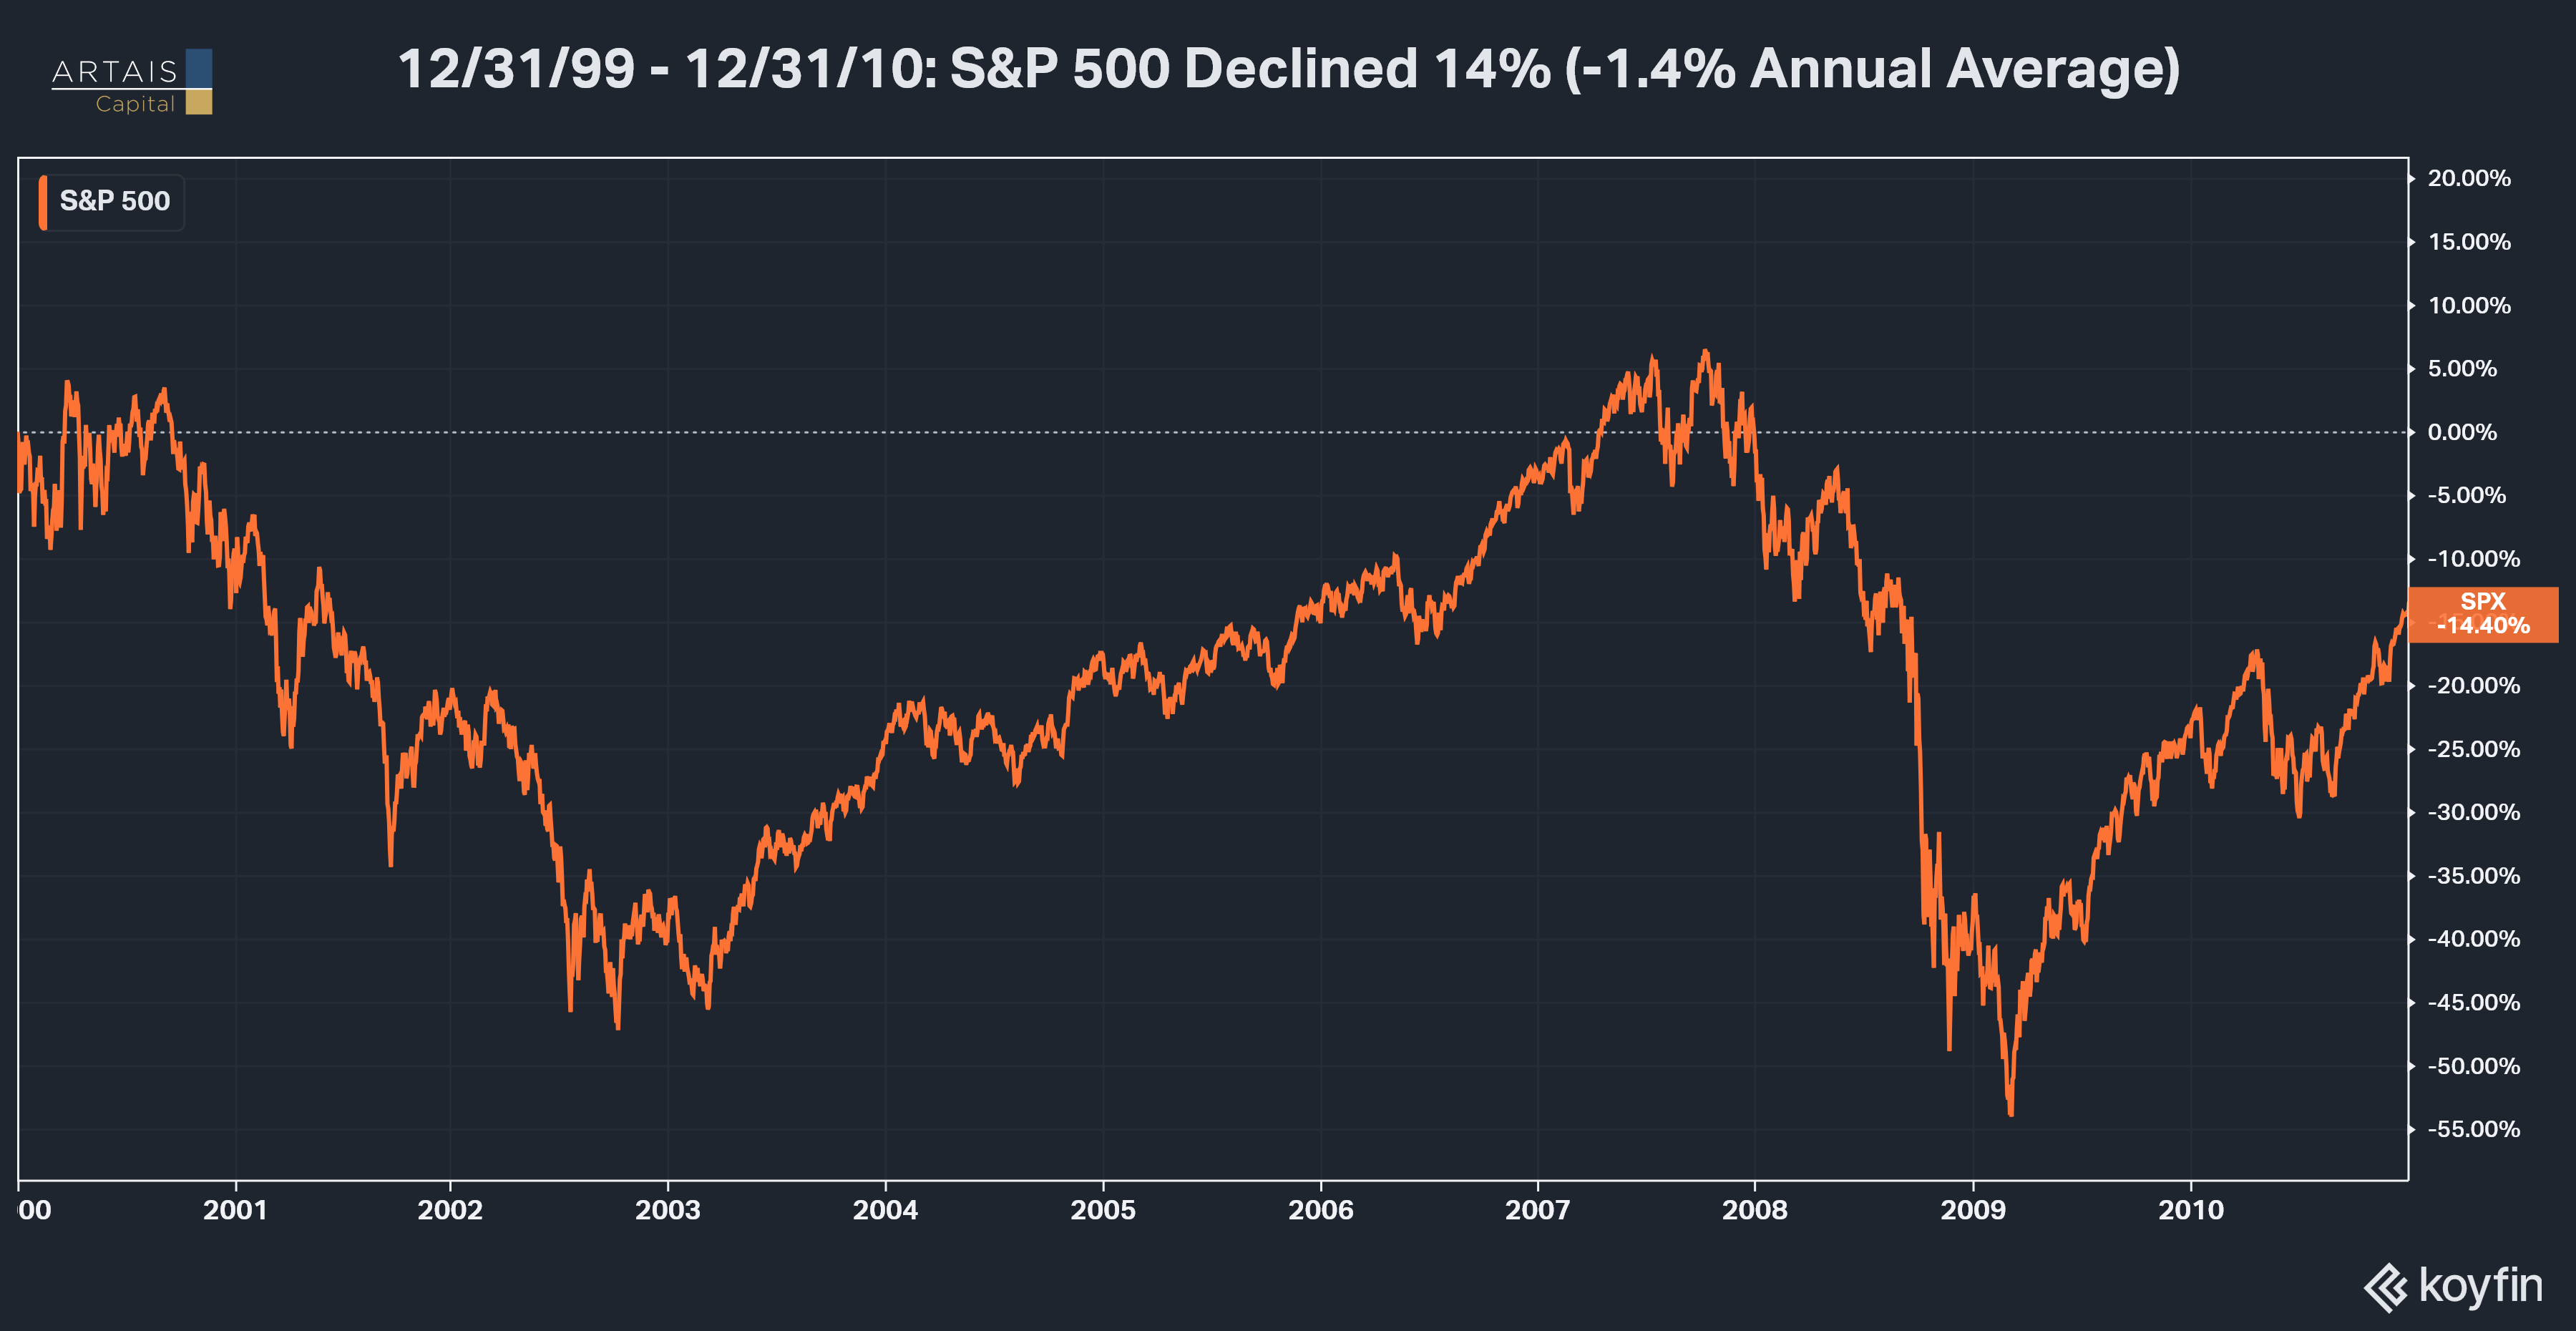
This is why it is important to watch how short-term trends can affect the bigger picture.
What about AI?
That’s the interesting part: whether this rotation becomes a longer-term move out of tech.
AI growth needs more than just tech. Data center build-out and infrastructure will positively impact non-tech sectors like Industrials, Materials, Utilities, etc.
We may be seeing the start of a long-term trend that favors areas that have been mostly ignored in the AI cycle, as evidenced by the low weightings of these sectors within the index.
Investors should be aware that, at some point, we could see an economic boom in non-tech sectors while the S&P 500 delivers years of poor returns as the index rebalances, similar to 2000–2010.
Short vs Long Term Trends
For this comparison, I am identifying short-term trends as days to weeks, while the longer-term trends are weeks to months.
Below, I am going to walk through what I am seeing in the 11 sectors that make up the S&P 500 Index. To keep it simple, they will be organized alphabetically.
Longer-term bull/bear trends are identified by whether the index is trading above the Ichimoku Cloud.
I will only be focusing on the daily trends, but here are both the daily and weekly trends:
For Paid Readers:
Which sectors are trading a key levels and what to watch for next
Why now it is so important to pay attention to the rotation
The results of the AI Universe stock screen