

The Week Ahead
Last week, the S&P 500 index dropped more than 2%, and the Nasdaq 4.8%, as AI and semiconductor worries, plus poor inflation data, pushed growth stocks lower.
This week, I am keeping a close eye on the data points below:
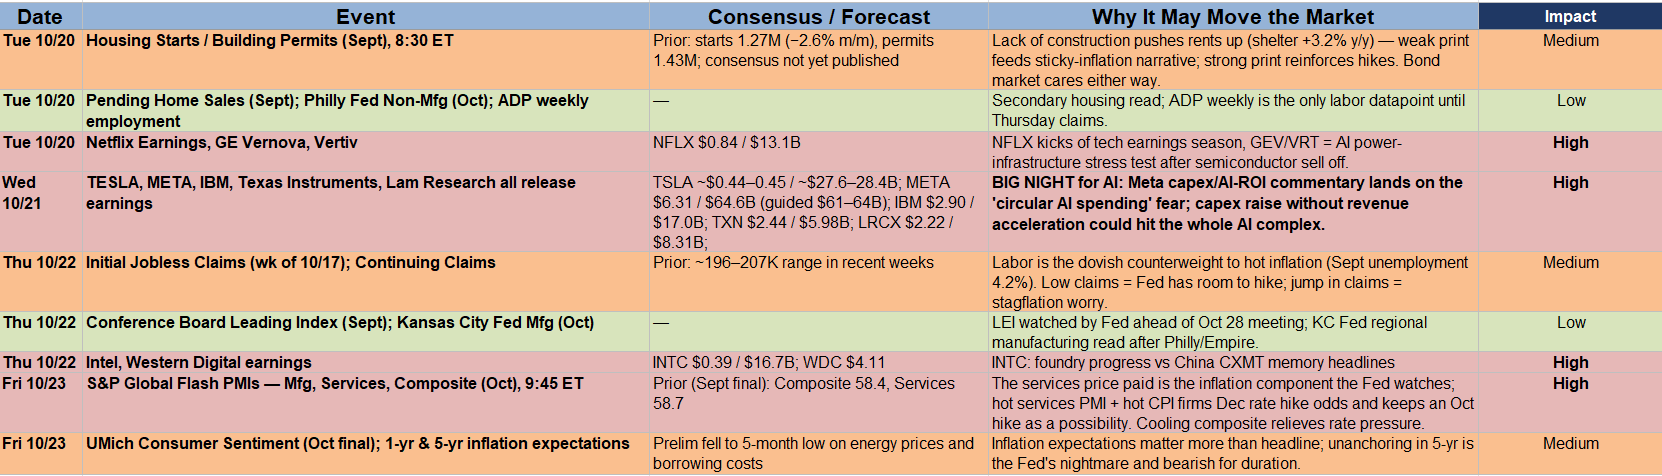
The stock market is nearing an inflection point as we are about to get a resolution to one of the three catalysts that I have been talking about.
I am watching several key levels and relationships for insight into where opportunities may be and how market participants are allocating capital in the short and long term.
Charts, Key Levels, and Catalysts to Watch This Week:
While the S&P 500 index declined last week, market breadth improved as more stocks rose above their 50- and 200-day moving averages:
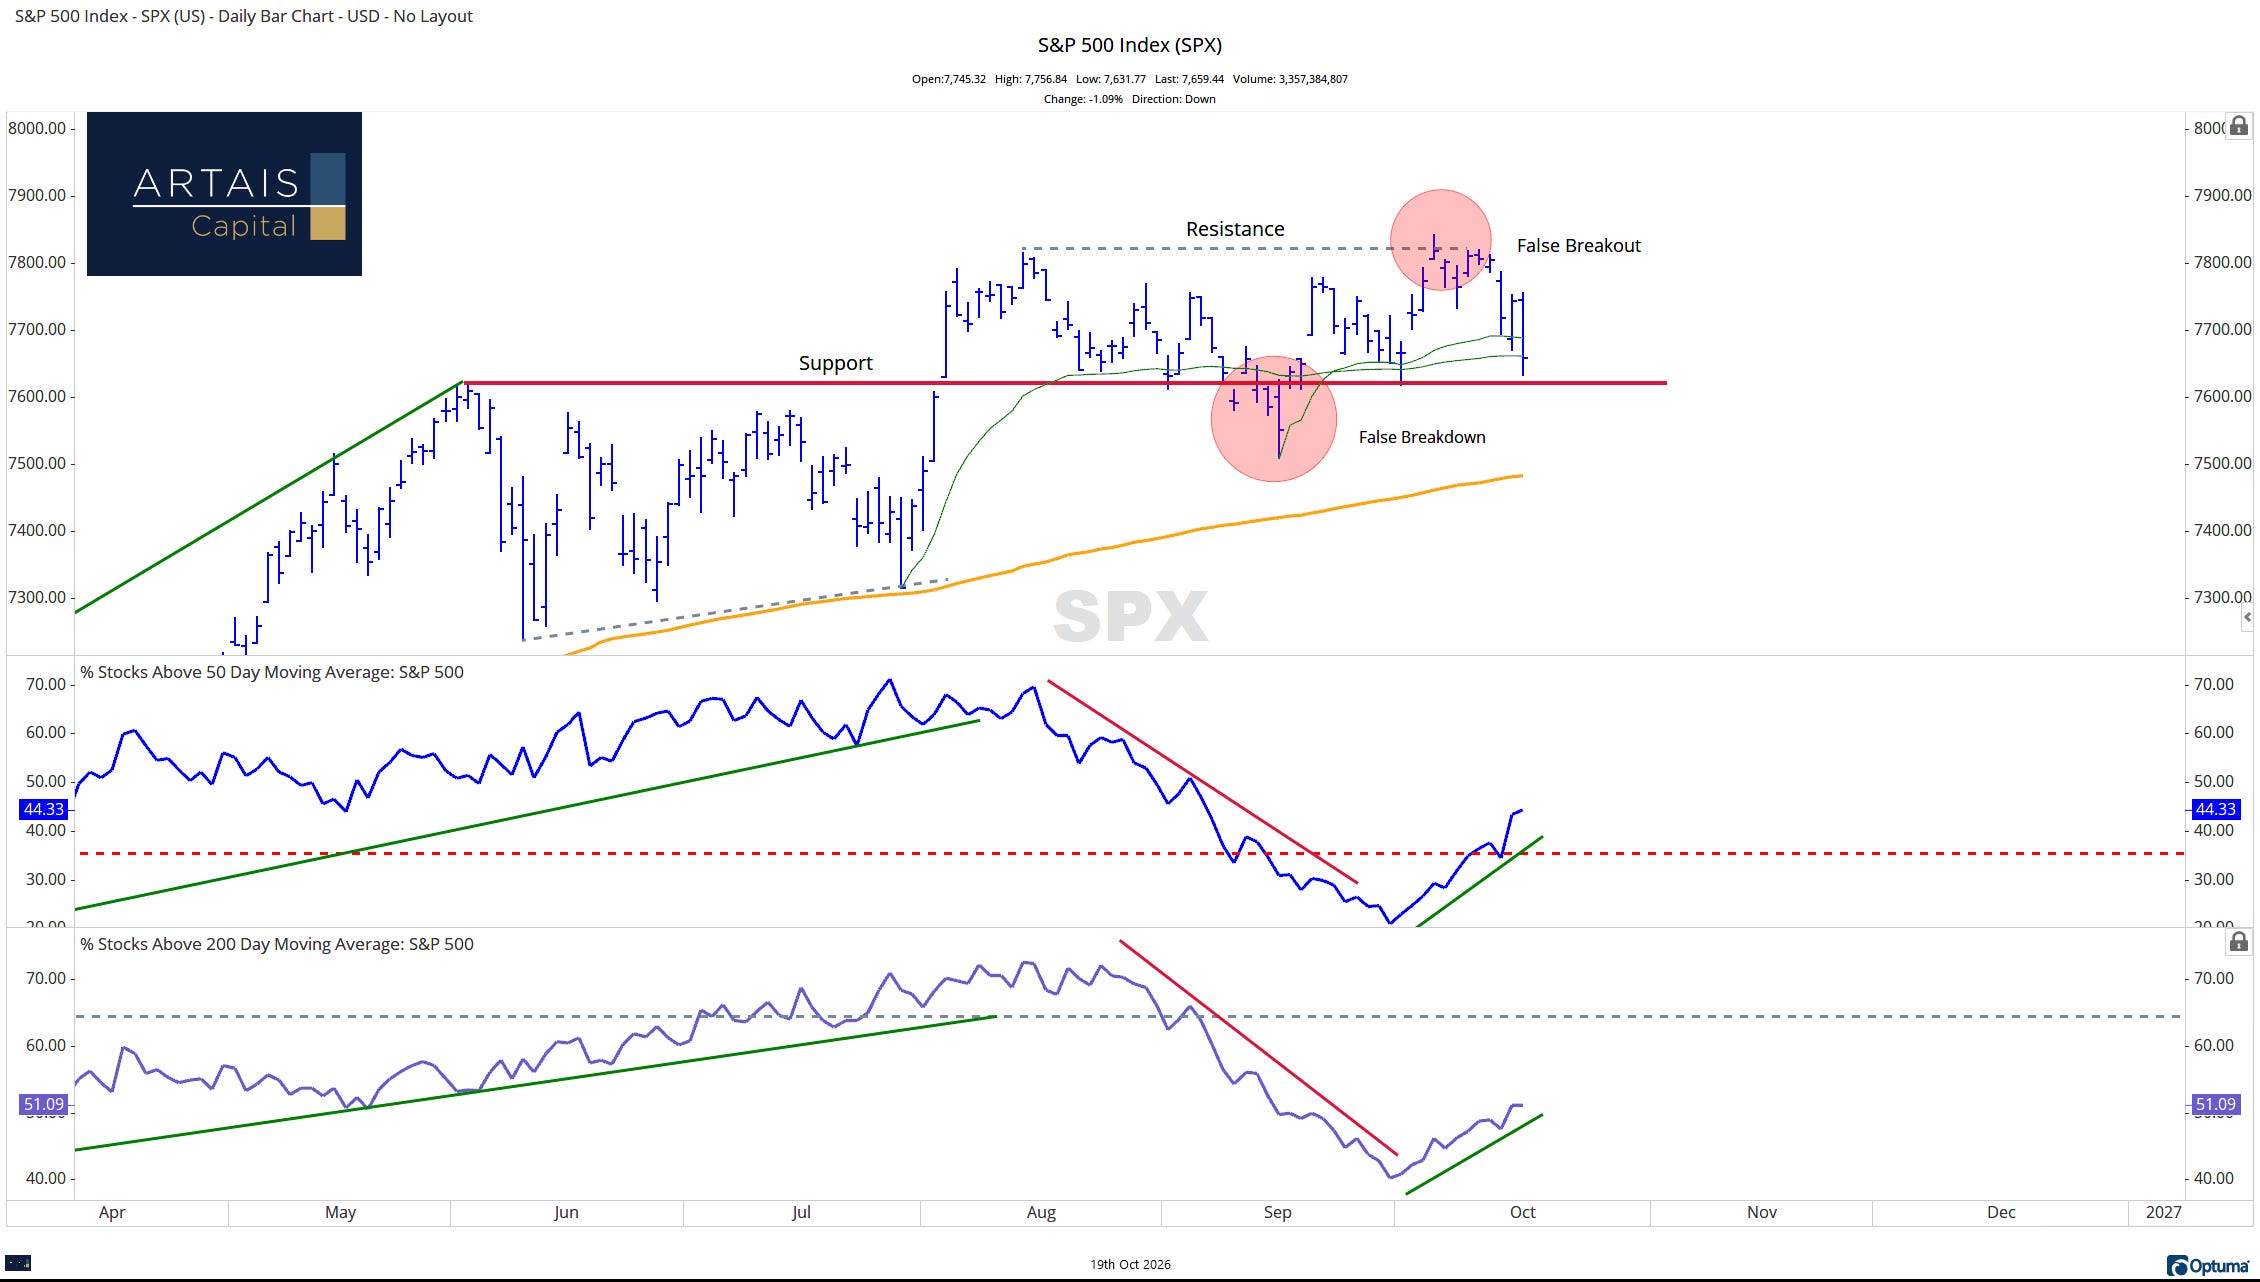
Breadth is improving while the cap-weighted S&P 500 declines because money is rotating out of growth stocks, like tech, and into value and low-volatility sectors.
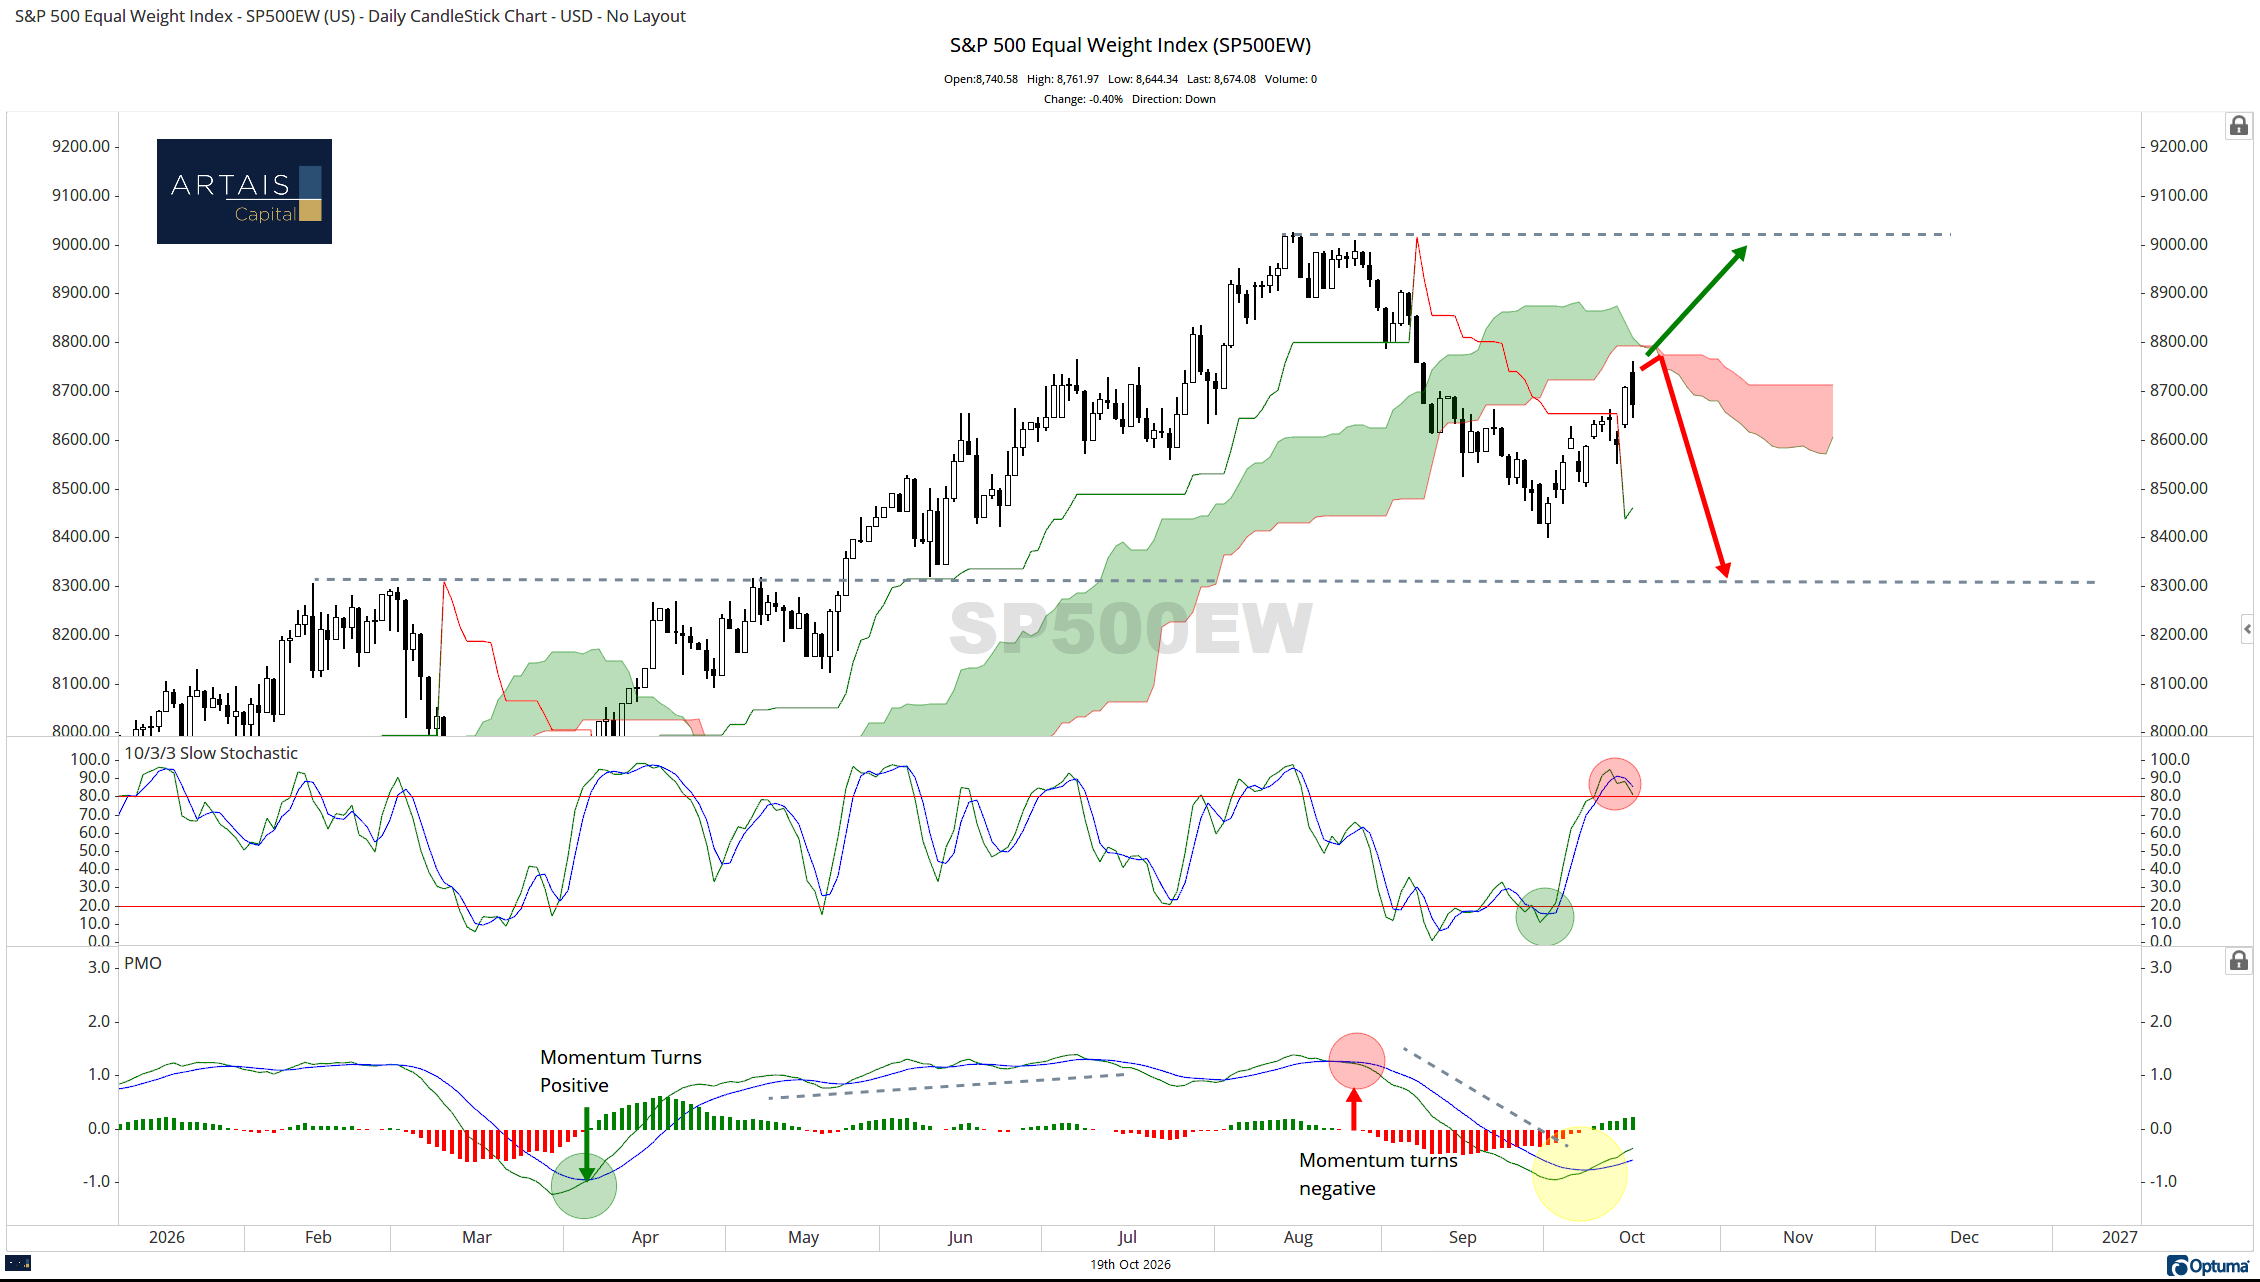
This is why the S&P 500, which is a market-cap-weighted index (the larger the company, the larger its weighting), declined last week, while the equal-weight version rose.
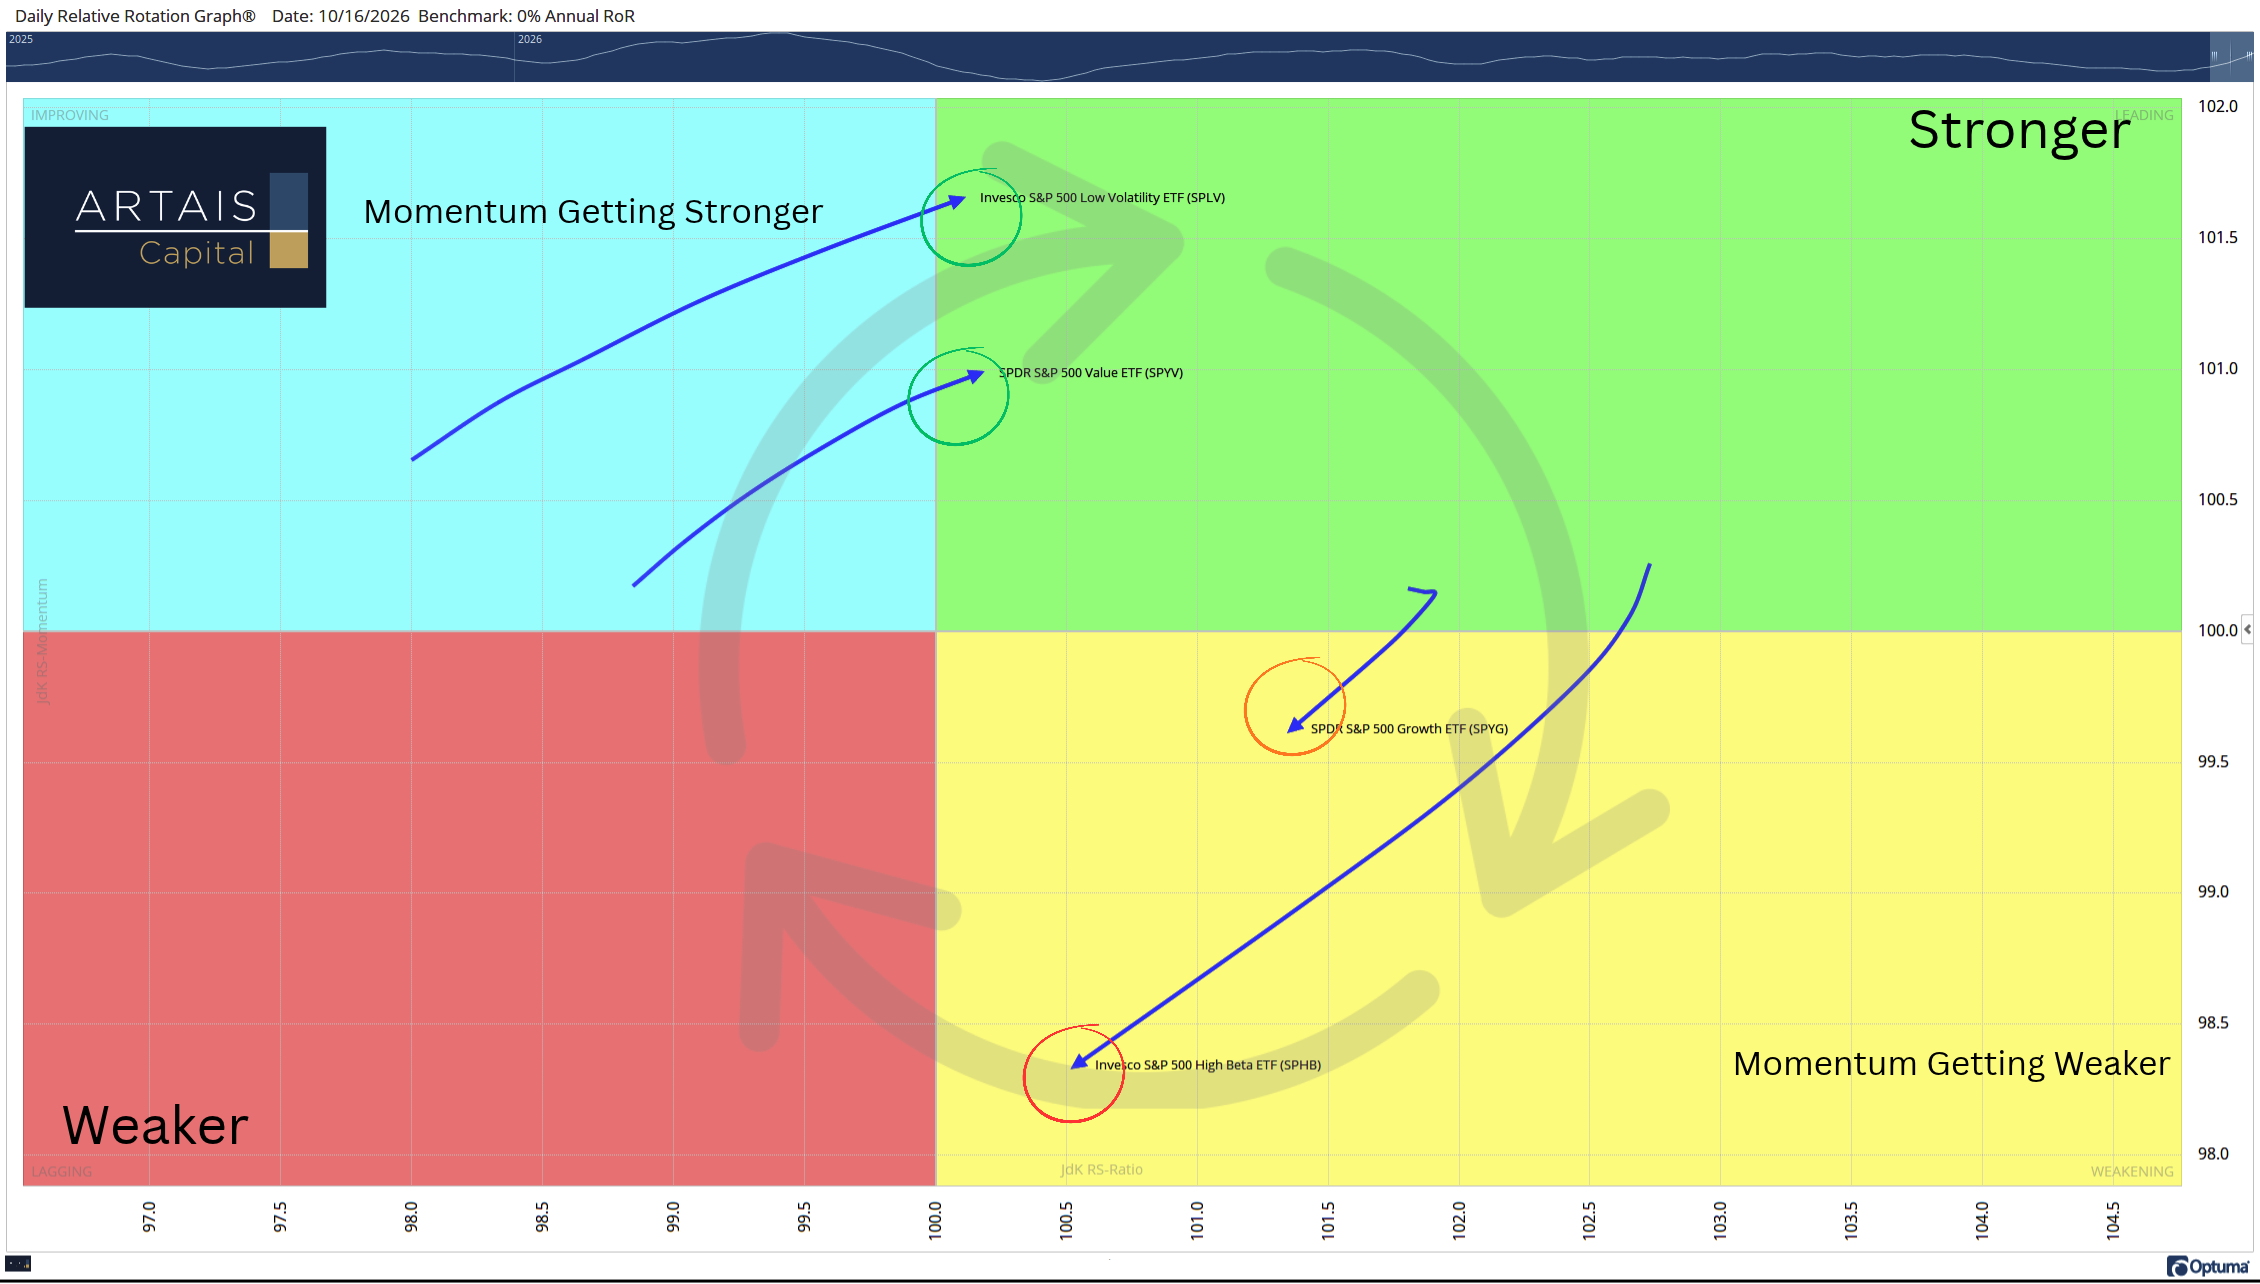
Money isn’t leaving the stock market; it is being reallocated. Whether this is a short- or long-term reallocation has yet to be determined:
Since the start of October, low-volatility and value names have seen momentum and relative strength improve, at the expense of high-beta and growth names:
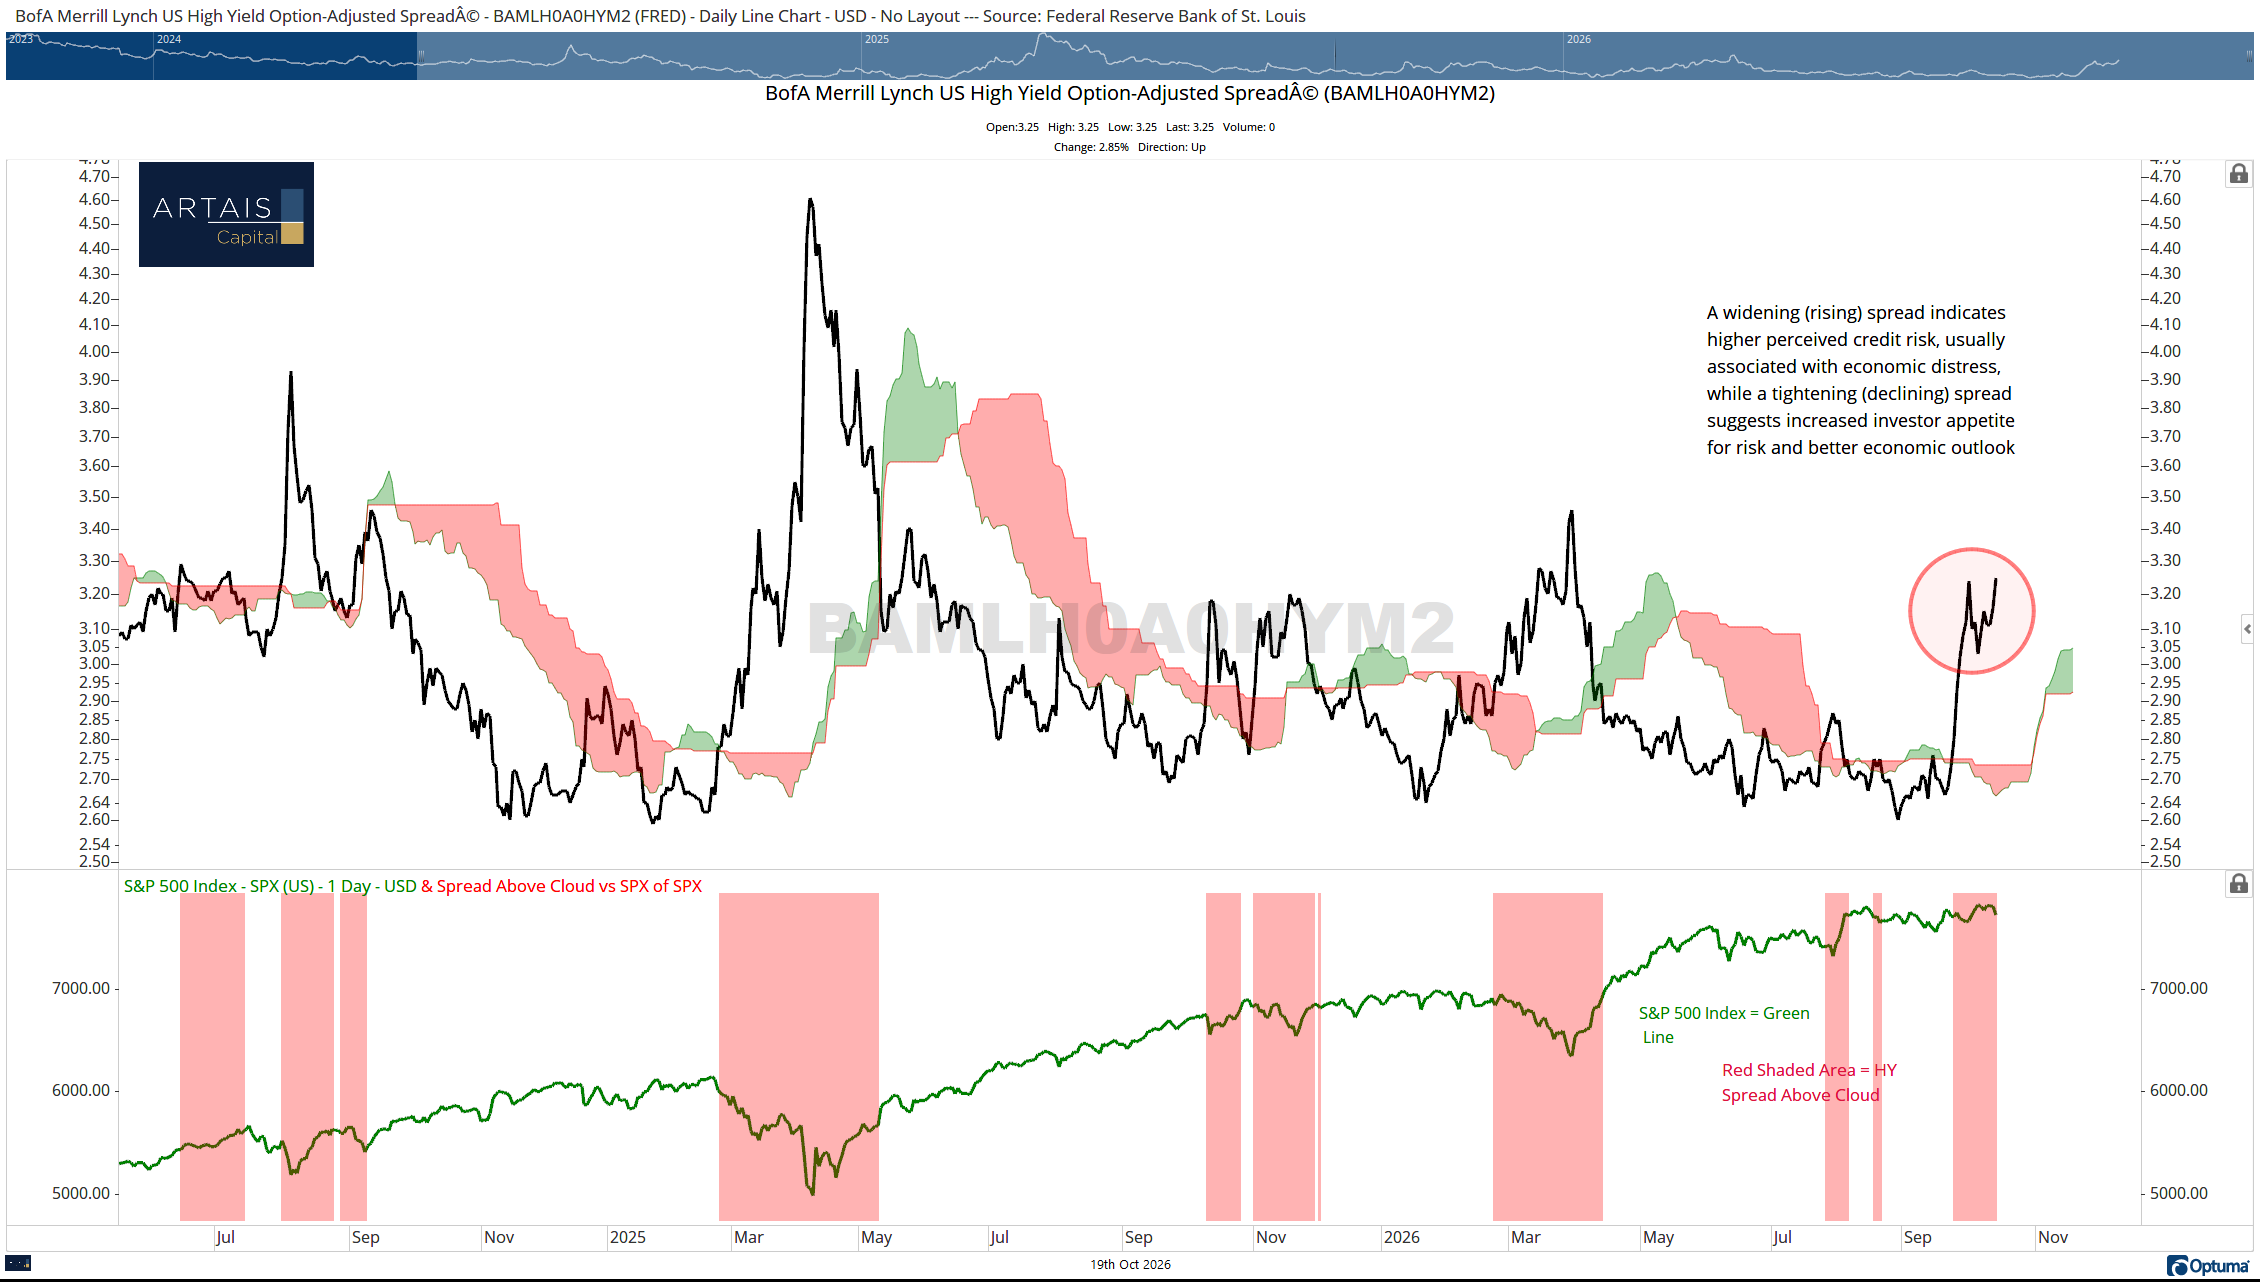
In addition, the bond market is still signaling that investors are not happy with how the Fed is handling inflation. High-yield bond spreads are widening, and the stock market is finally starting to pay attention as investors reduce risk:
I have been watching three key catalysts that may drive the market higher or lower during the 4th quarter:
Tech earnings. Starting this week, major tech companies begin reporting earnings. Investors will watch closely to see whether AI growth continues to accelerate.
The Federal Open Market Committee (FOMC) meets October 27-28. Investors, especially bond investors, are worried about inflation and believe the Fed may be making a policy mistake by not raising rates.
The midterm elections. As I have discussed numerous times, the fourth quarter of a midterm year and the following year have historically been a very good time to own equities. However, it is understandable if investors are worried about future ramifications, considering the current political environment.
This week, as tech earnings season begins, we will start to get a better idea of how the first of these catalysts plays out.
A key area to watch will be how investors feel about semiconductor stocks. Will they find value at these levels, as they have in the past, or do they believe a repricing needs to happen first?
Watch Semiconductor Stocks This Week:
The SOXX ETF, which tracks the NYSE Semiconductor Index, is trading near a level where buyers have found value in the past:
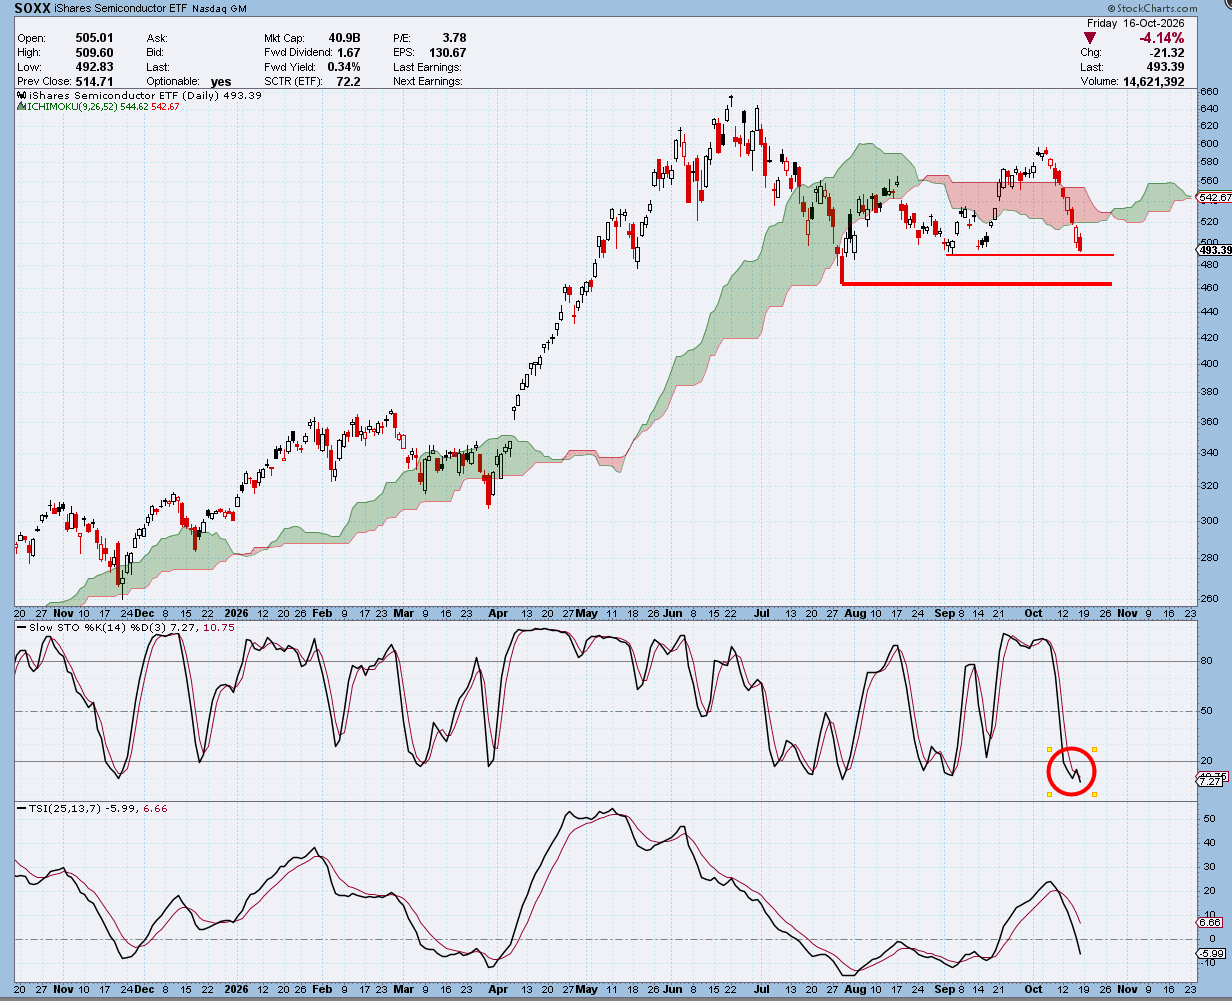
Earnings from tech companies this week may start to give us a better idea of whether investors still see value at these levels or believe semiconductors are overvalued in the current economic and interest-rate environment.
There are early signs that investors may be looking for opportunities at these levels as the Bullish Percent Index for the tech-heavy NASDAQ 100 reversed up into a column of Xs:
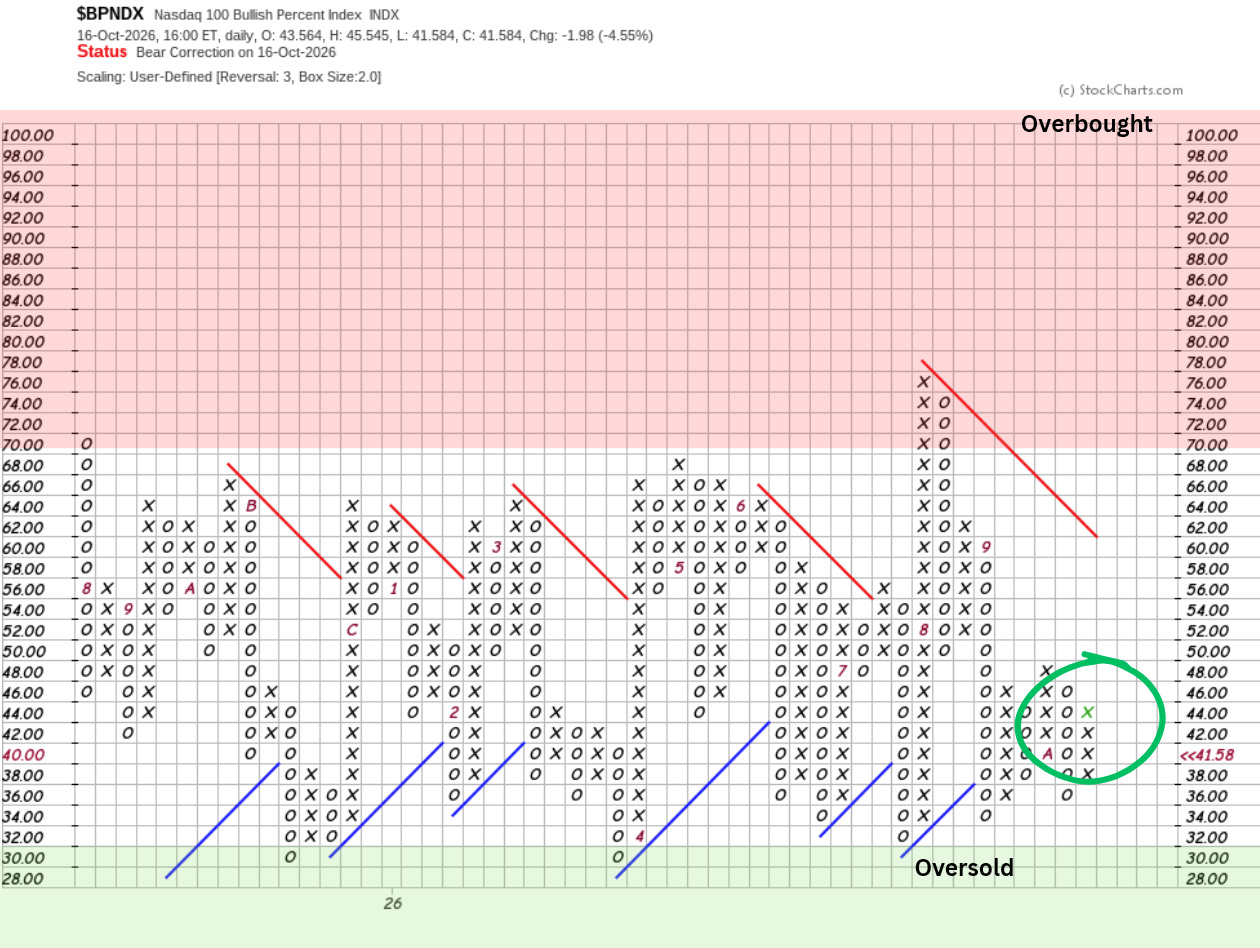
The Bullish Percent Index (BPI) is a market breadth indicator that measures the percentage of stocks within an index or sector (like the S&P 500 or NYSE) that are currently on Point-and-Figure buy signals.
Developed by Abe Cohen in the mid-1950s, the BPI ranges from 0% to 100%. Instead of just tracking the price of an index, it gives us a look under the hood at the internal strength or weakness of the market.
(Think of a column of Xs as the offense—buyers—on the field, and a column of Os as the defense—sellers.)
In addition, the hourly RRG chart shows improving momentum and relative strength in tech and semiconductor stocks:
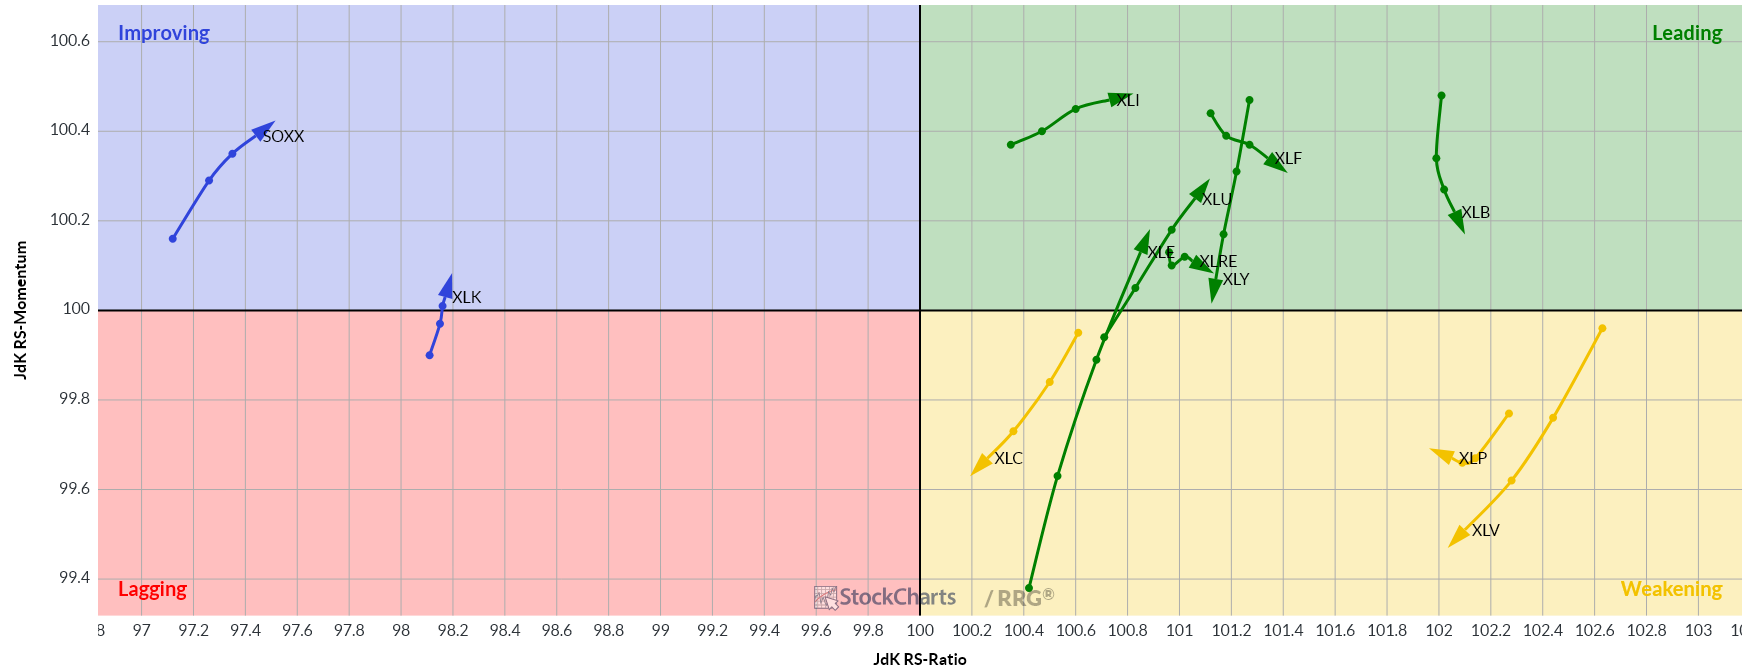
If this continues this week, it will be a good sign for tech investors.
But the market is also at an inflection point…
For paid subscribers:
The two charts that show both versions of the S&P 500 in the cloud model
The three scenarios I’m watching: rotation reverses, rotation becomes a new cycle, or both indexes break below the cloud
Where money may go if investors decide semiconductors are overvalued
Today’s ARTAIS Screen results and status, updated every trading day