
What Our Screen Is Telling Us About This Rally (Hint: Only 4% of Stocks Qualify)
The same process I use to manage client portfolios, applied to today's market.

At ARTAIS Capital, our main strategy is based on momentum. The stocks that we include in our universe are included because they have met a pre-defined screening criterion that focuses on long-term momentum.
From that pre-screened universe, the strategy screens for changes in medium and short-term momentum. A reversal from negative to positive momentum generates the buy “signal” - thus allowing us to focus on “buying low and selling high.”
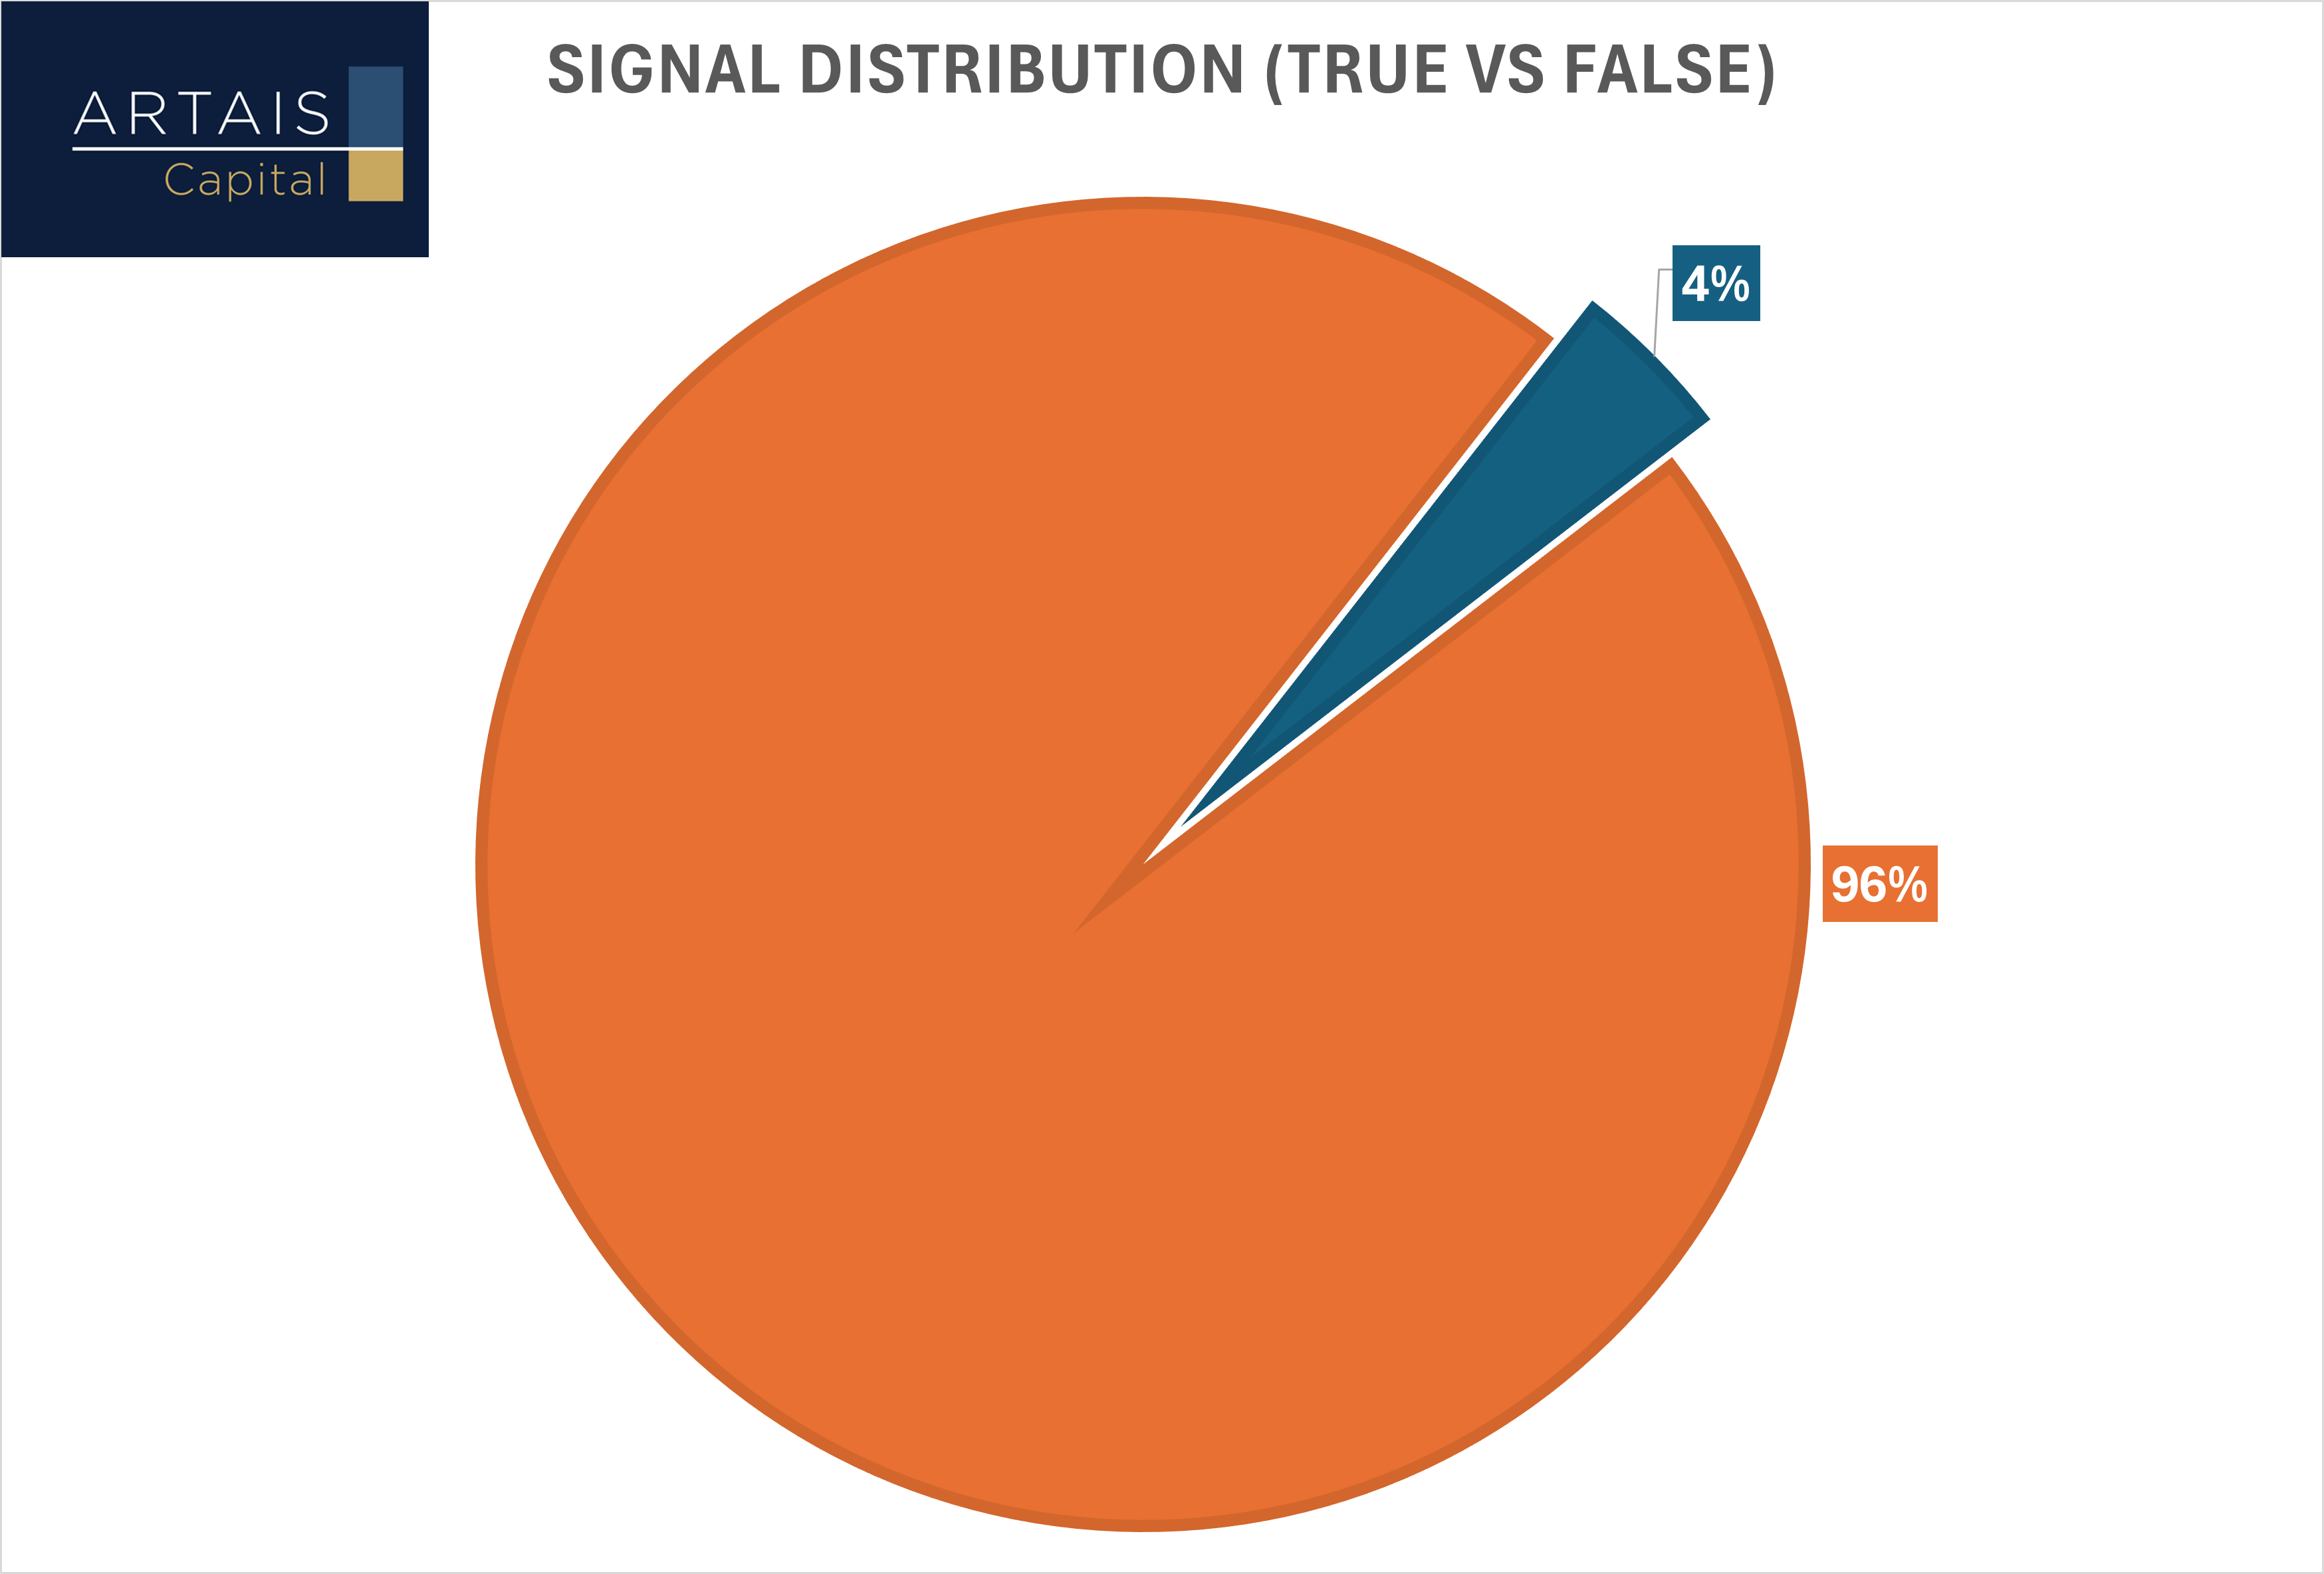
ARTAIS Buy Signals
Currently, the number of stocks that are showing a buy signal is deteriorating. In the past two weeks, I have seen the number drop while the S&P 500 continues to rise.
Within our ARTAIS universe, only 4% of stocks are on a buy signal.
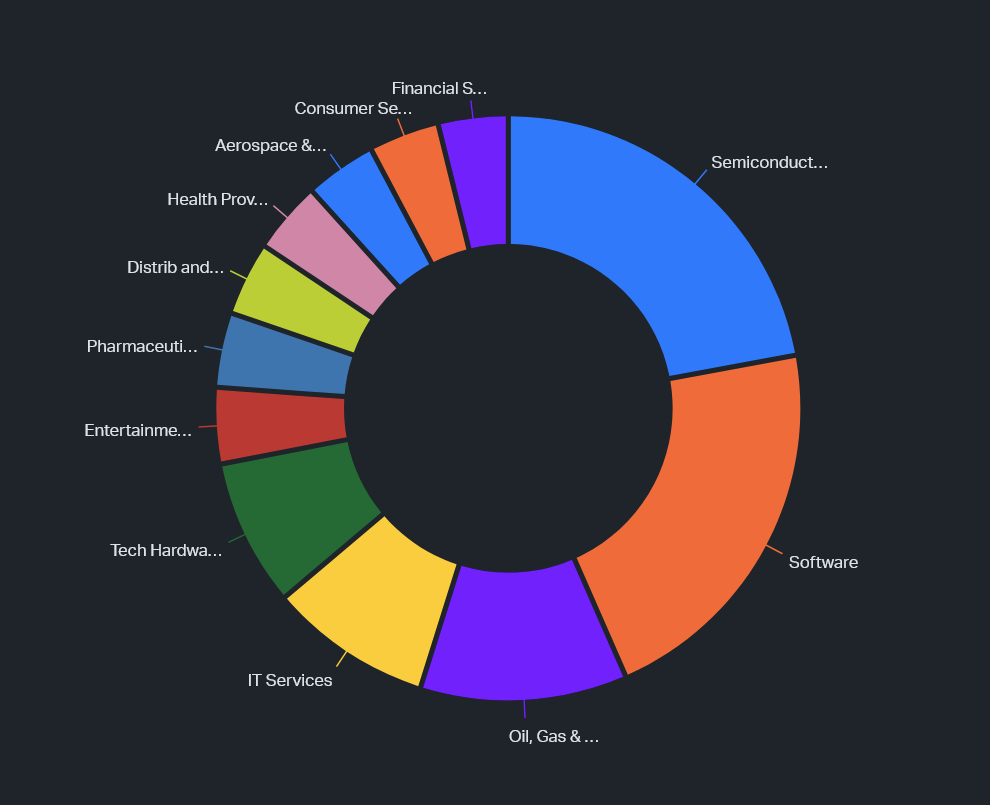
The 4% is skewed towards tech-related names:
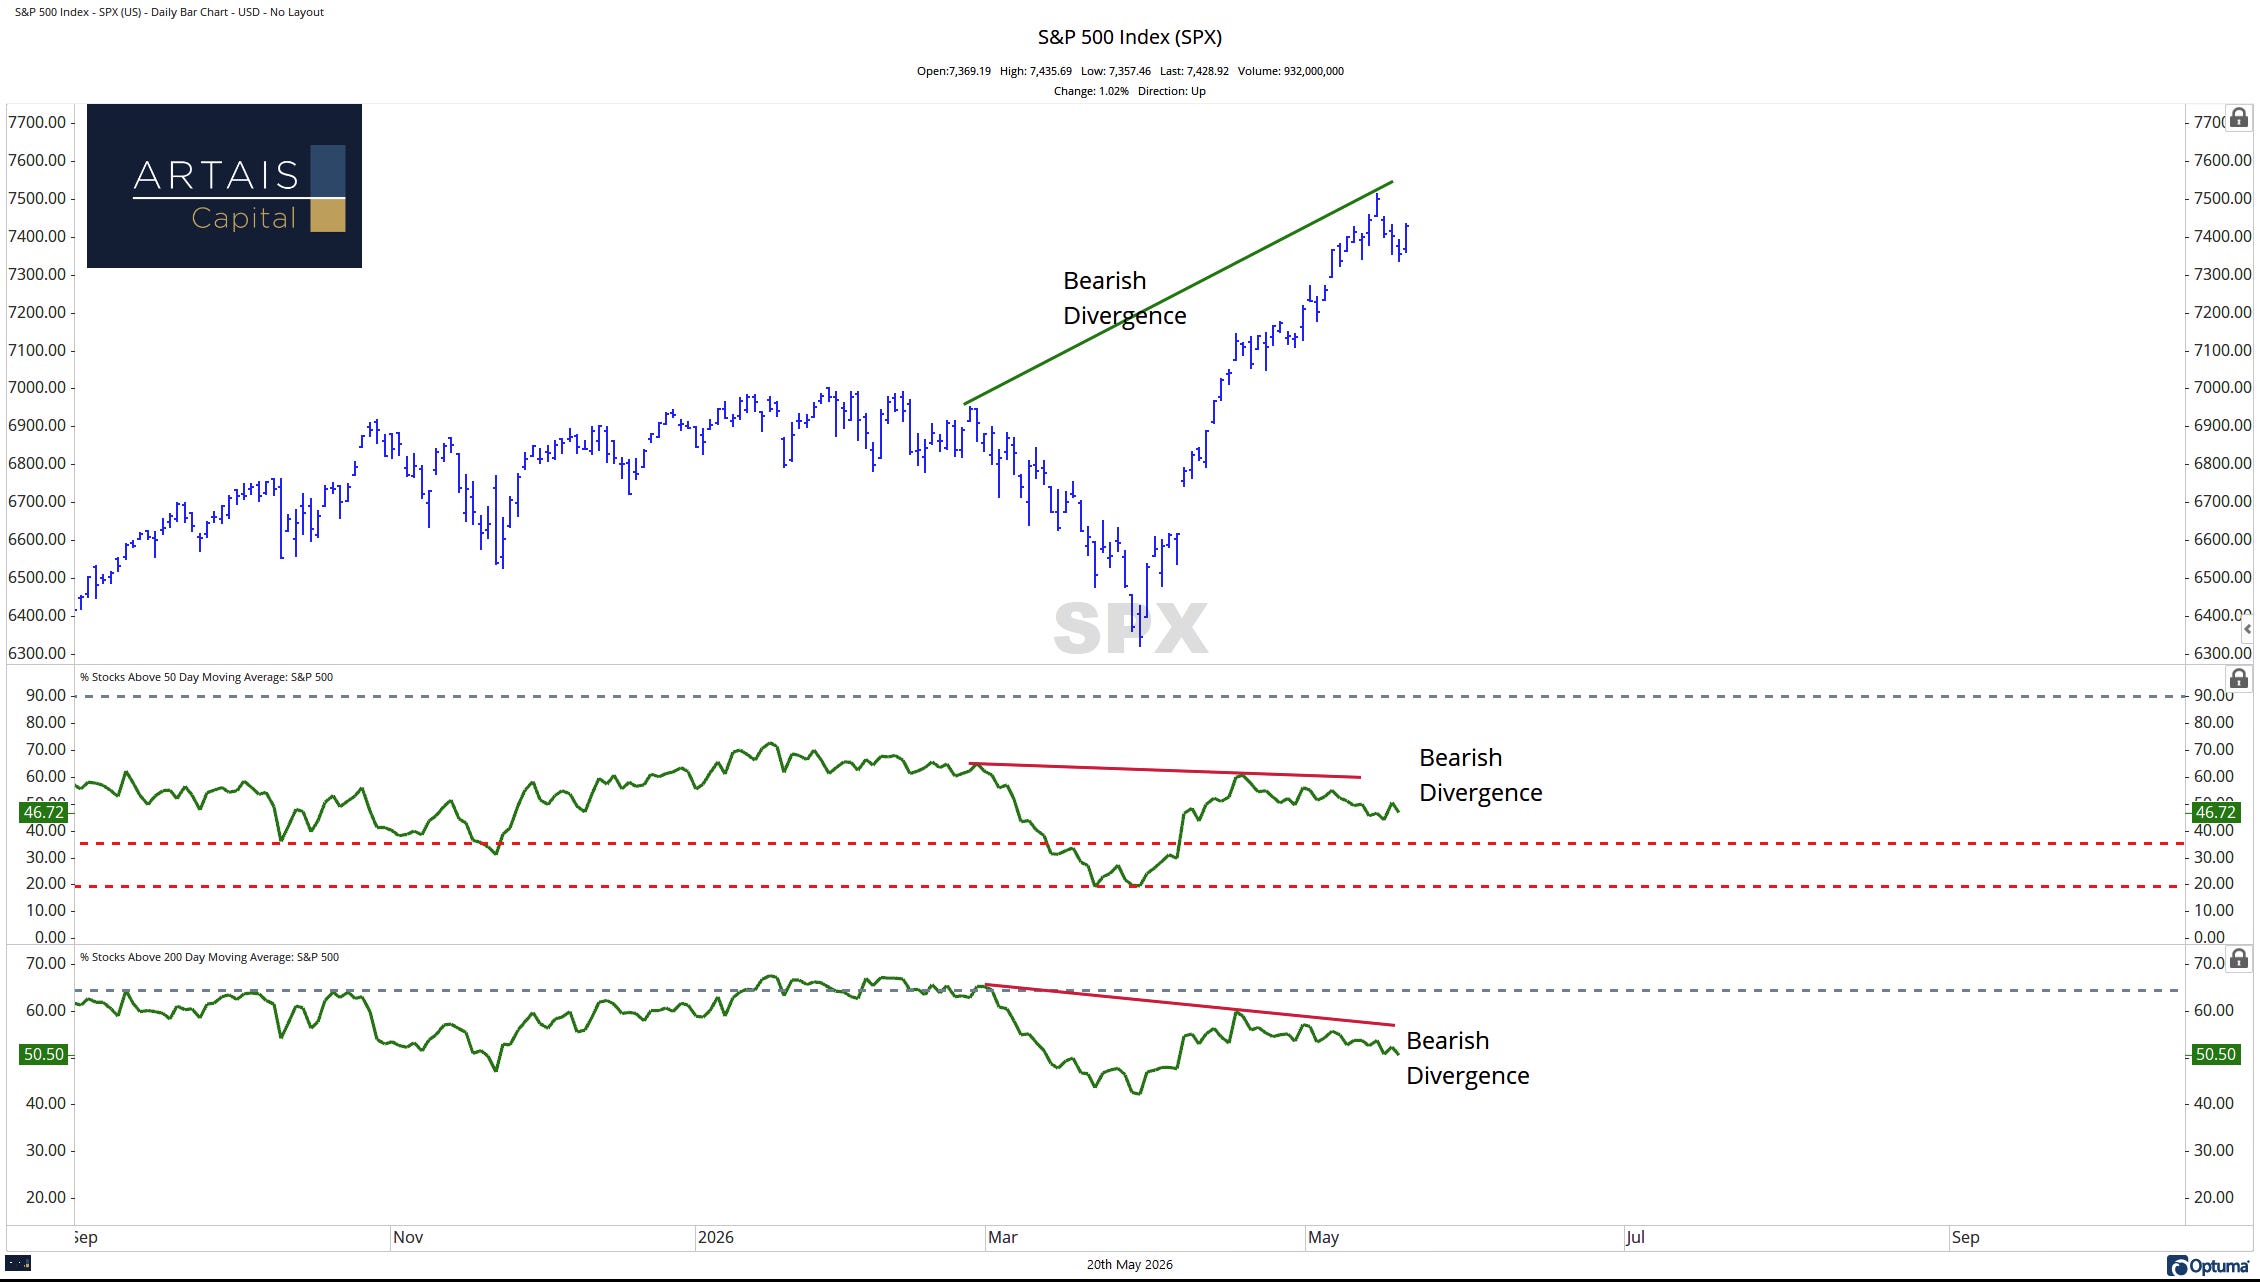
This trend in deterioration is confirmed by the weakening breadth of the S&P 500.
Bearish Divergence
Currently, the S&P 500 is showing a bearish divergence between price and the number of stocks above their respective 50-day and 200-day moving averages.
This trend is not what you would expect to see in a healthy, rising market.
Typically, I would expect to see more and more stocks rising above their 50 and 200-day moving averages as the broader market strengthens. When the opposite occurs, as it is now, it can become the canary in the coal mine for the market.
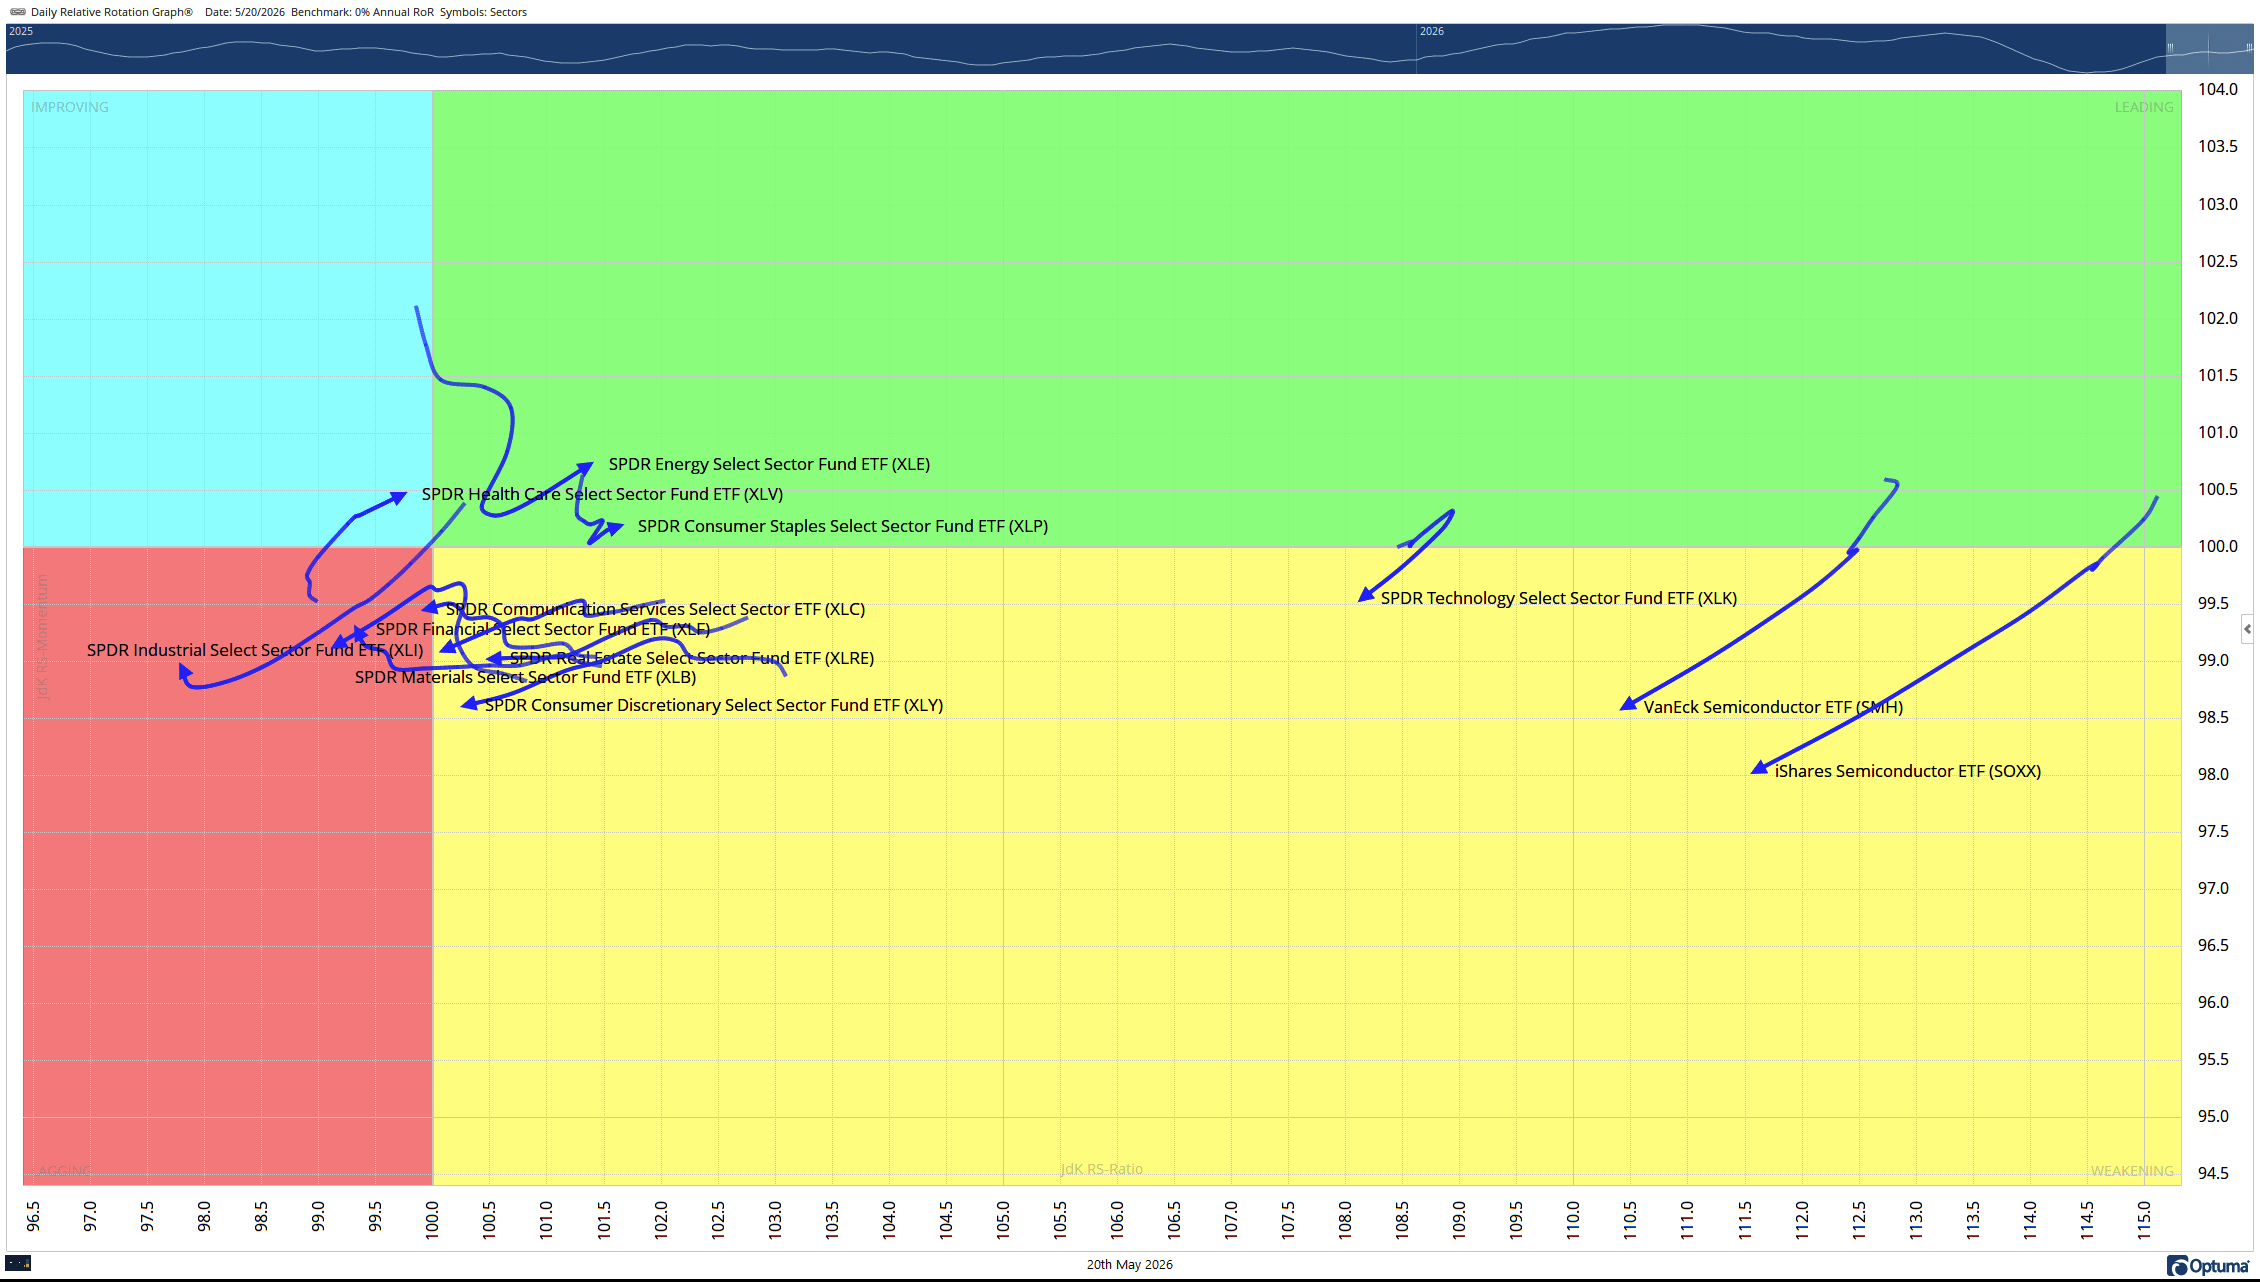
Rotation Is Indicating Continued Weakness
Looking at the rotation in the market using a Relative Rotation Graph (RRG), the broader market continues to rotate towards weakness:
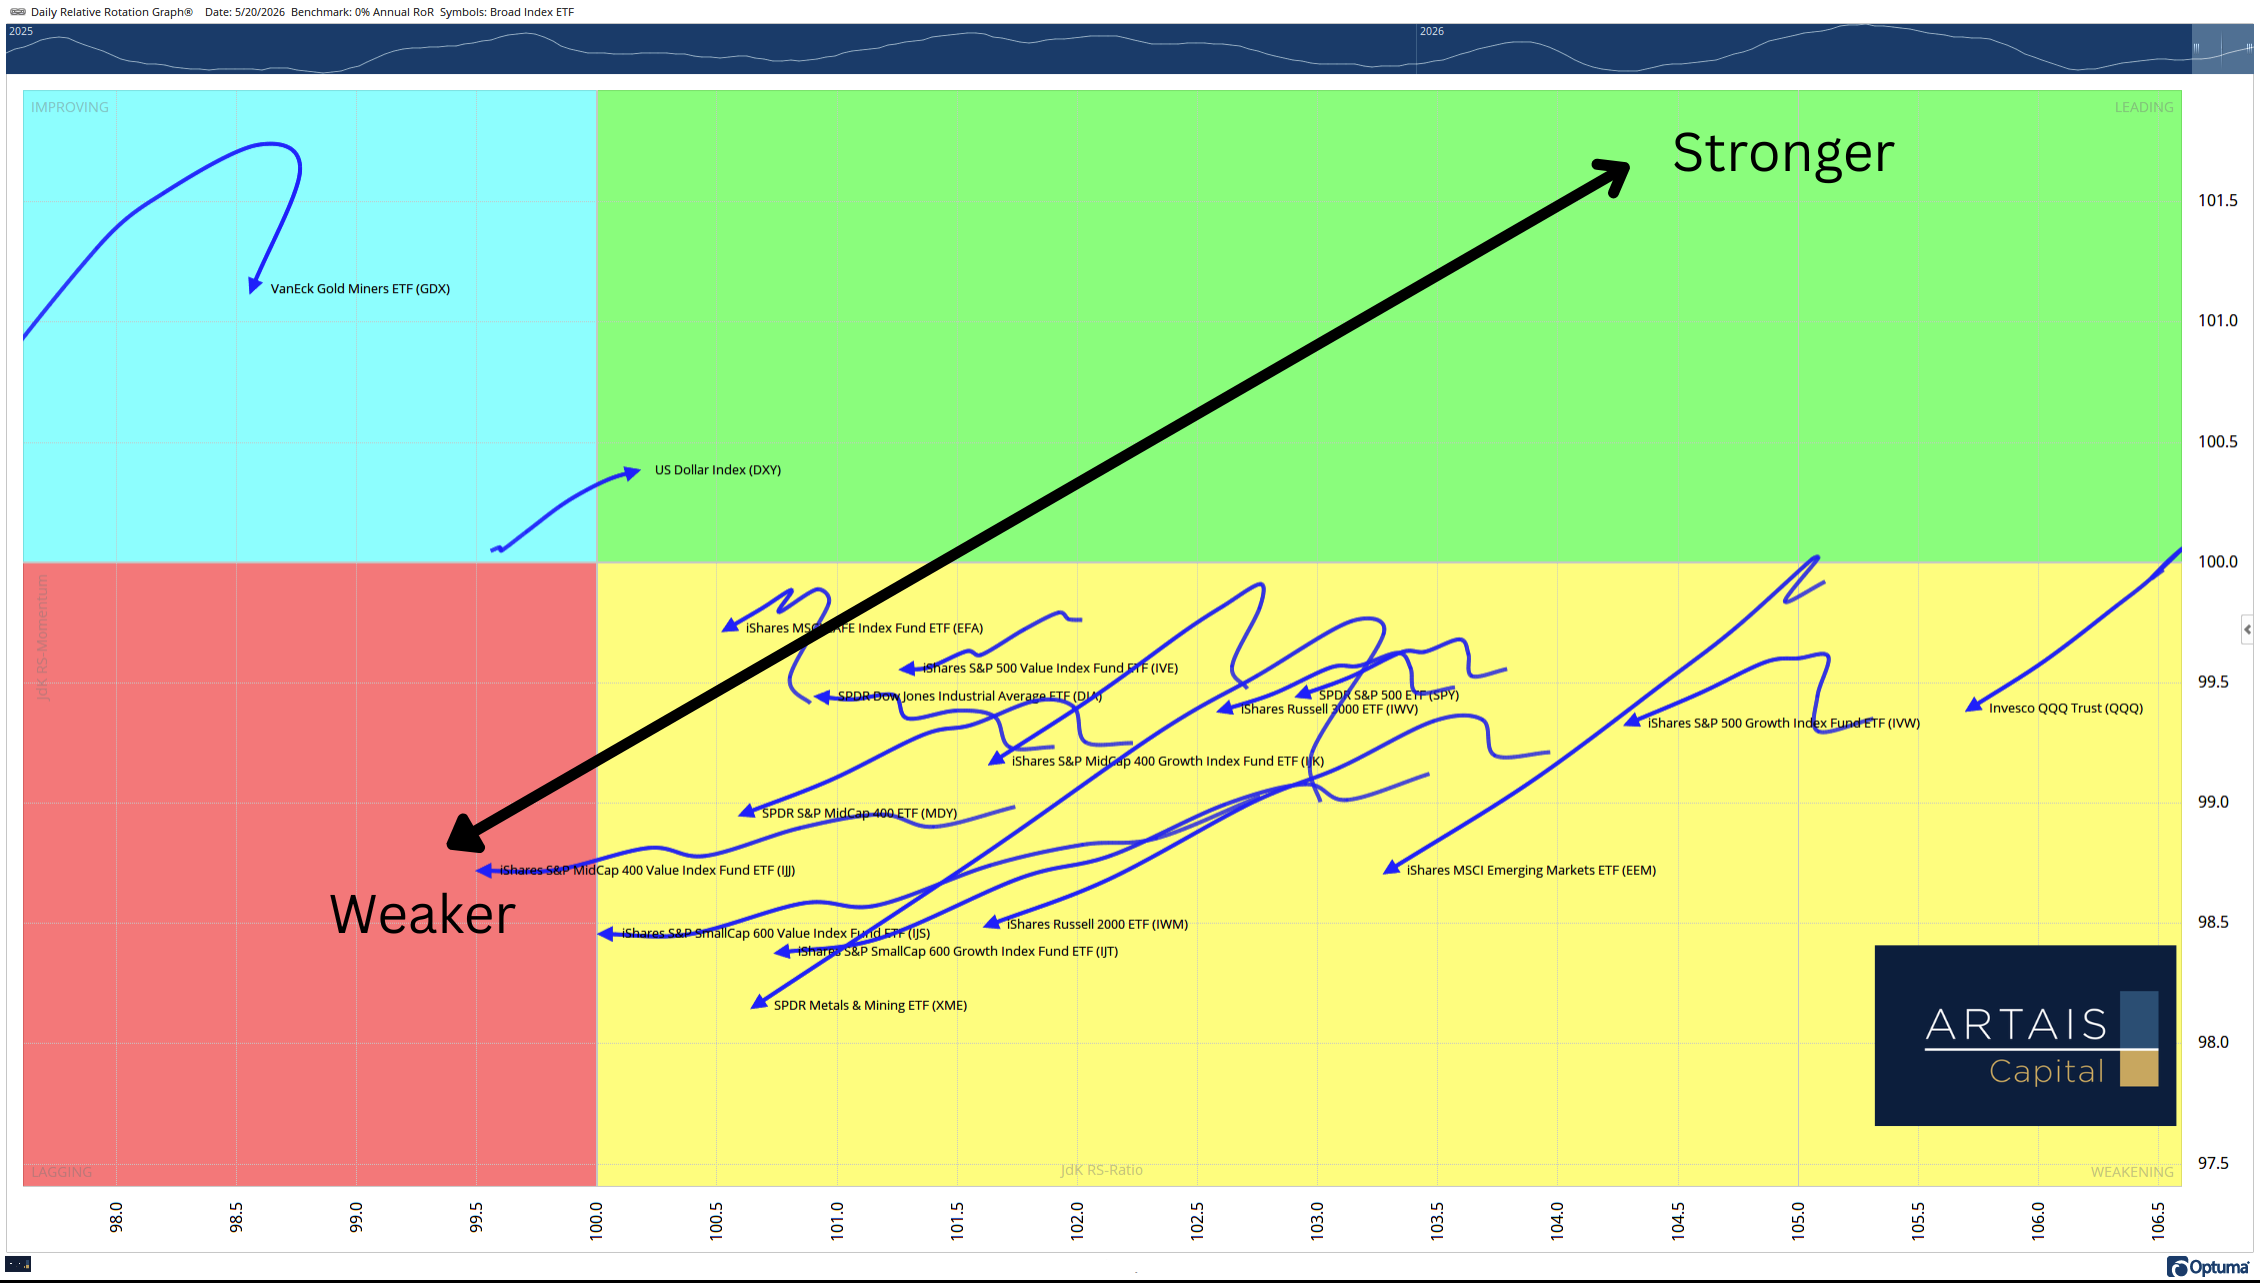
Only Healthcare, Consumer Staples, and Energy sectors are showing improvement (note the weakness in Tech, being led by Semiconductors):
Where Is The Opportunity?
Right now, I am watching Healthcare and Consumer Staples. These are typical sectors that outperform the broader market during times of distress.
However, the intermediate trend for most of these names is still negative.
For example: Johnson and Johnson, a Healthcare staple, is trading below the Cloud model, which I use as a filter to distinguish between intermediate uptrends and downtrends:
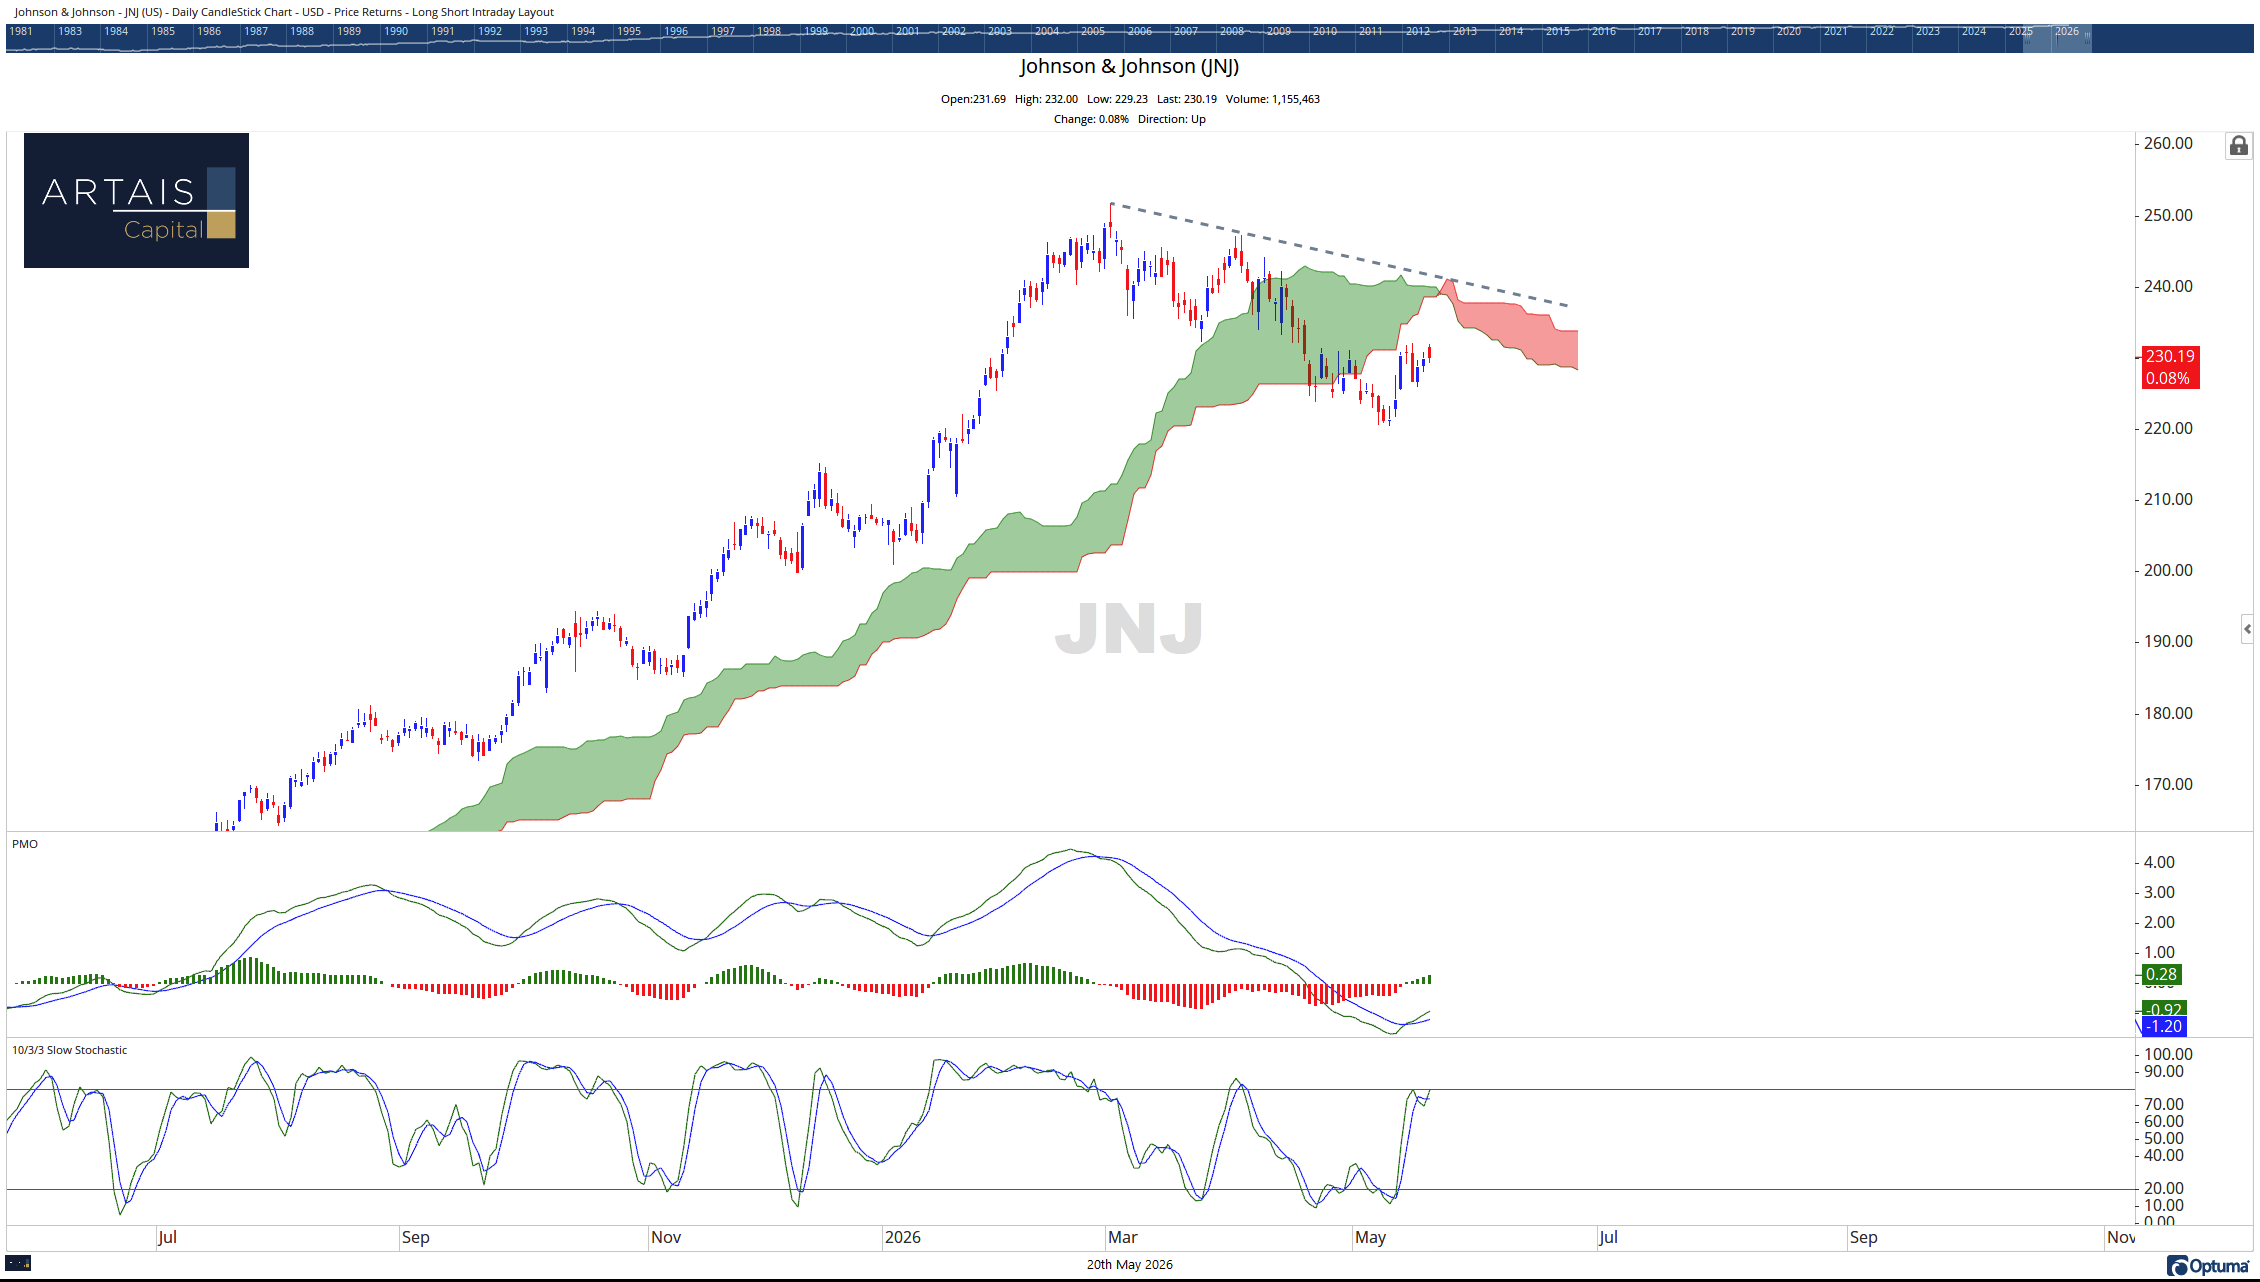
Johnson & Johnson (JNJ) is trading below the Cloud Model, which I use as a filter between intermediate uptrends and downtrends.
If more and more names in these sectors begin to meet the criteria for a buy signal, it is an indication that the relationship favoring growth over safety has changed and may become a longer-term trend.
Just A Normal Summer? (By Historical Standards)
However, as of now, this looks like a market rotation that I would expect to see during the summer leading up to a midterm election.
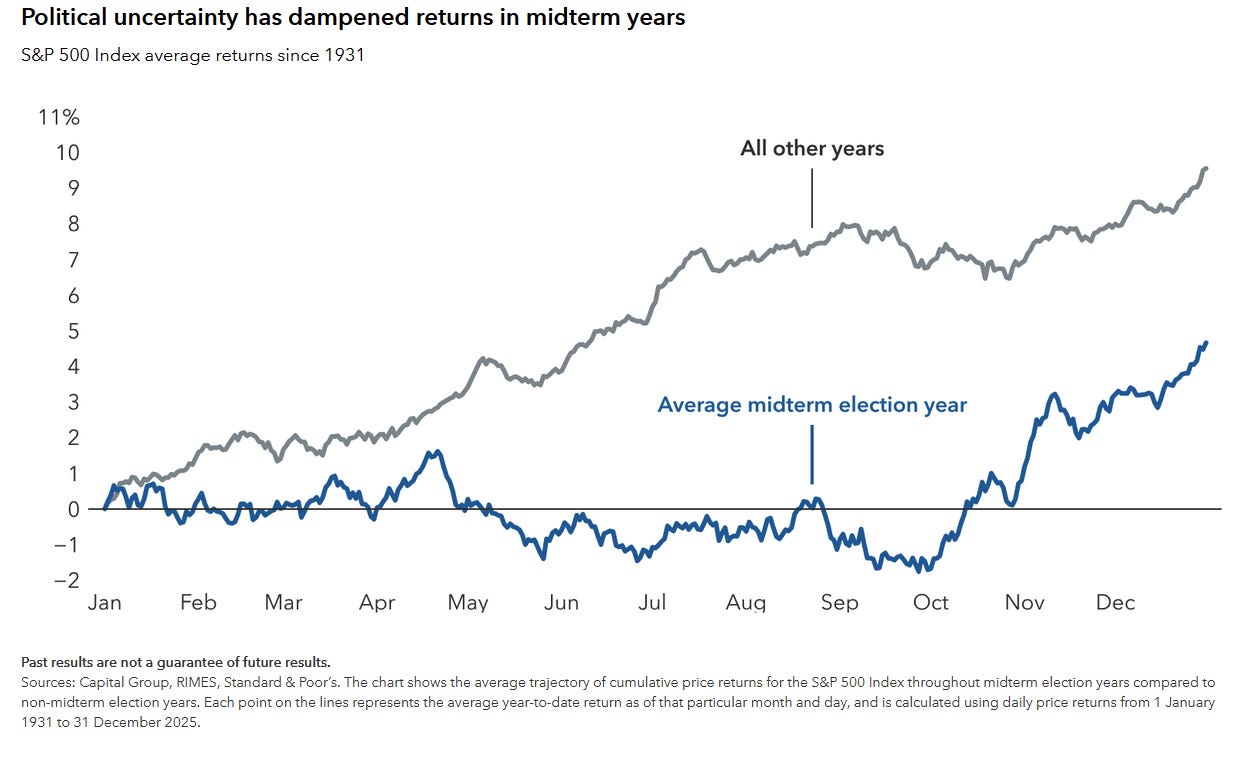
Source: Capital Group
After the 18% rally we have seen in the S&P 500 since the end of March, a pullback towards the 7000 level doesn’t seem unreasonable to me (a 6% pullback from the recent high).
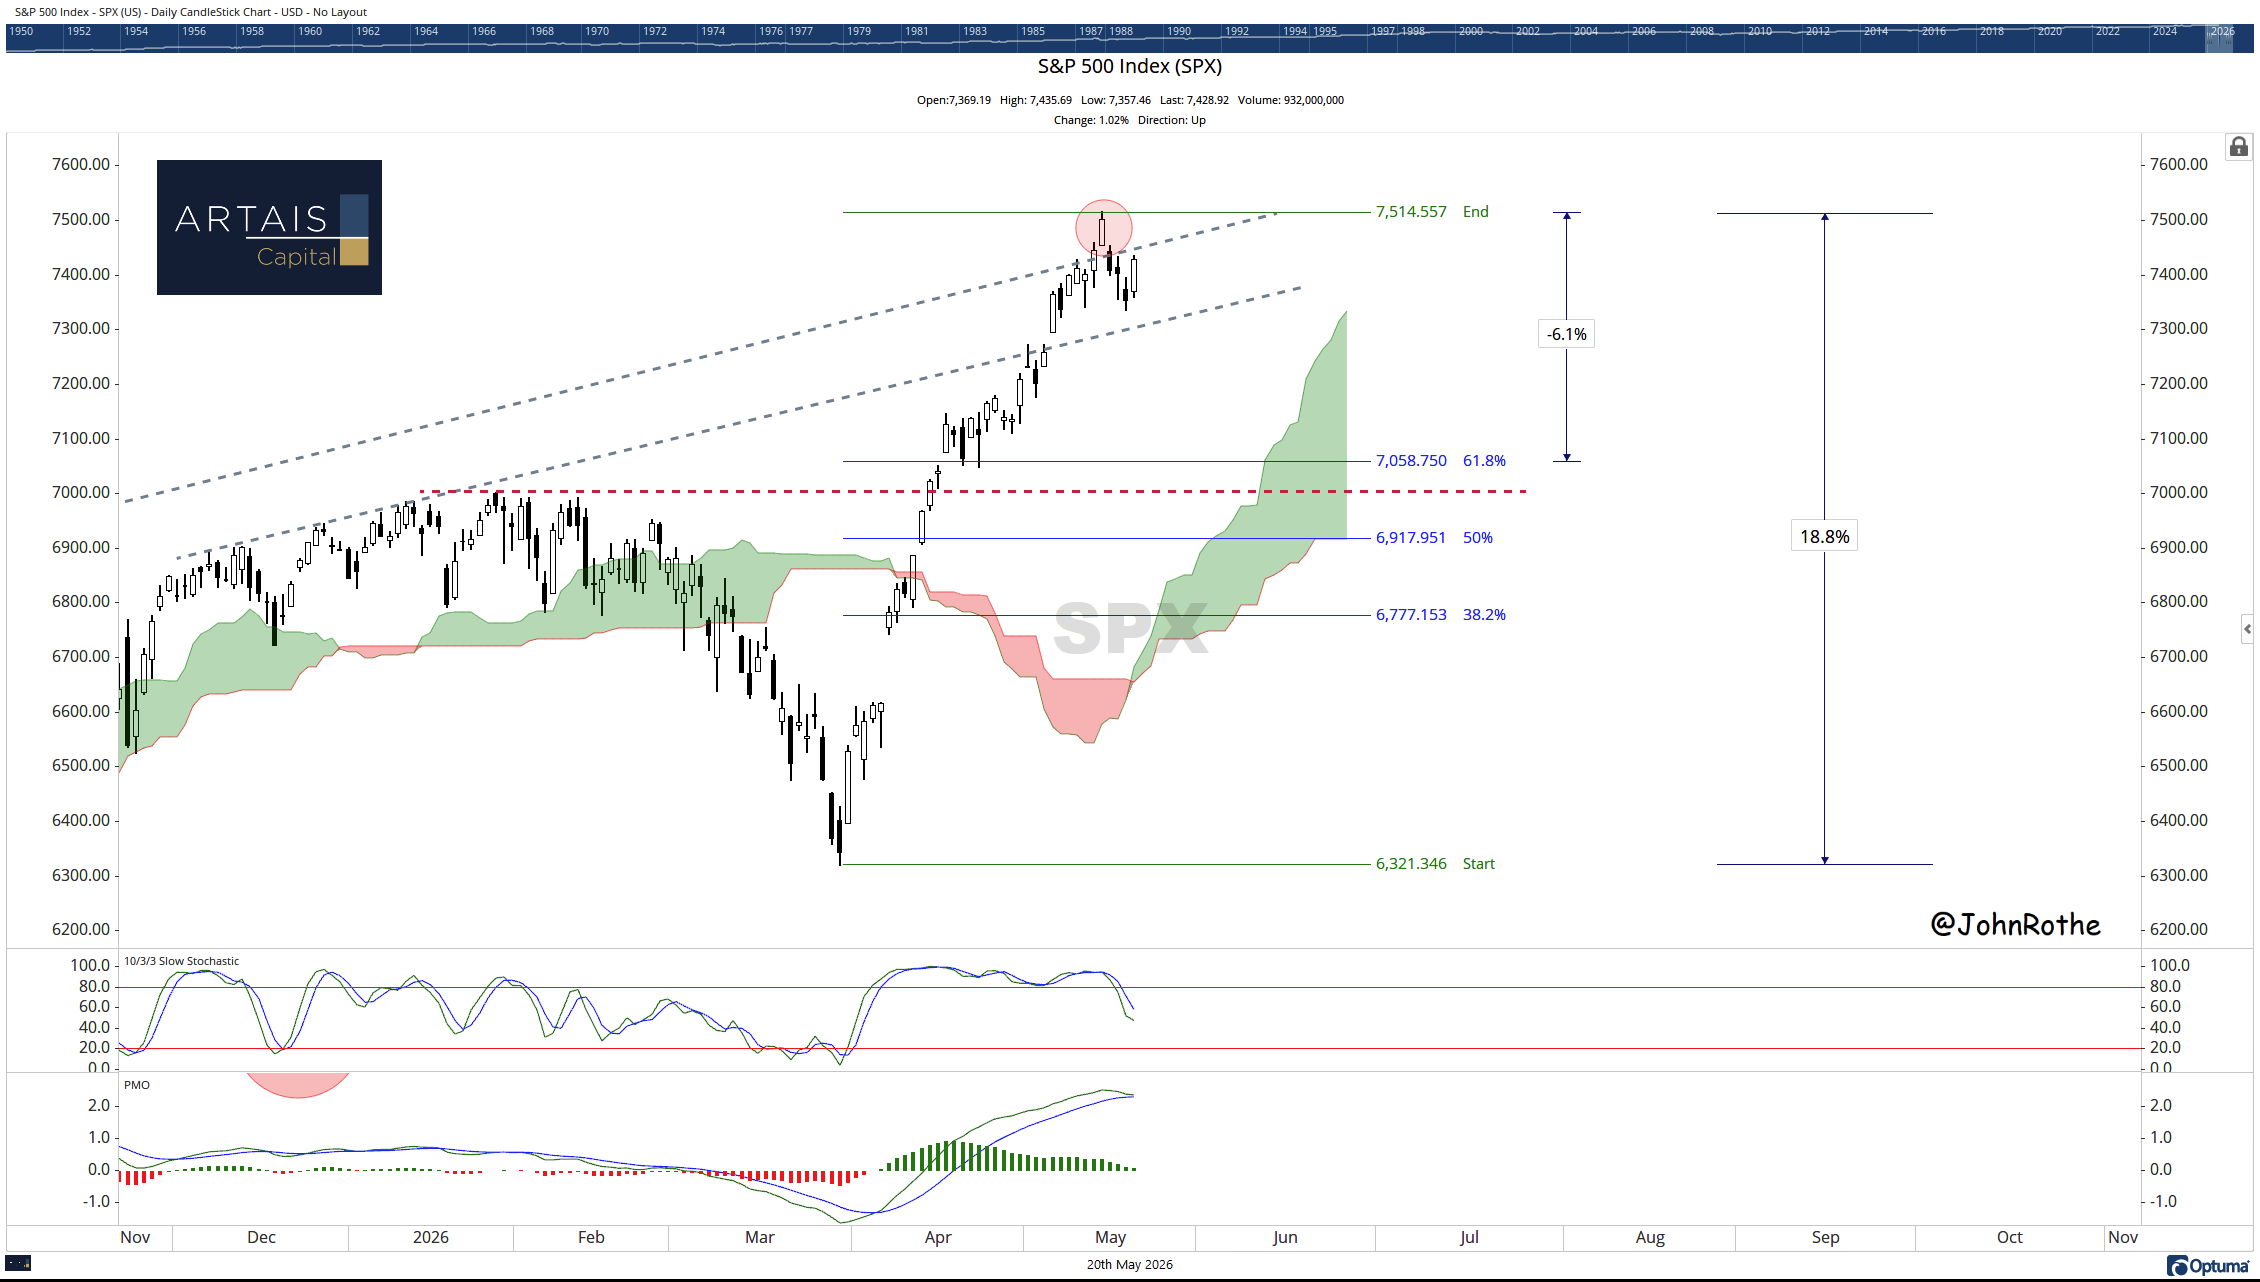
While oil, inflation, and rising interest rates take over the headlines, I don’t view the current market as broken (this can change if Fed policy drastically changes under the leadership of new Fed Chair Kevin Warsh), but it is weakening beneath the surface.
A 6% pullback would be healthy - not alarming - and is consistent with what we typically see during a mid-term election year.
I would rather see the market reset and rebuild breadth than continue to grind higher on the back of a handful of mega-cap names.
John Rothe, CMT
5/20/2026