

Tech Is Still Leaking Momentum
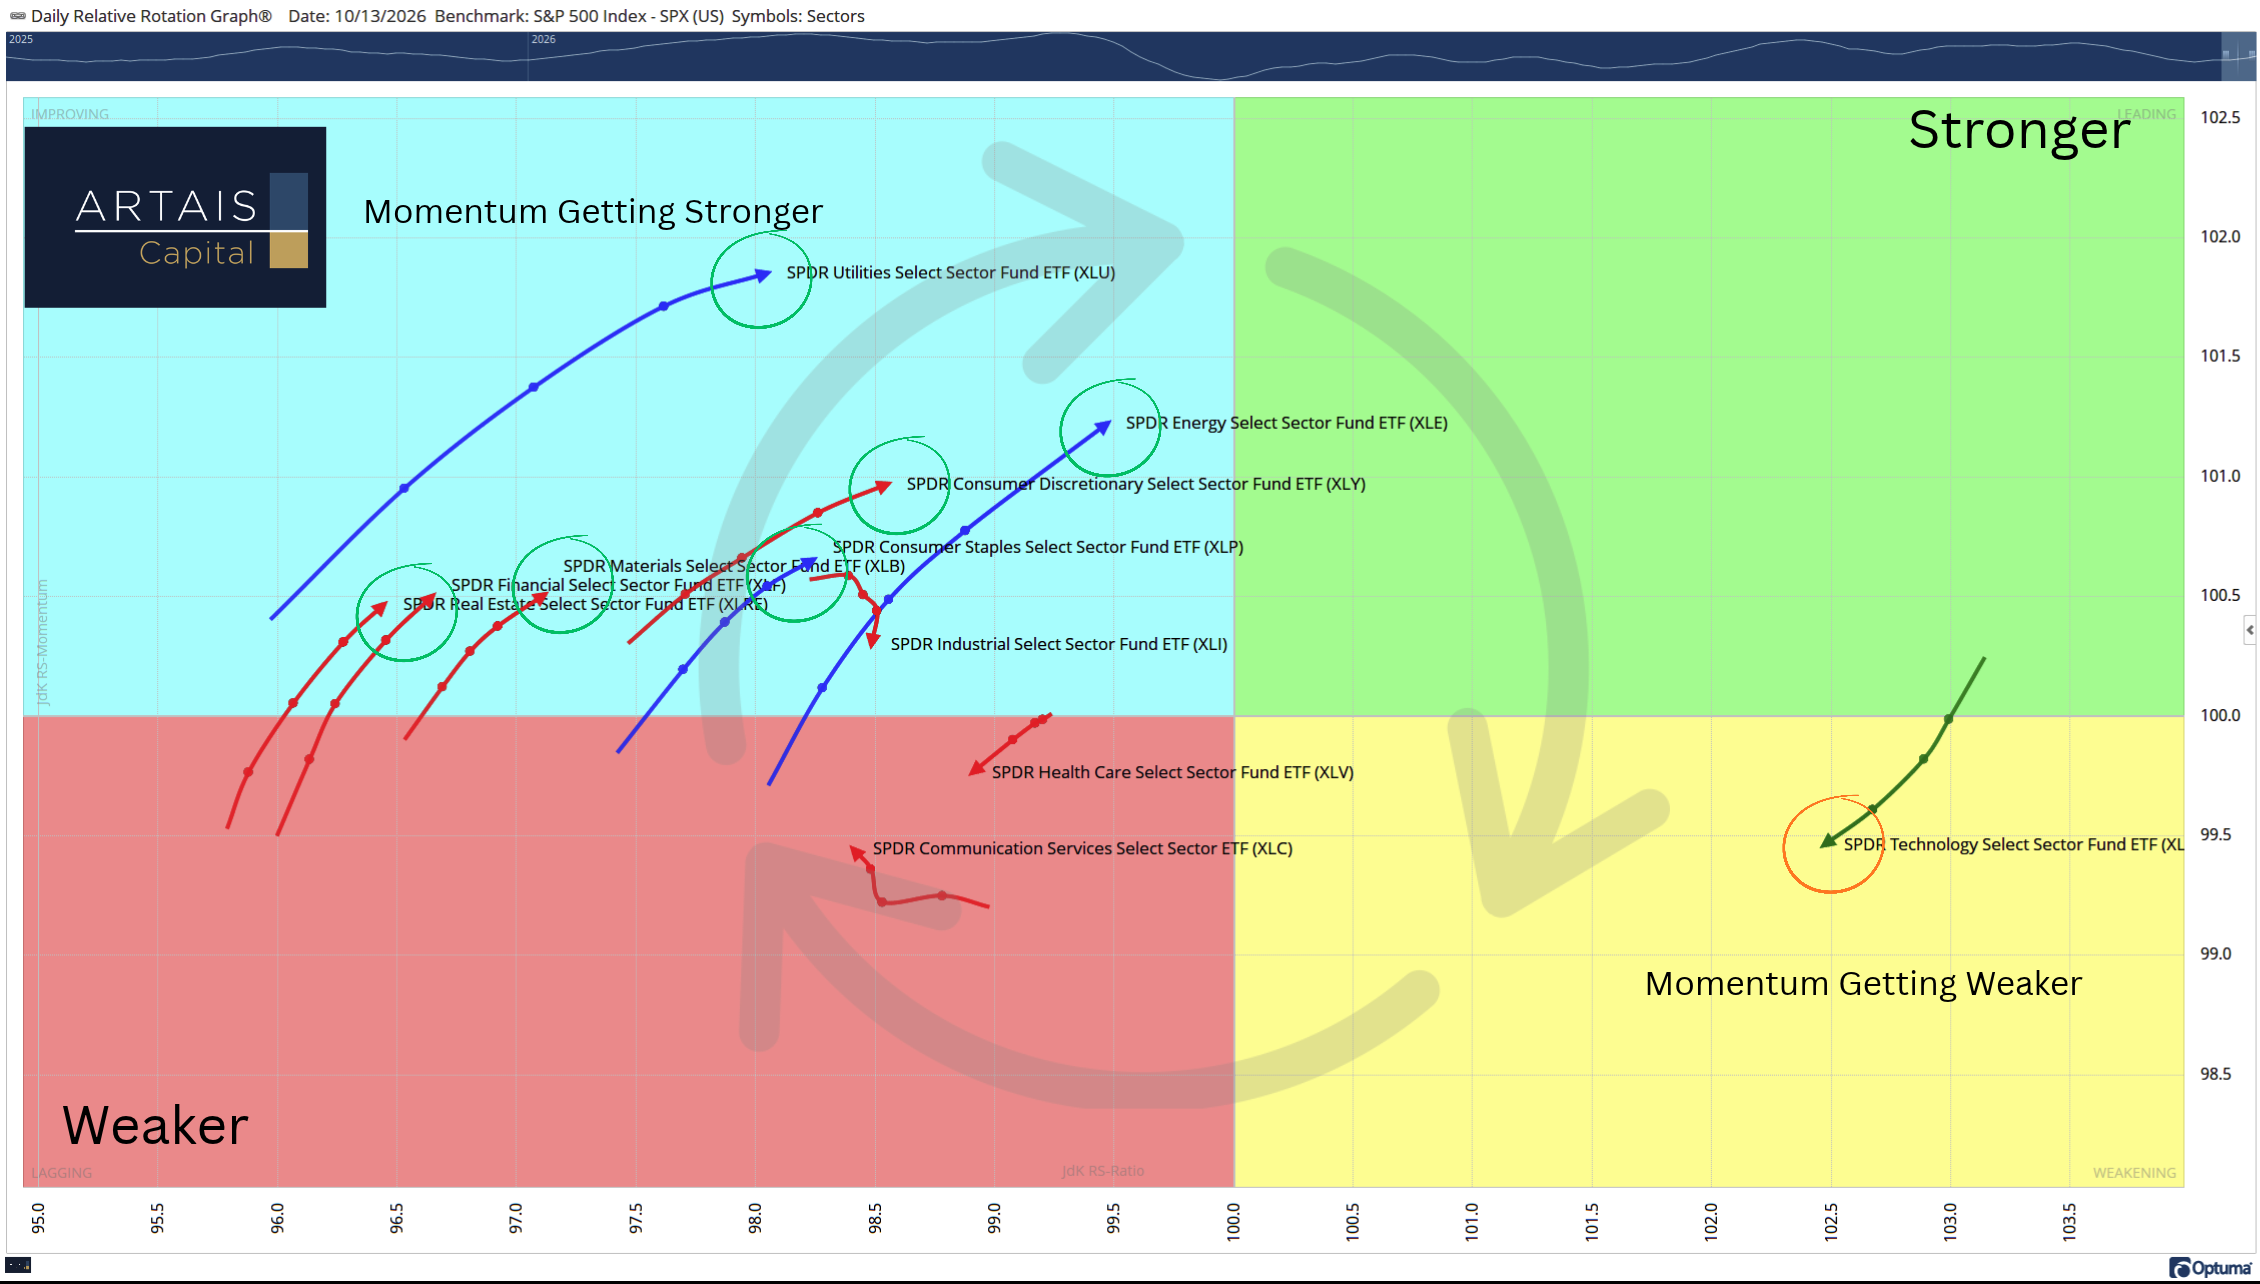
Rotation away from the technology sector and into the rest of the market, continues. On the Relative Rotation Graph below, momentum and relative strength for tech stocks continue to fall, as the sector exits the upper-right, leading quadrant:
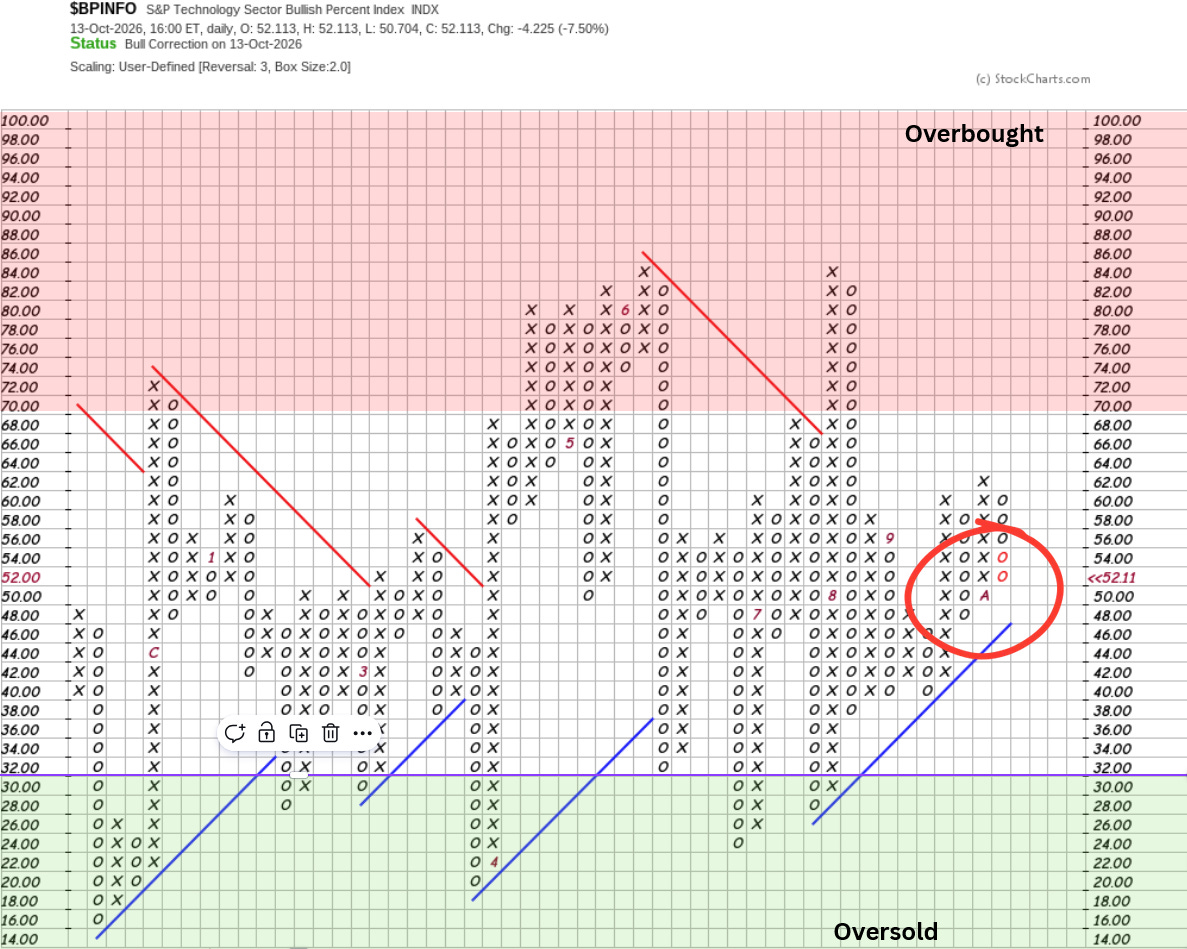
This rotation out of tech is being confirmed by the reversal in the sector’s Bullish Percent Index, which is now in a column of Os and declining:
A Quick Refresher: What the Bullish Percent Index Tells Us
The Bullish Percent Index (BPI) is a market breadth indicator that measures the percentage of stocks within an index or sector (like the S&P 500 or NYSE) that are currently on Point-and-Figure buy signals.
Developed by Abe Cohen in the mid-1950s, the BPI ranges from 0% to 100%. Instead of just tracking the price of an index, it gives us a look under the hood at the internal strength or weakness of the market.
(Think of a column of Xs as the offense—buyers—on the field, and a column of Os as the defense—sellers.)
Bent, Not Broken: Tech’s Long-Term Trend Holds
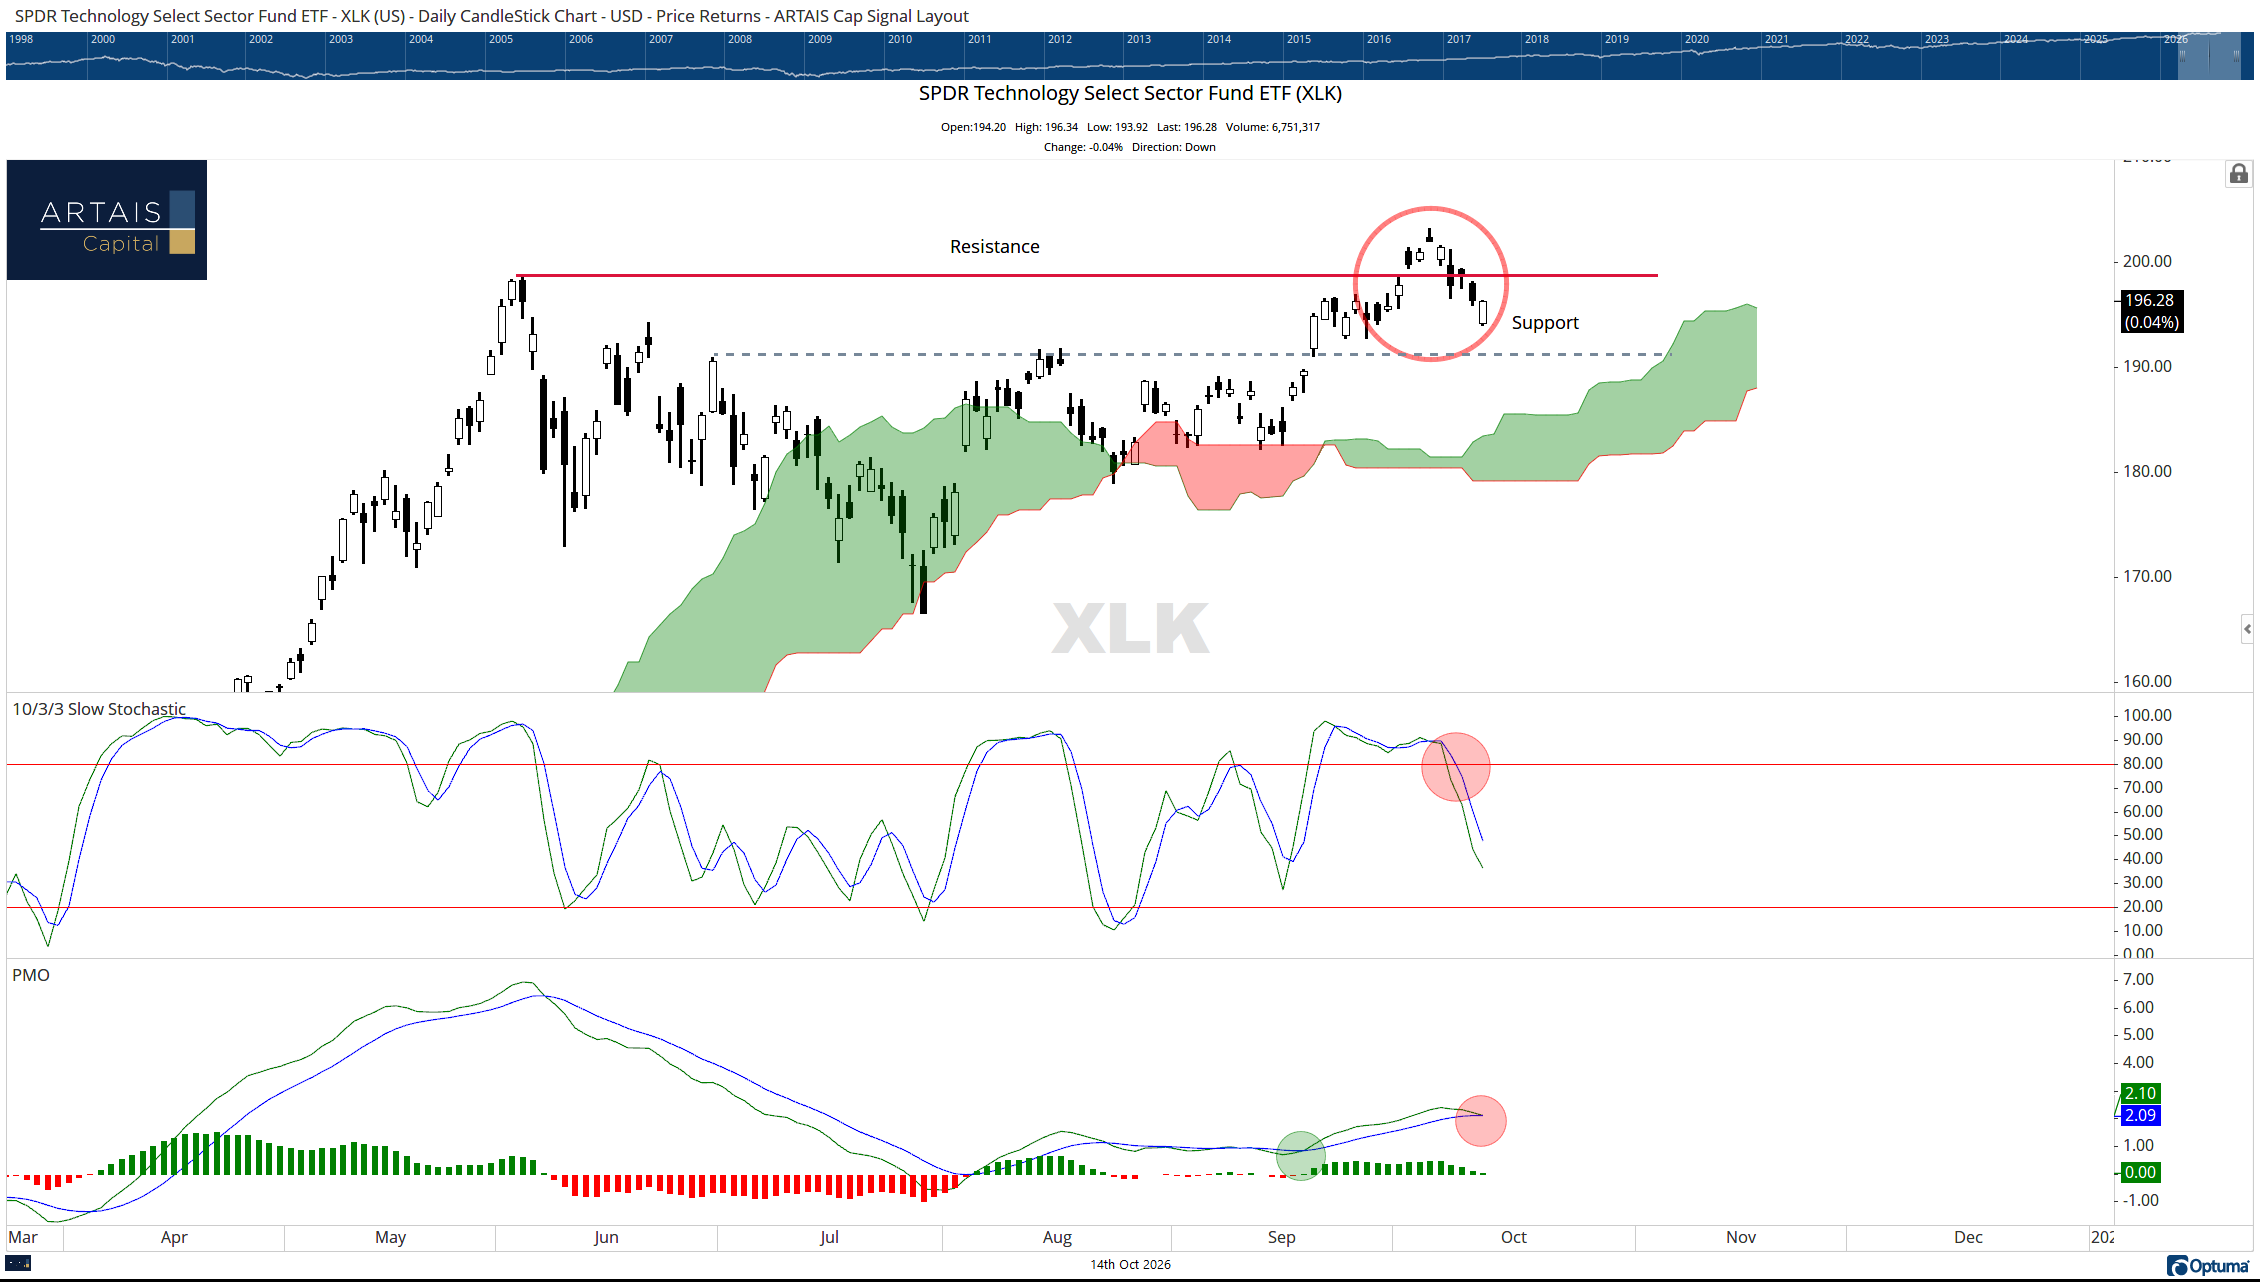
On a longer-term timeframe, technology (XLK) remains above the Ichimoku cloud, which I use to help determine whether a stock or index is in a bull or bear trend.
However, XLK’s inability to break above resistance and keep rising suggests investors are not as bullish on tech and other high-beta stocks as one might expect.
Make sure to read Monday’s research note on how investors are not behaving in line with historical election-cycle trends.
Investors Are Sitting on Their Hands
As of now, this still looks like a short-term trend that is based on a “wait-and-see” attitude from investors ahead of what the Fed does and says about inflation at its FOMC meeting at the end of this month.
(Plus - I am sure some investors are worried about the upcoming midterm elections.)
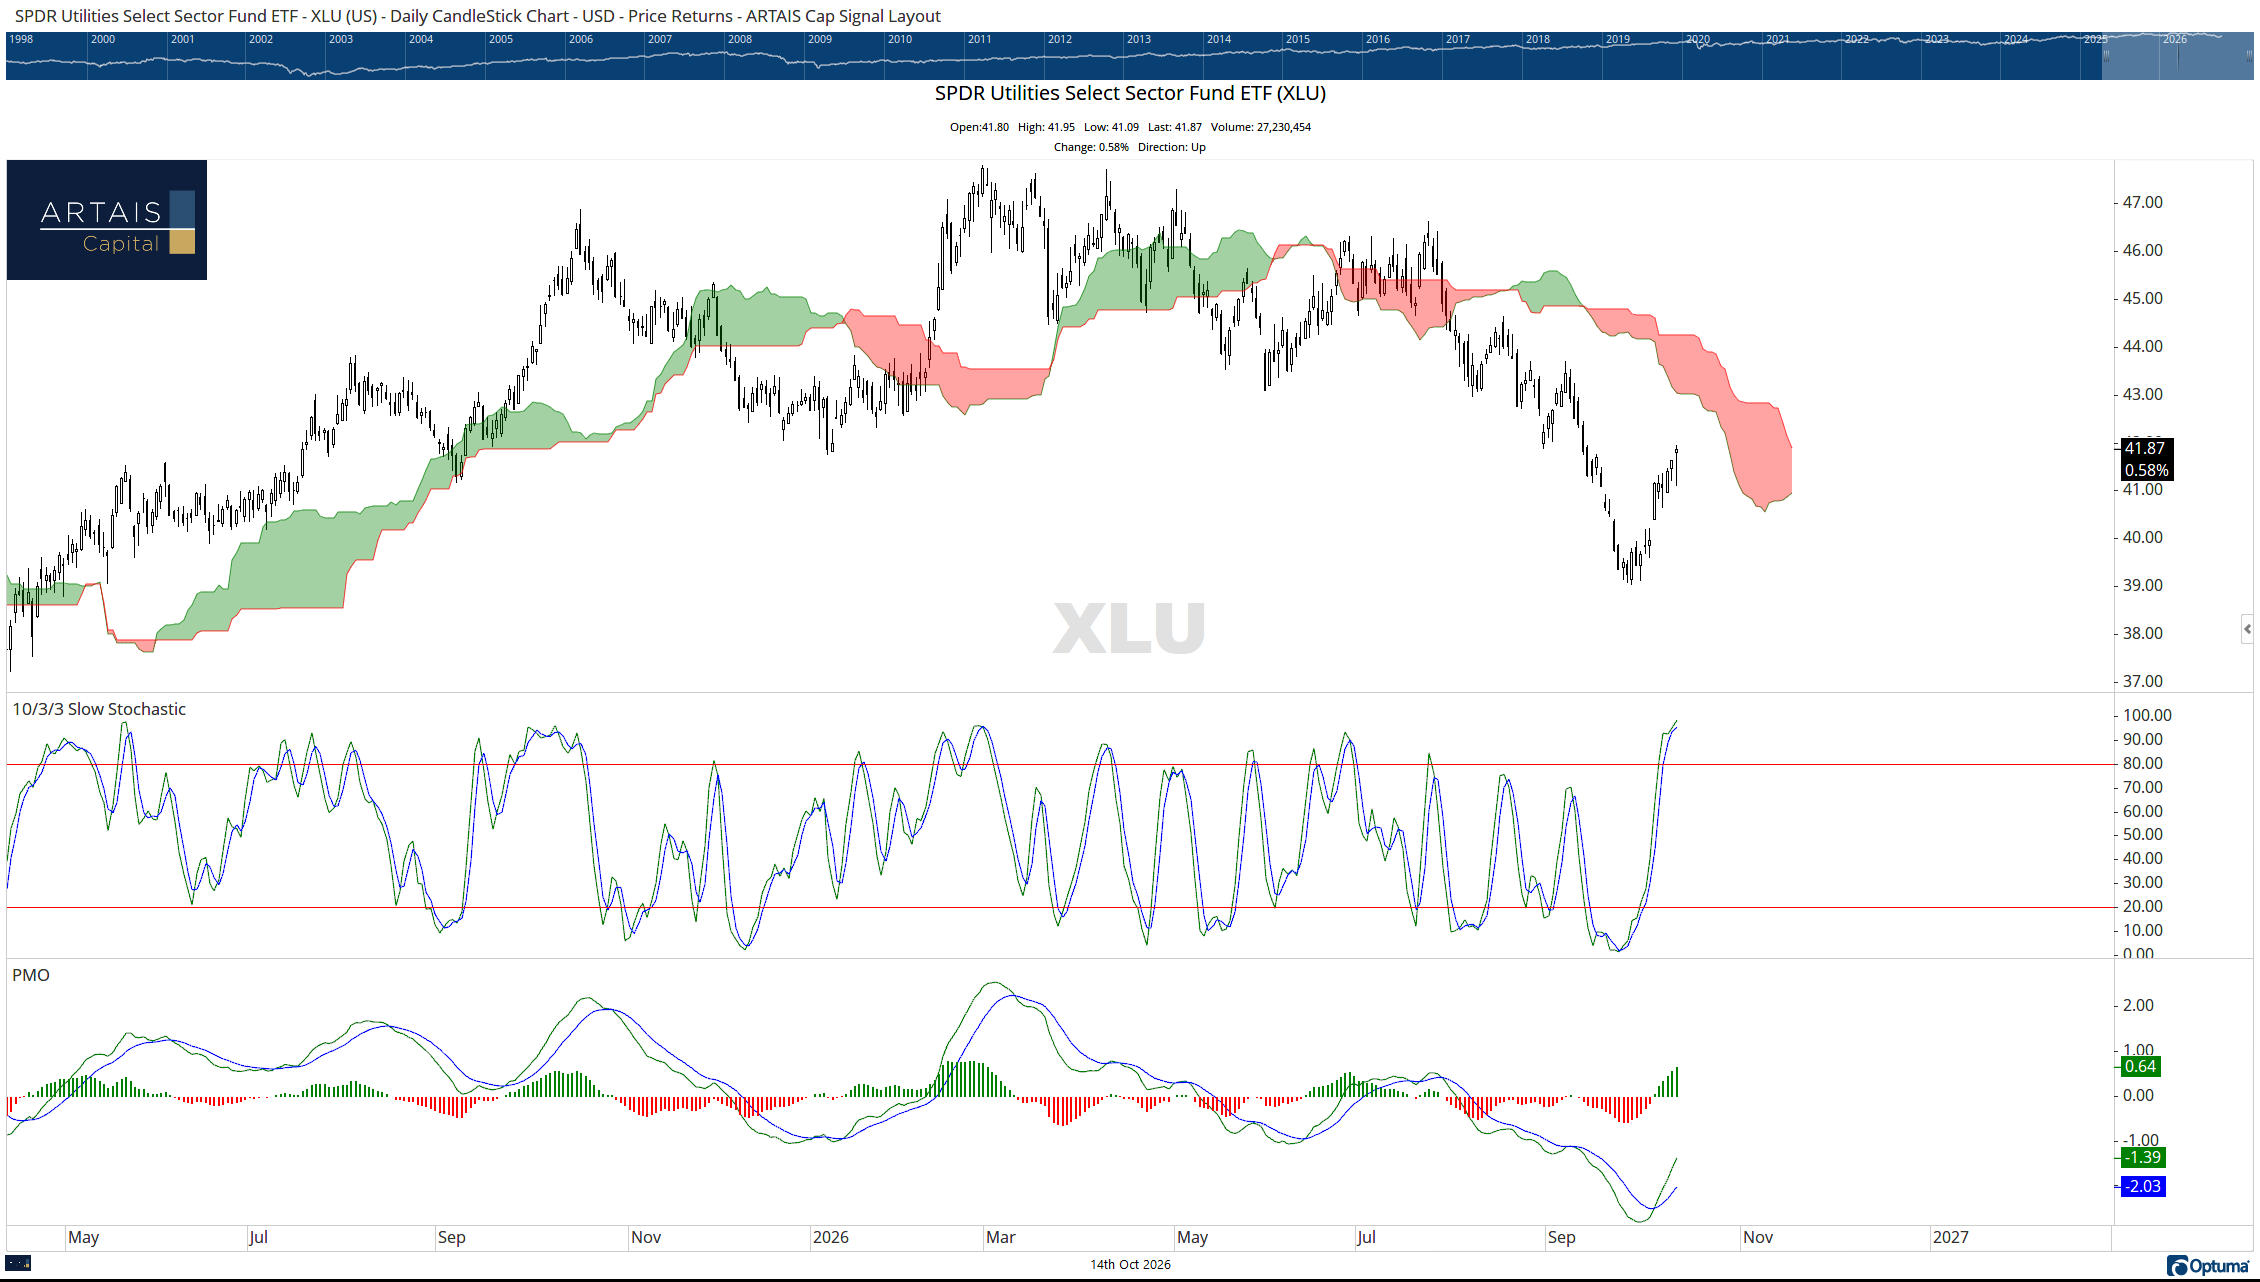
Looking at the non-tech sectors in the S&P 500 index, I see that most of them are trading below the Ichimoku cloud.:
Utilities (XLU):
Industrials (XLI):
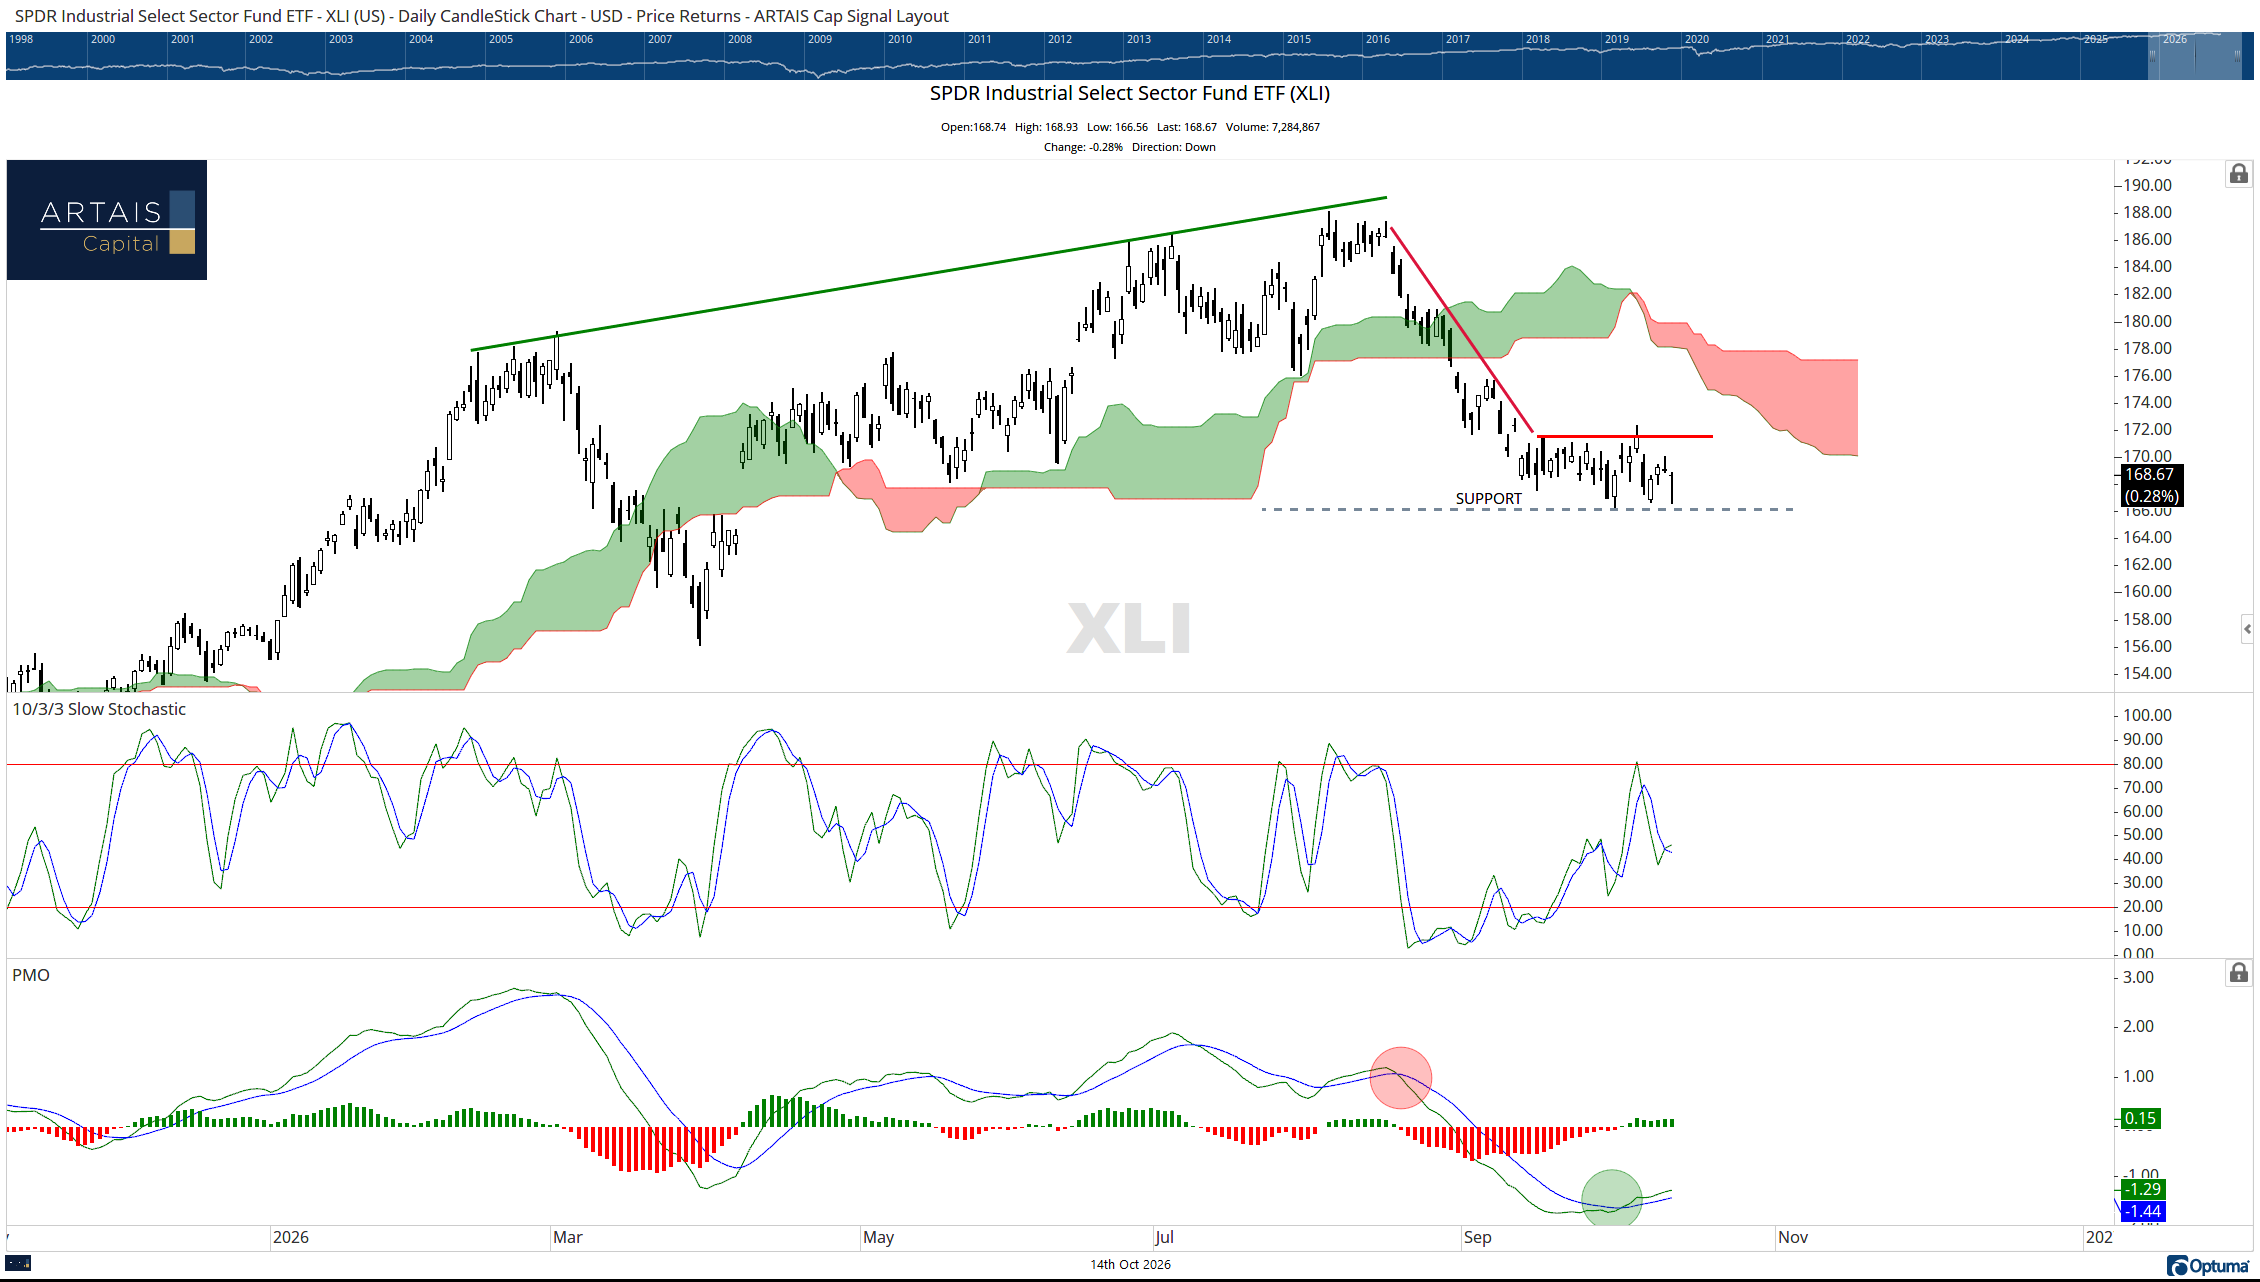
Currently, only Technology (XLK), Energy (XLE), and Communications (XLC) are trading above the cloud:
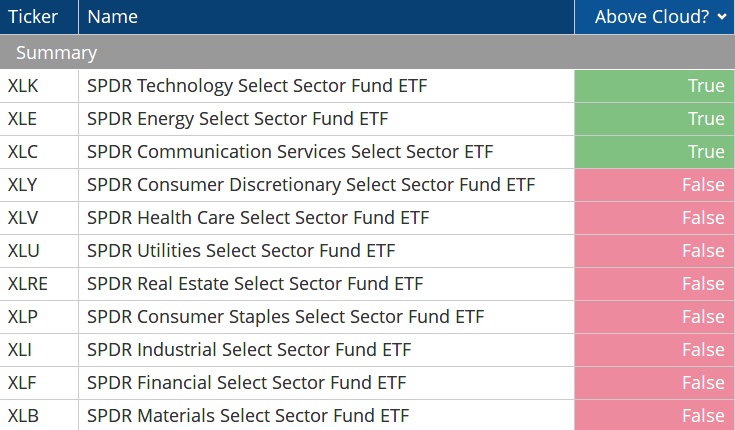
When a sector is trading above the cloud, it indicates that a longer-term bullish trend is in place
The Sector Bell Curve: Who’s Overbought, Who’s Oversold
In addition to some of the fears in the market, short-term traders may be taking advantage of how ignored non-tech sectors have been recently.
Many sectors were, and still are, deeply oversold, and some traders are clearly taking advantage of this by looking for short-term opportunities in the rotation between overbought and oversold sectors.
Below is a bell curve showing the current Bullish Percent Index of each sector in the S&P 500.
Sectors on the left side of the curve are oversold; sectors on the right side are overbought. Green boxes mean the sector is in a column of Xs and rising, and red boxes mean the sector is in a column of Os and is declining:

Source: ARTAIS Capital
Sector Bullish Percent Index charts are overbought when 70% or more of the stocks in the sector are on a “buy” signal. The sector is oversold when less than 30% of stocks are on a “buy” signal.
The idea is that when a high percentage of stocks are on a buy signal, buying exhaustion may be near, because everyone who wants to buy has already bought.
You may have noticed that the sector BPI buy/sell signals do not line up with the cloud status of each sector.
This disparity indicates that, as of now, this is just a short-term rotation that has not affected the longer-term trend that still favors the technology sector.
(In today’s Sector Screen section, found below, I explain why the communication and energy sectors are not favored, despite being above the cloud.)
Trends I Need to See Fail Before I Worry
In the rest of this report: the three trends I need to see fail before I get worried, what the equal-weight S&P 500 is signaling about investor positioning, this week’s sector screen results (one sector just dropped off the active list), and an update on the ARTAIS AI portfolio.