

“Wait-and-See”
Since early August, the S&P 500 index has been stuck in a sideways trading pattern as sectors have been rotating between short-term oversold and overbought conditions.
The index’s momentum (the yellow circle) has been flat, indicating a wait-and-see attitude among investors:
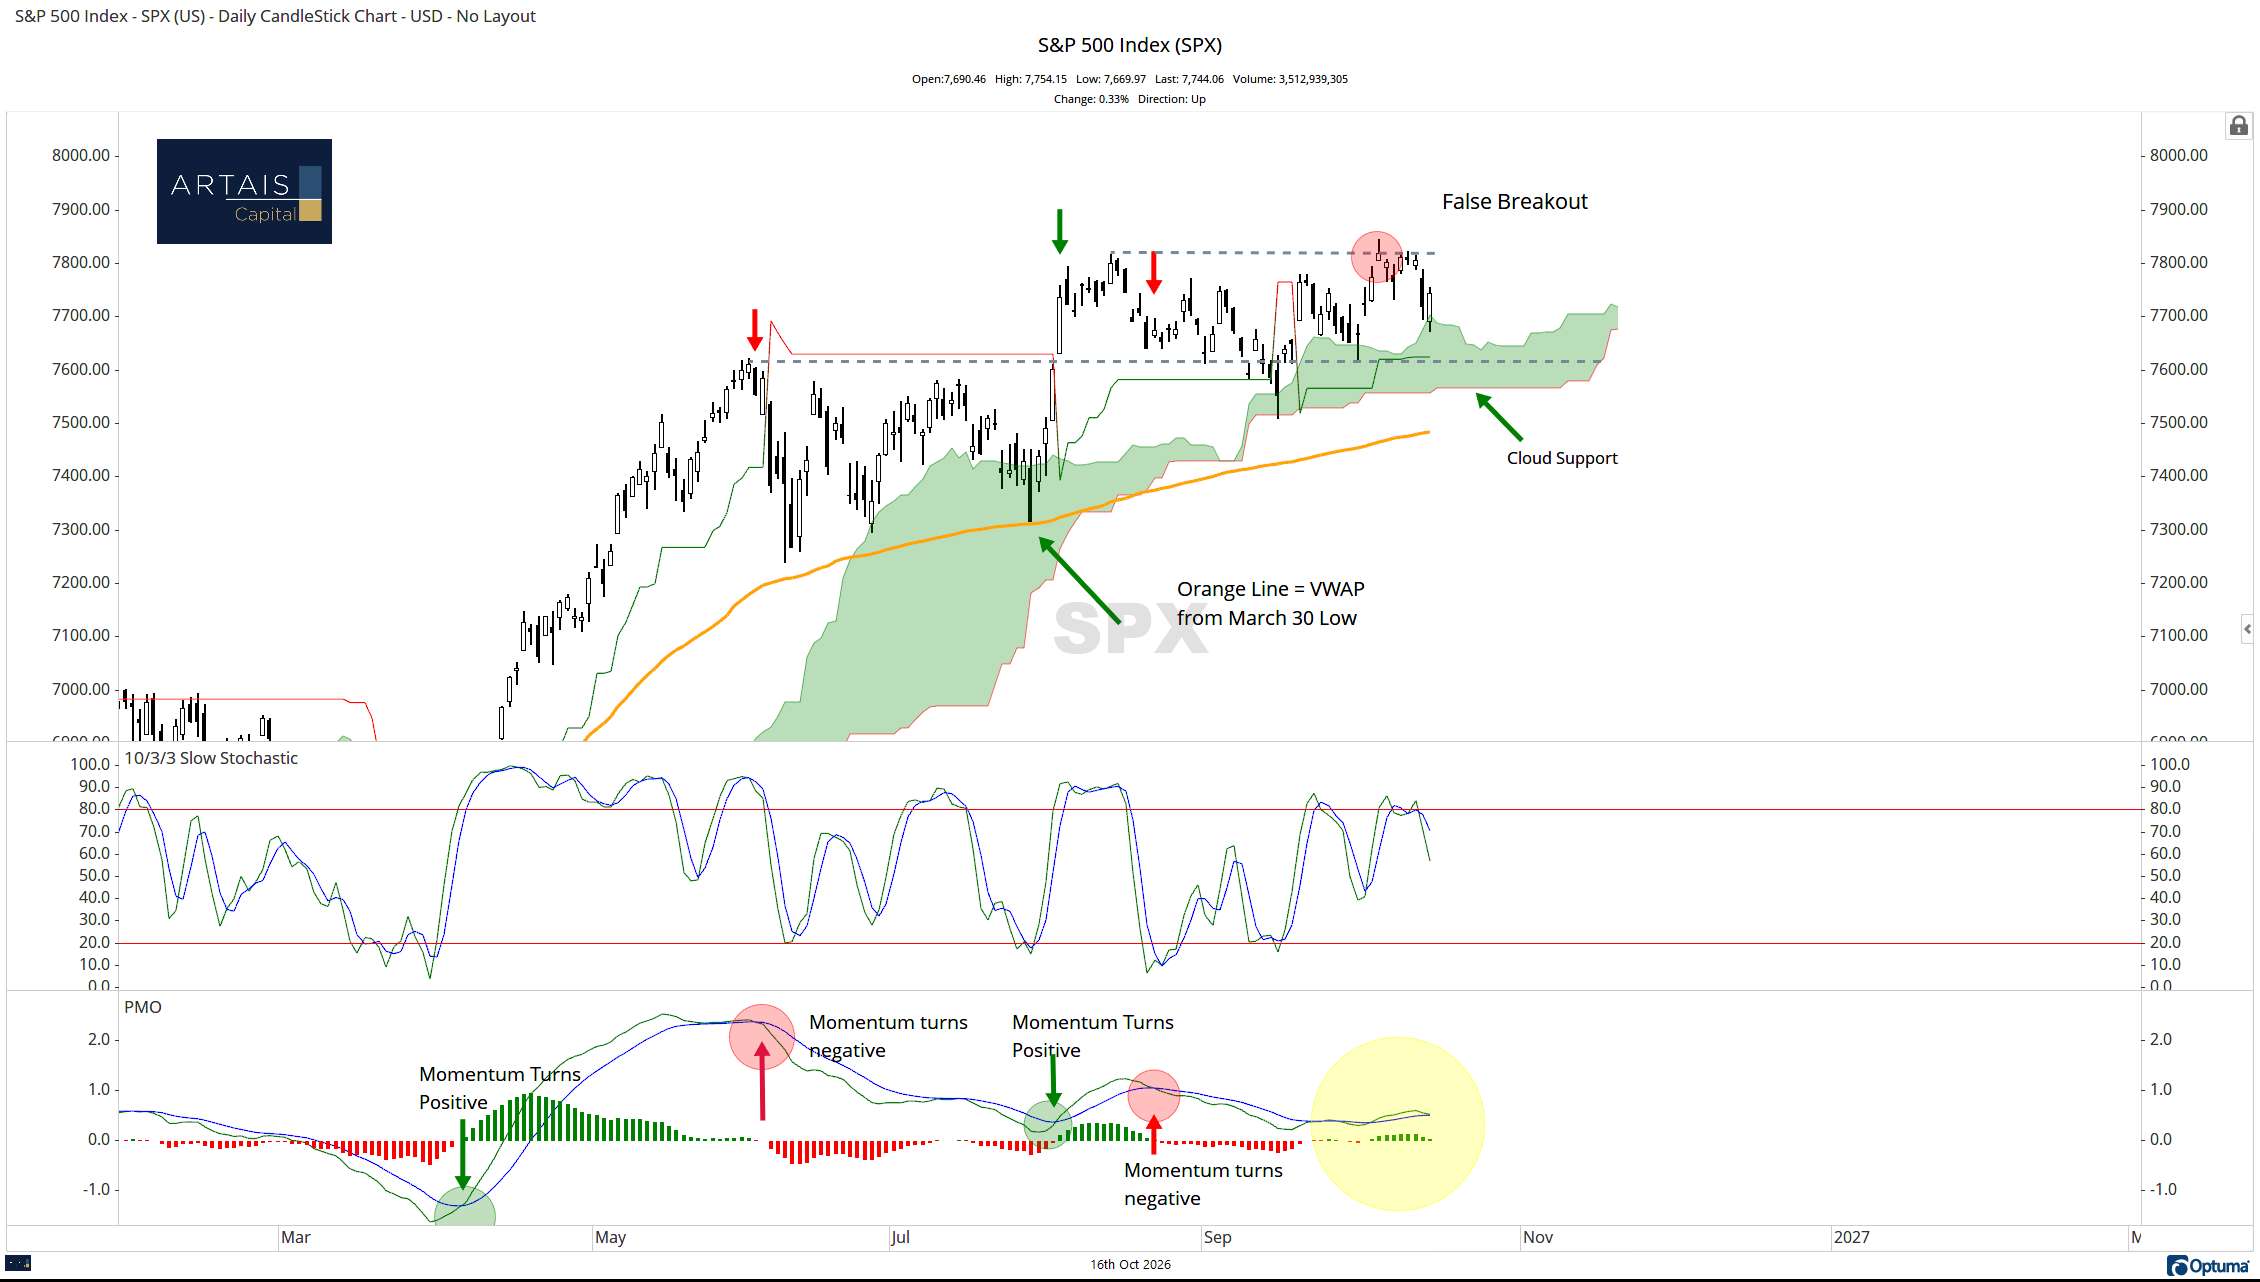
In yesterday’s research note, I discussed the three upcoming catalysts I am watching. I believe most of the market is watching these too, waiting for clarification on AI growth (key tech companies start reporting earnings next week), inflation/interest rates, and the midterm elections.
What Is the Rotation in the Market Telling Us?
As these investors wait, short-term traders have been taking advantage of this sideways pattern to trade between overhead resistance and support levels.
They do this by rotating between high-beta sectors, like technology, and low-volatility sectors, like utilities.
The chart below is a Relative Rotation Graph (RRG). RRGs are one of my favorite tools, as they allow us to visualize the momentum and relative strength of the market
This RRG is from October 6, the day that the S&P 500 had a false breakout. As you can see, high-beta and growth areas of the index were seeing weaker momentum and relative strength. At the same time, value and low-volatility areas were improving:
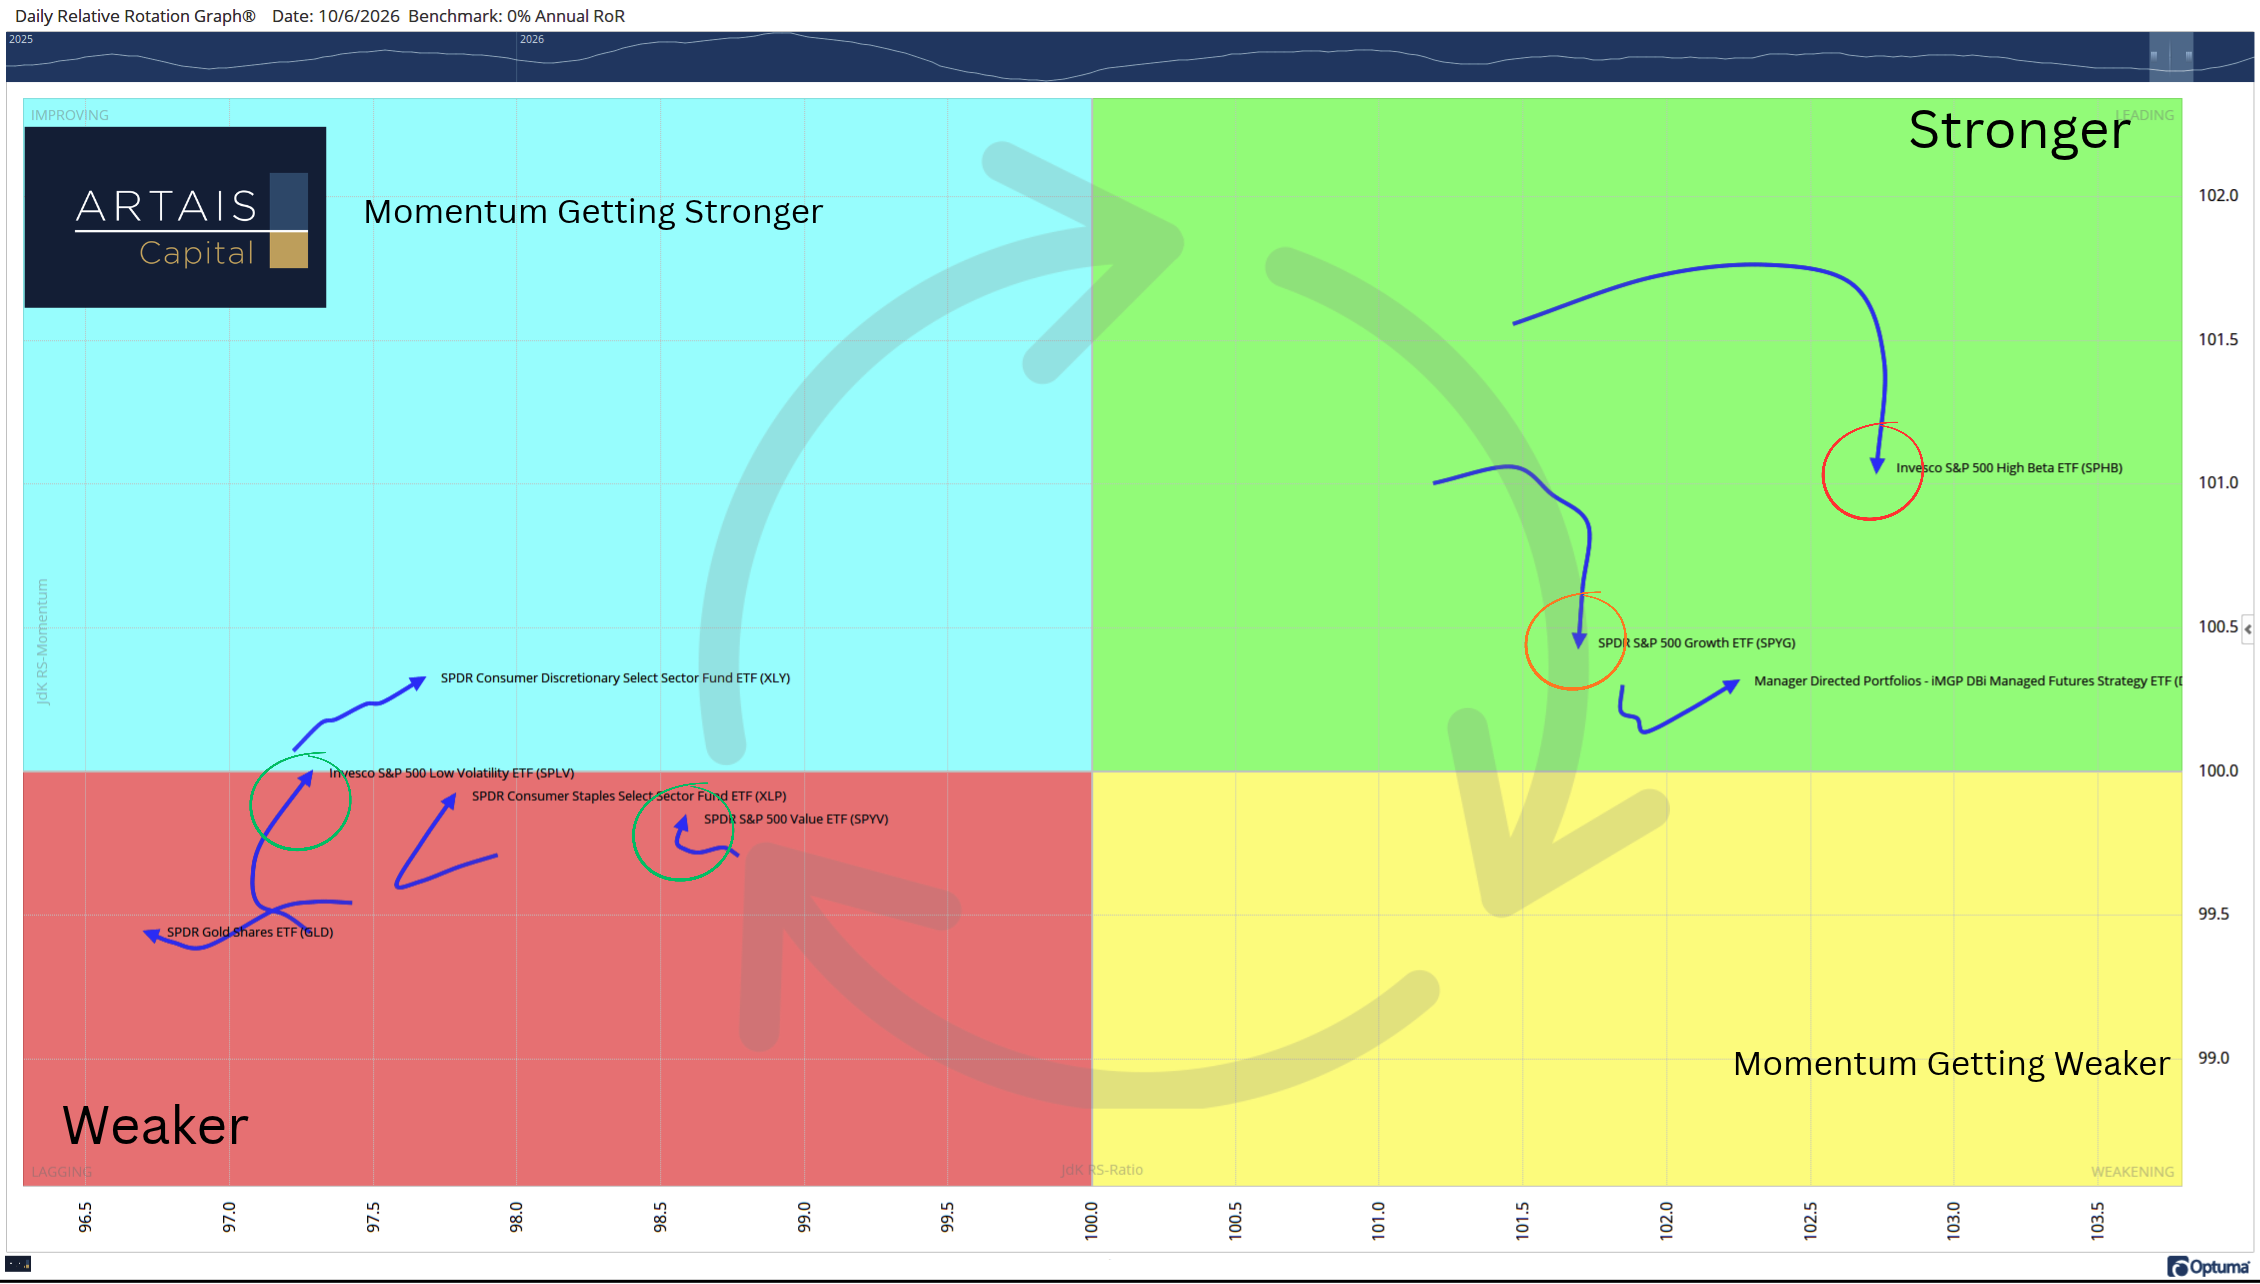
This rotation indicated that the sideways trading pattern of the S&P 500 was going to continue, as investors were becoming more conservative at the top of the sideways trading range.
The current RRG still favors value and low-volatility over growth and high-beta:
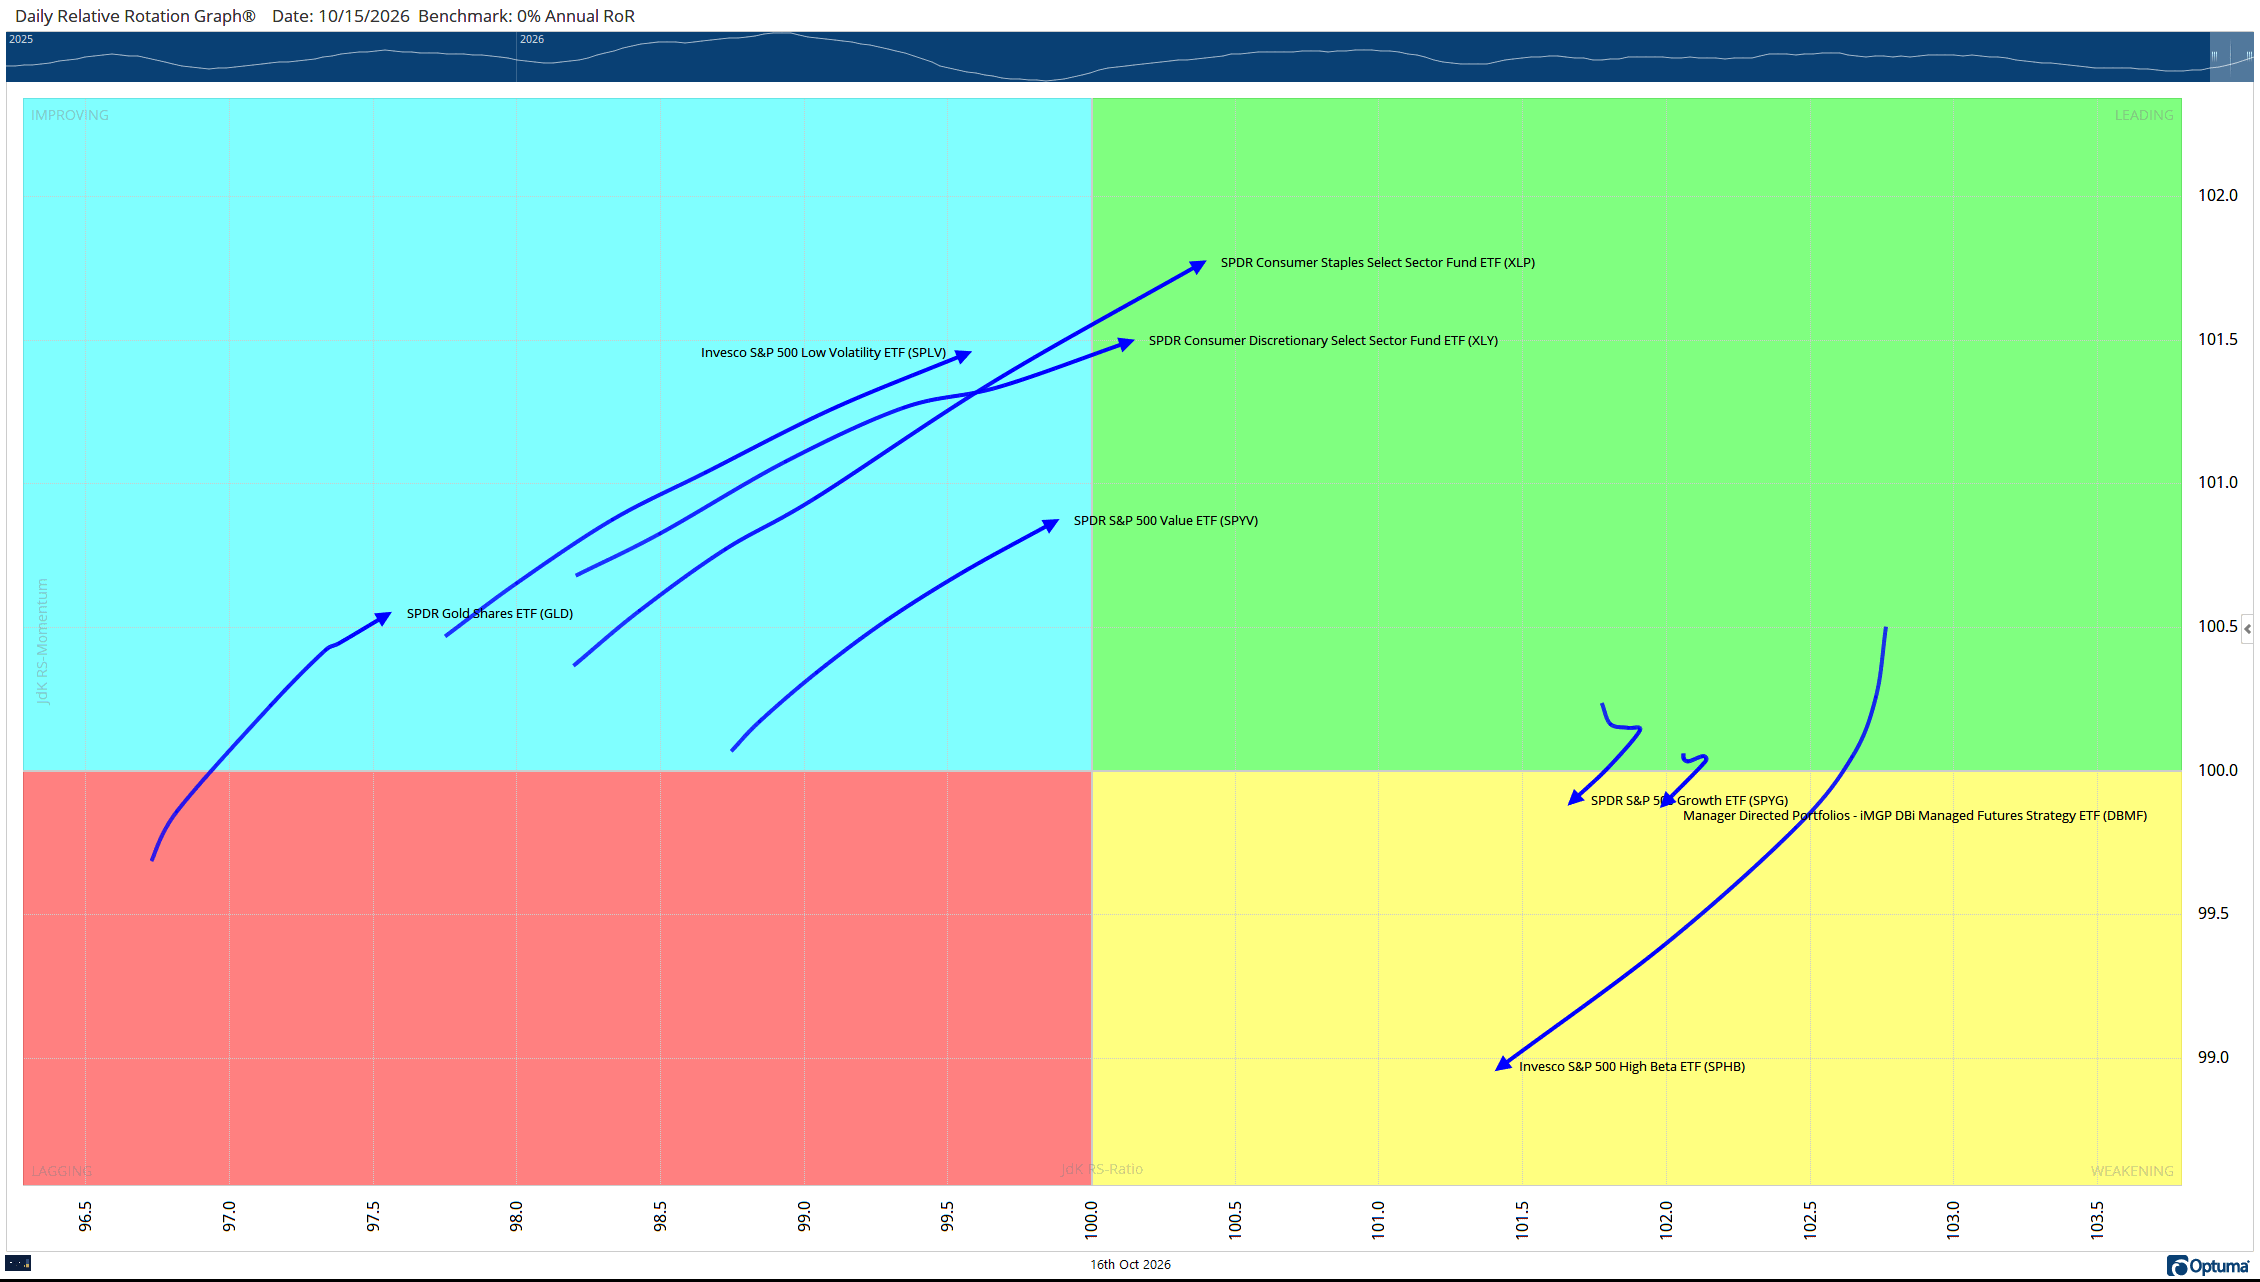
As someone who wants to enter trends as early as possible, I am looking for clues as to when the rotation may begin to favor growth and high-beta.
Time to Rotate Back Into Tech?
Earlier this week, I wrote that money wasn’t leaving the stock market; it was just leaving tech.
Well, just as fast as it left, money appears to be flowing back into tech.

The index’s sideways pattern is still intact, and as the index nears support, the rotation back into high-beta areas seems to be starting.
Below is the Bullish Percent Index for the S&P 500 (which is roughly 40% technology stocks), and it is indicating buyers are starting to show up (it indicates that buyers are starting to show up, which is a good sign if you are worried the market is about to collapse):
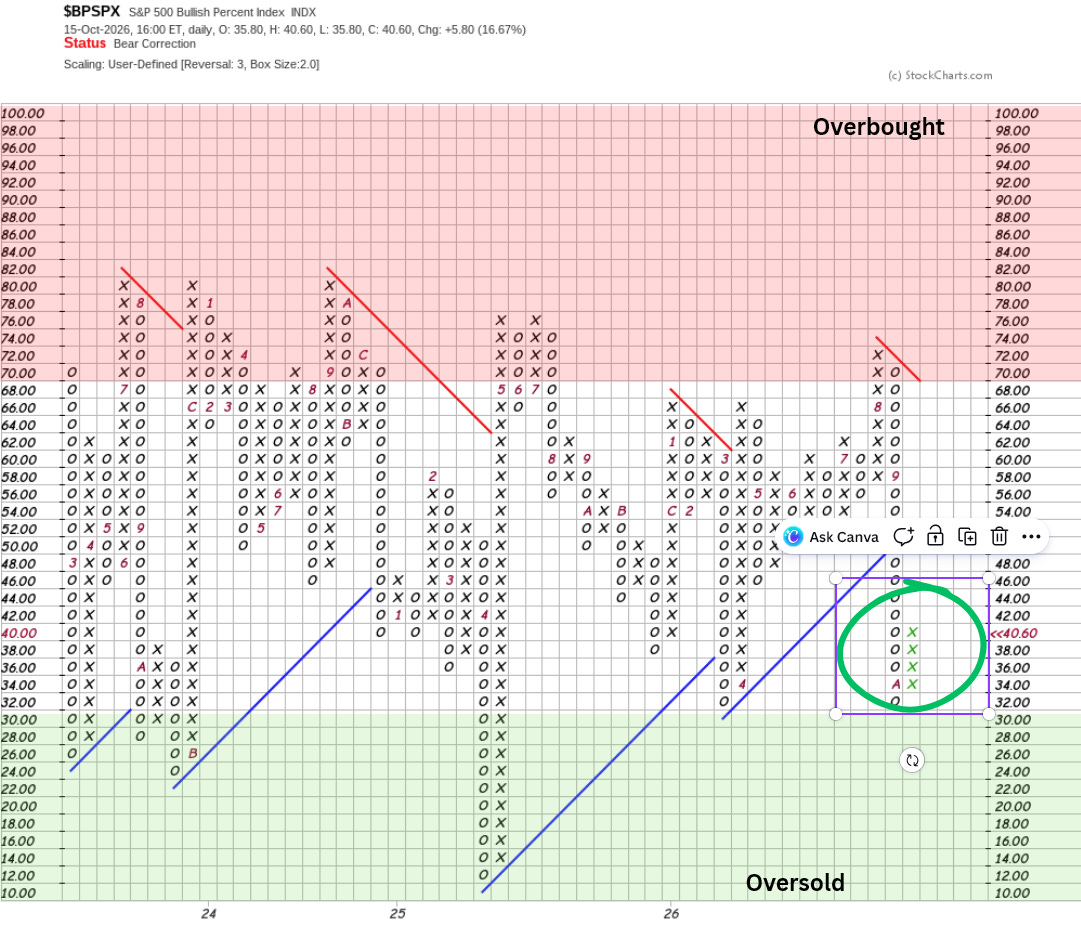
The Bullish Percent Index (BPI) is a market breadth indicator that measures the percentage of stocks within an index or sector (like the S&P 500 or NYSE) that are currently on Point-and-Figure buy signals.
Developed by Abe Cohen in the mid-1950s, the BPI ranges from 0% to 100%. Instead of just tracking the price of an index, it gives us a look under the hood at the internal strength or weakness of the market.
(Think of a column of Xs as the offense—buyers—on the field, and a column of Os as the defense—sellers.)
In addition to a buy signal for the S&P 500’s BPI, the tech-heavy Nasdaq 100 index has also reversed up into a column of Xs:
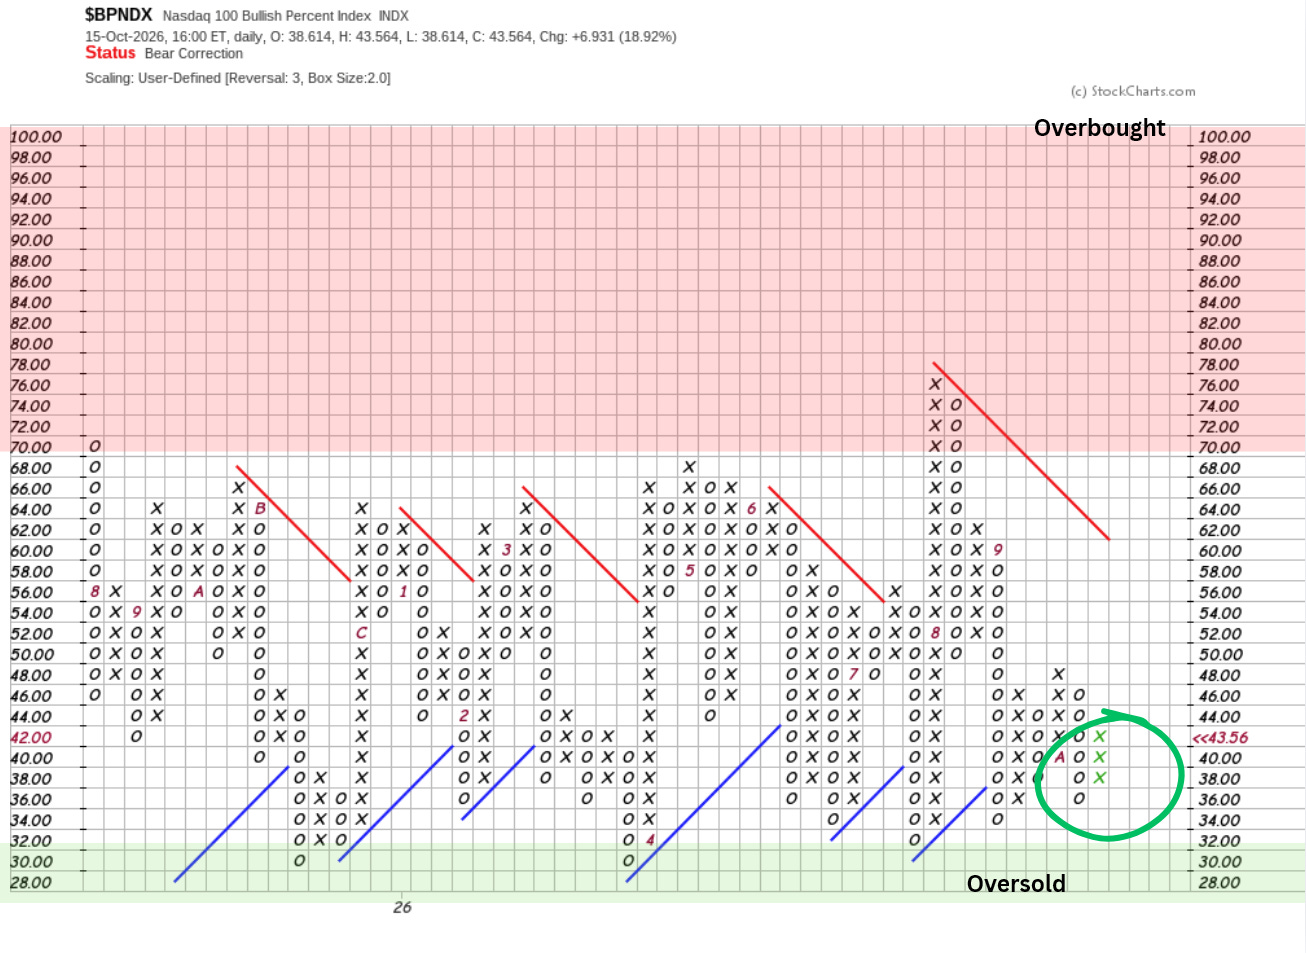
This tells me interest in high-beta and growth stocks is increasing.
I am also seeing the rotation out of value and into tech begin on the hourly RRG chart:
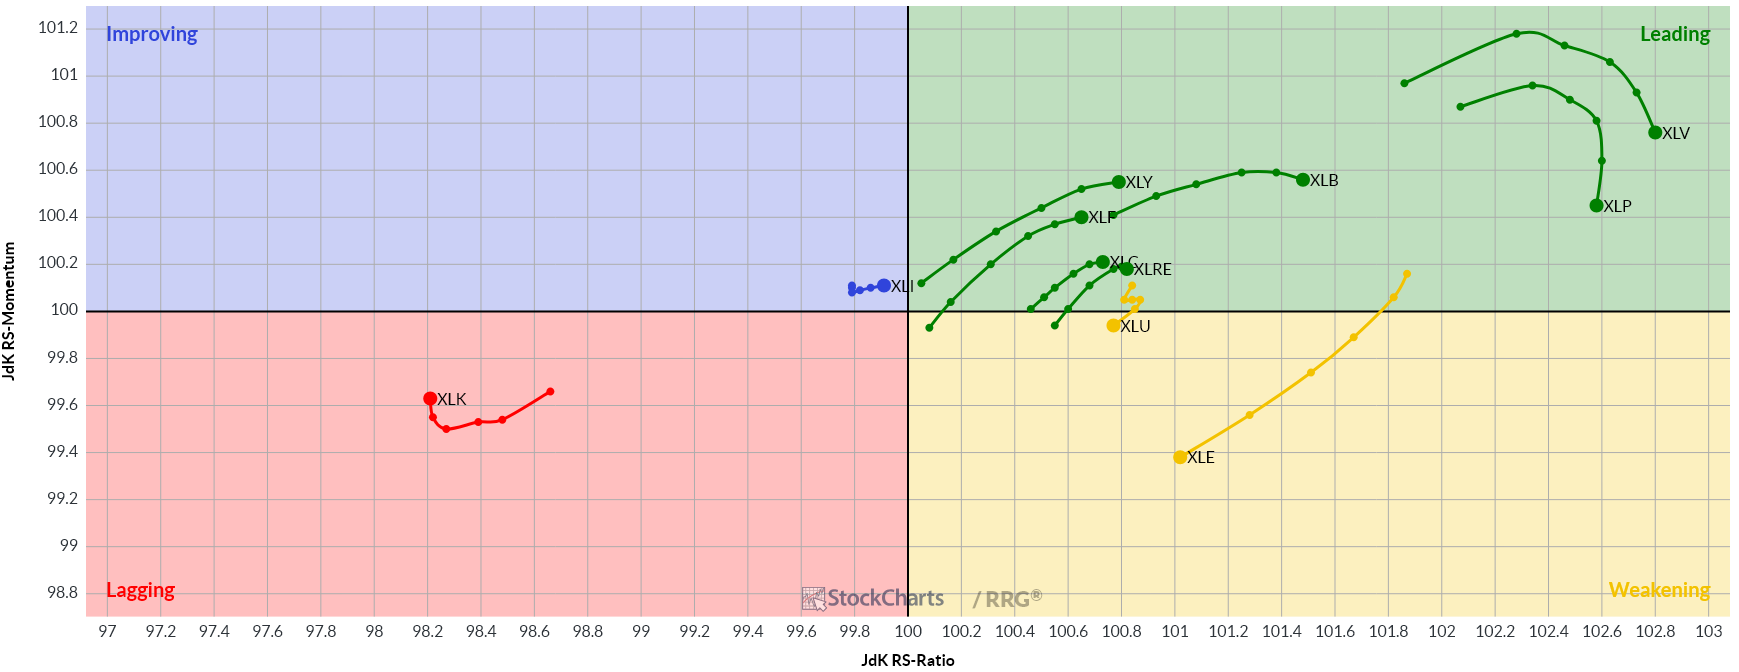
These are all early indications, but the problem with shorter timeframes is that they are more volatile and can reverse quickly.
4th Quarter Stock Market Rally?
To help determine whether this move back into tech is the start of a longer-term trend that fuels a fourth-quarter rally, I will be watching semiconductor stocks.
Semiconductor stocks have a significant weighting in the S&P 500 index. When they move, the market tends to follow.
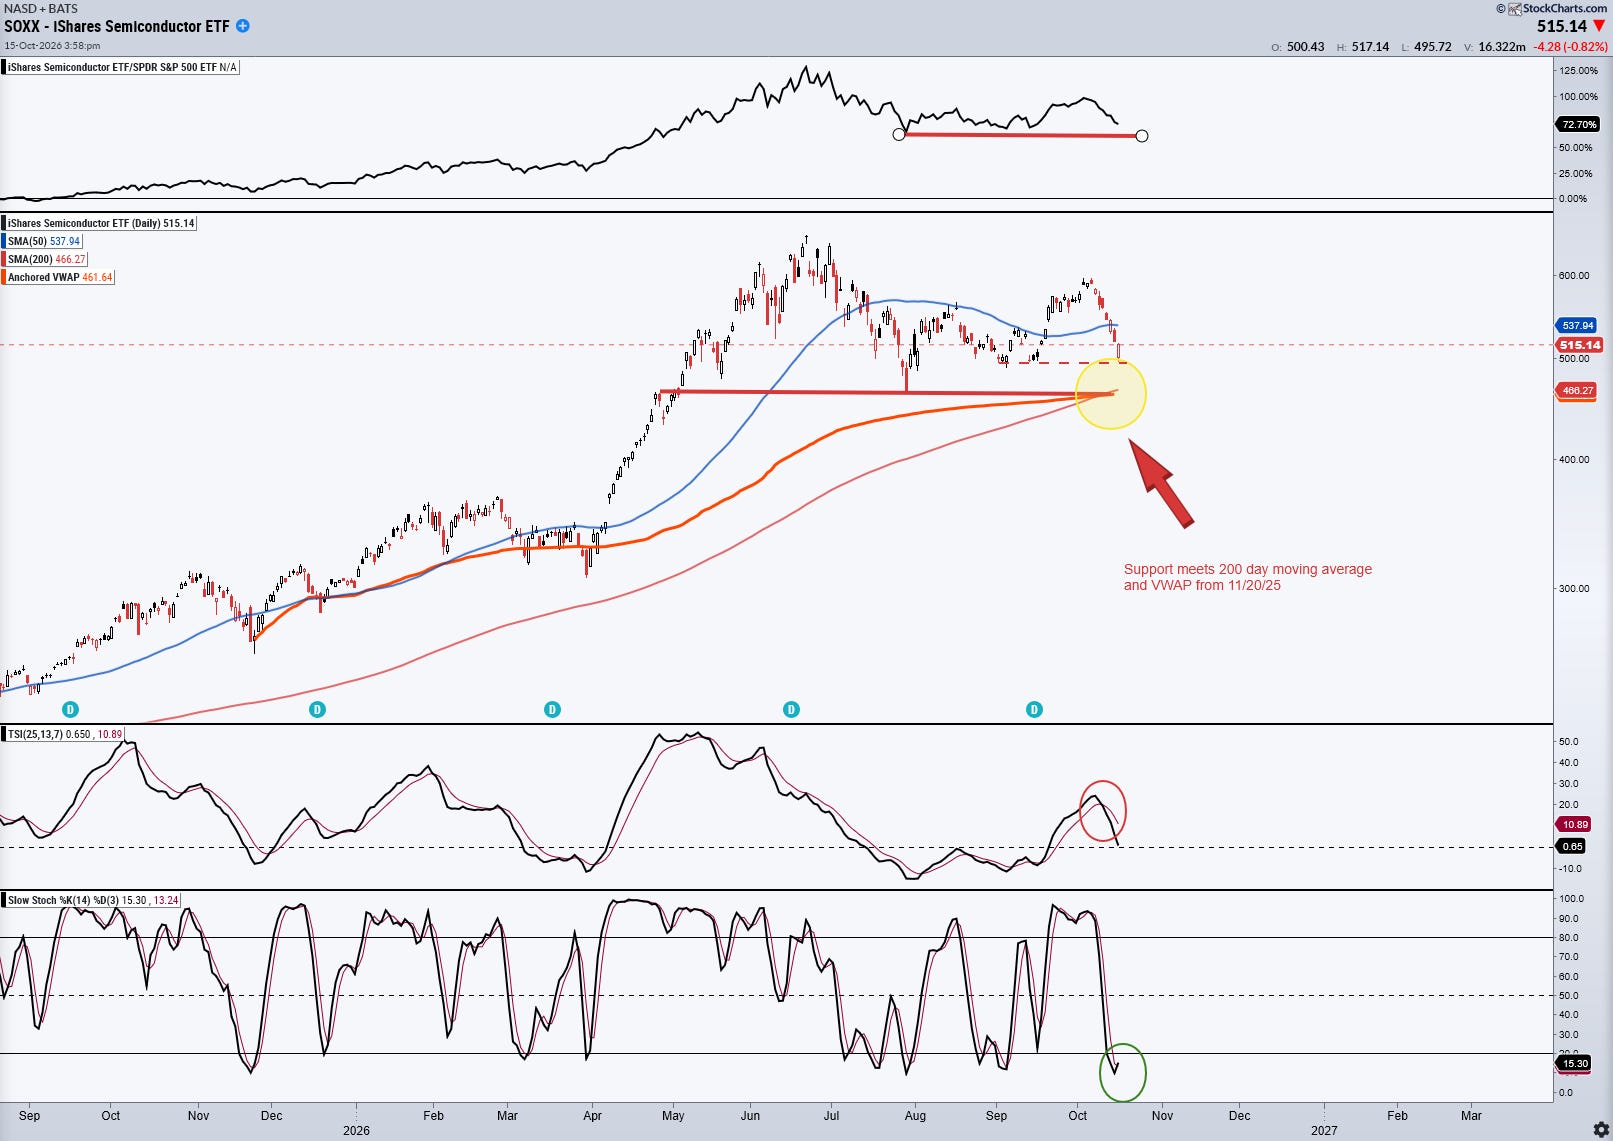
The iShares Semiconductor ETF (SOXX) tracks the NYSE Semiconductor Index. Currently, SOXX is oversold and trading at a minor support level.
I will be watching these support levels to see if semiconductor stocks start to rise from oversold conditions, or if buyers are waiting for a retest of the July 29 low.
I am also closely watching how traders are treating low-volatility sectors like Utilities. While the Bullish Percent Index for the Utilities sector is very oversold, it is on the verge of reversing back into a column of Os:
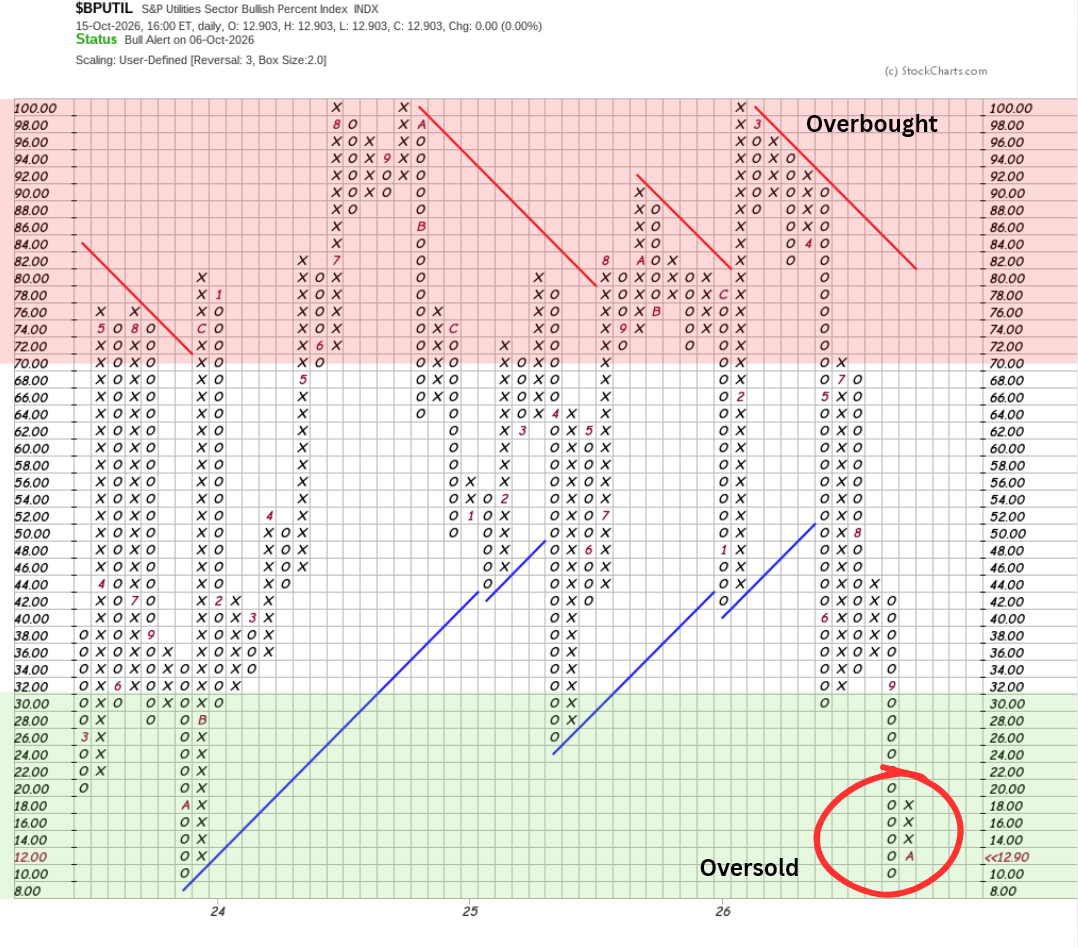
This is a more important signal than I think many realize. Earlier this year, the S&P 500 declined nearly 10%:
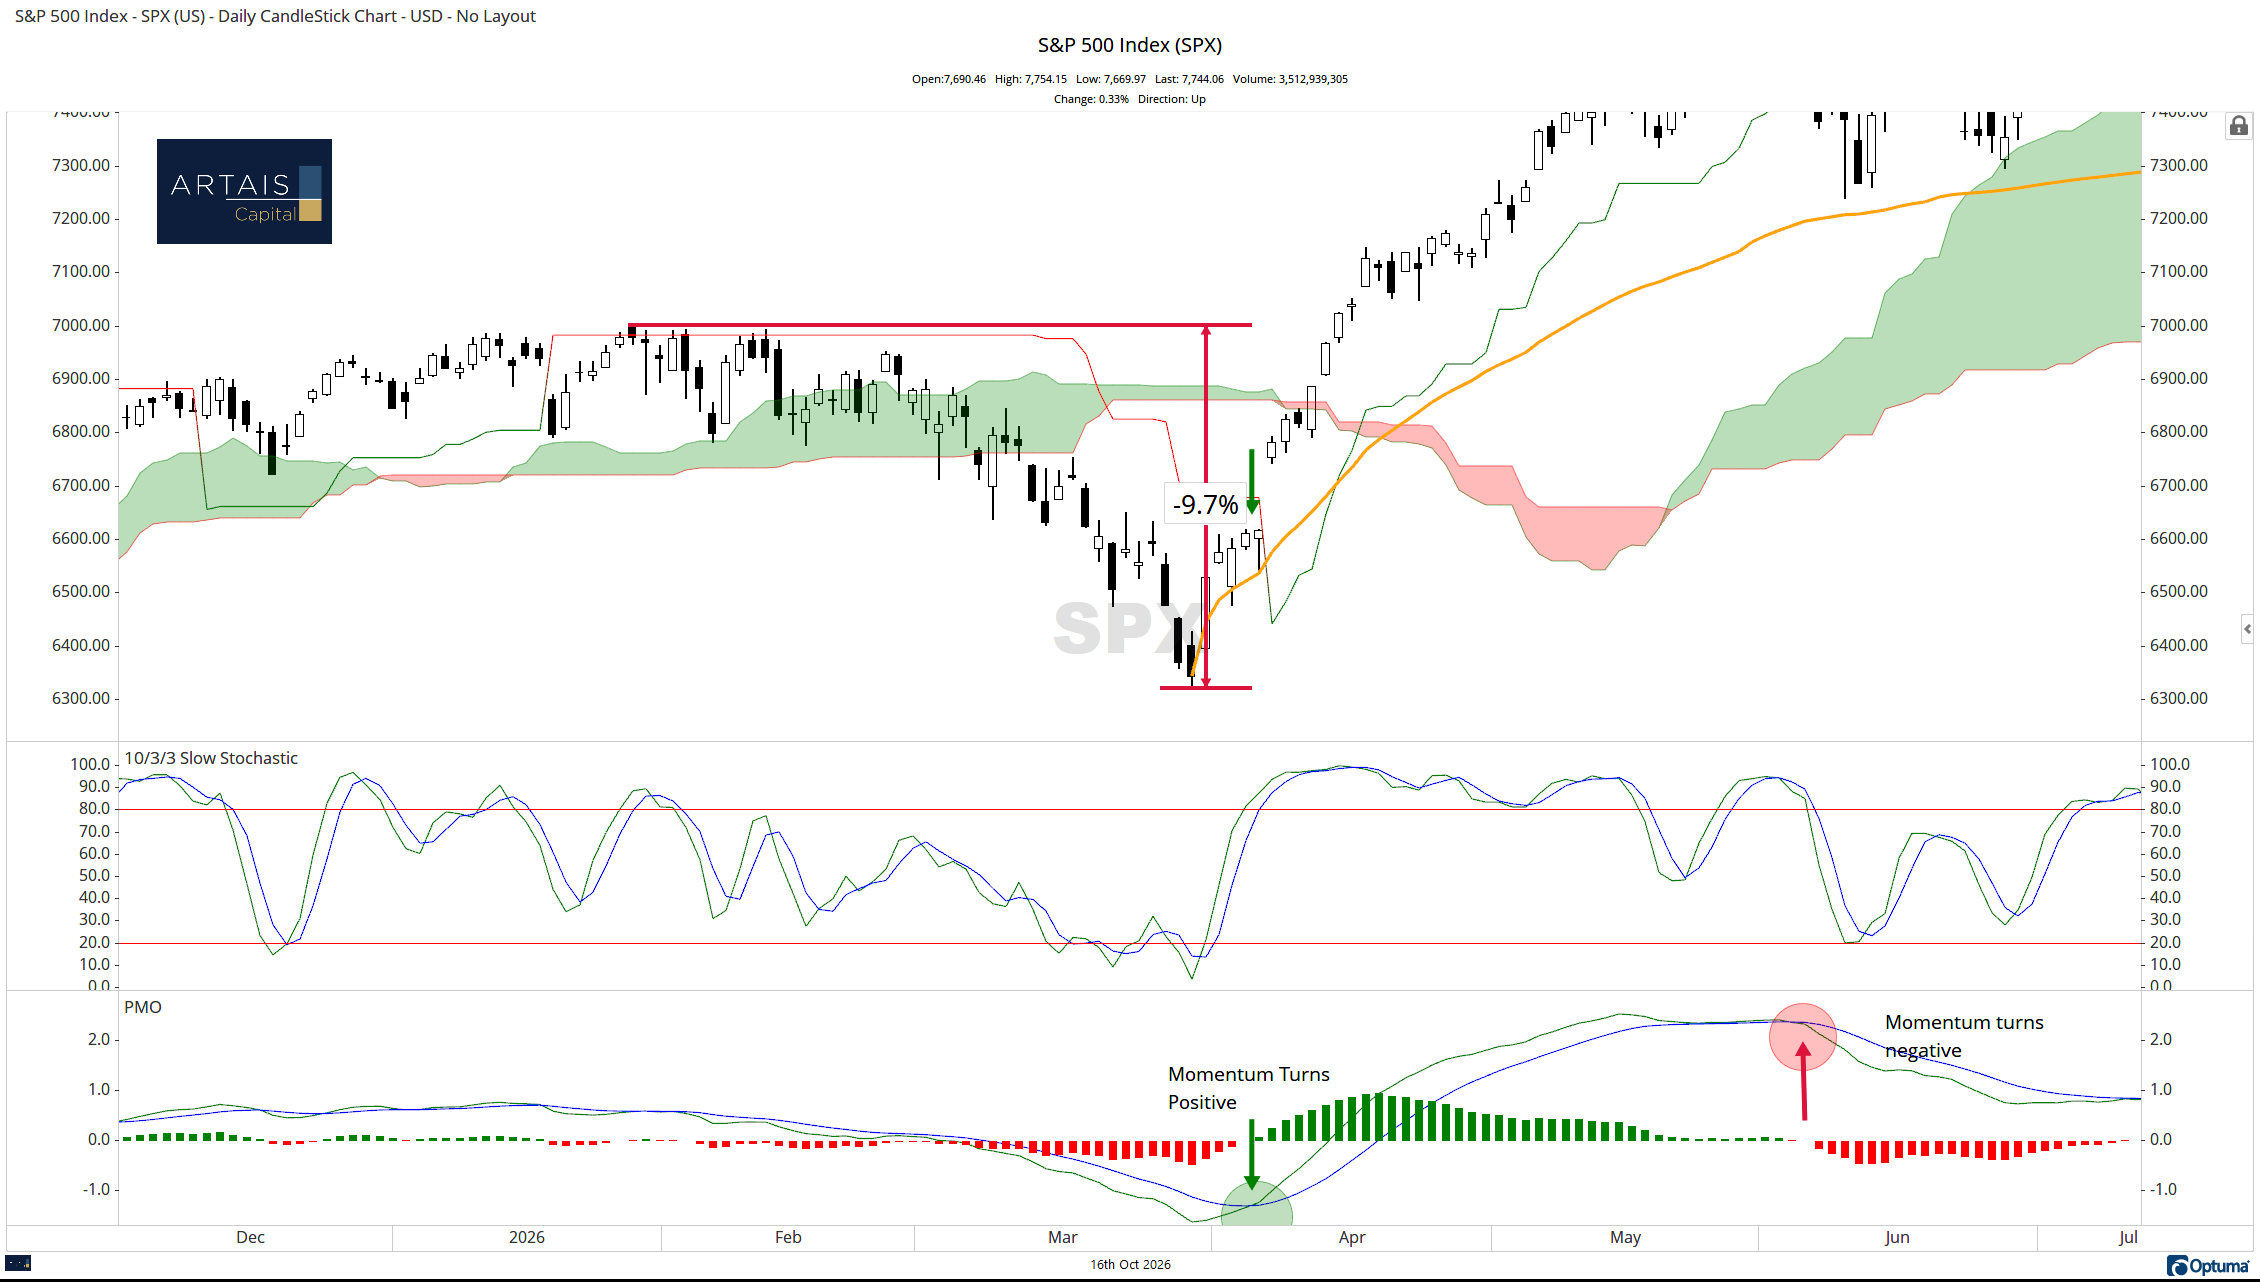
During this decline, the Utilities Bullish Percent index was rapidly rising, as investors fled to low-volatility names:
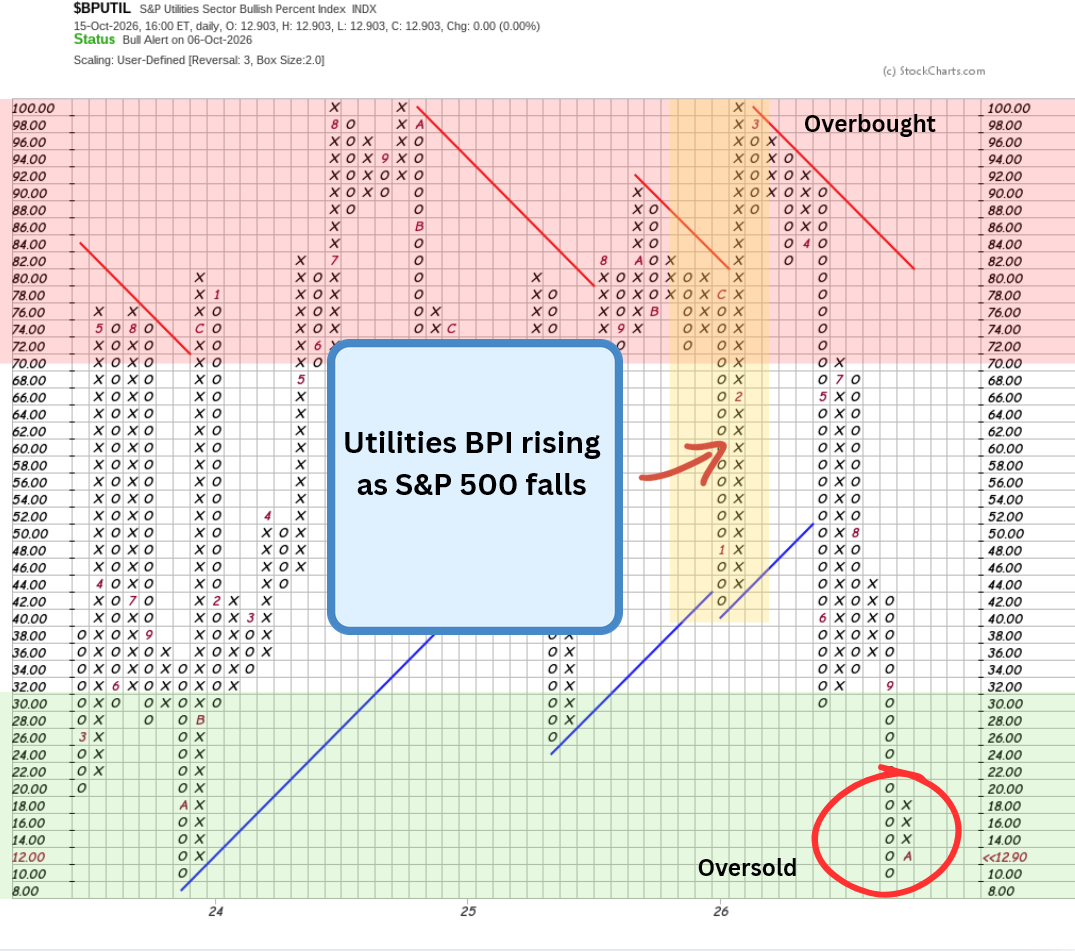
As of now, the demand for Utility stocks is low, again indicating that investors are not fleeing the market; they are just waiting.
The 30,000-Foot View
Zooming out to take a 30,000-foot view of the market, I am seeing continued sector rotation in a sideways trading range.
We are nearing three catalysts that can push the market out of this trading range. Here they are again, as I wrote earlier this week:
Tech earnings. Starting next week, major tech companies begin reporting earnings. Investors will be watching this space closely to see if growth in AI is continuing to improve at a rapid pace.
The Federal Open Market Committee (FOMC) meets October 27-28. US Treasury bond yields have been rising, in part due to inflation fears and worries that the Fed is making a policy mistake by not raising rates.
Currently, there is a 31% chance that the Fed raises rates. But the odds have been changing rapidly with every new piece of inflation or economic data.
A month ago, there was a 43.5% chance that the Fed would raise rates. Then last week, those odds dropped to 17%. There is a chance the market may be surprised at what the Fed actually does during the FOMC meeting.
The midterm elections. As I have discussed numerous times, the fourth quarter of a midterm year and the year that follows have historically been a very good time to own equities.
This means that “if” investors believe we will see a similar trend play out this election, we should be seeing stocks, especially high-beta stocks, rising.
But this hasn’t been the case. Investors may be waiting for a clearer picture from these three catalysts, which is why I think we are nearing a decision point.
Depending on the outcome of these three catalysts (assuming no major escalation in the Iran war), the S&P 500 index should be able to exit its sideways trading range in the next few weeks.
I will be closely watching the relationship between high-beta vs. low-volatility names to see how investors are handling the results of these upcoming catalysts.
ARTAIS AI Universe Screen
Membership Requirements:
A documented, primary role in the AI value chain. A company qualifies when there is dated public evidence that a meaningful part of its business supplies, houses, powers, or…
For paid subscribers:
Today’s ARTAIS Screen results, updated every trading day
Active signals, stops, and targets
Which names just passed or failed the screen